

 PDF
PDF ePub
ePub Citation
 Print
Print


Introduction
The cranial index is widely used as a tool for estimating an individual's ancestry in forensic anthropological analyses. Historically, the ‘cranial index’ became a popular measure in “racial” studies to categorize human groups in the late nine-teenth century [1]. Moreover, currently univariate analyses using this index cannot compete with multivariate techniques [2]. However, variation of the cranial shape is known to be associated with specific ancestral groups although there is still controversy surrounding cranial index. Besides, this index is generally known to be higher in females than in males regardless of the degree of interethnic variability. In this context, the cranial index can be an important parameter when attempting to quantify population differences and understand human variations among populations. In particular, it can assist forensic anthropologists with the categorization of human skulls, which may be an important component in the identification of highly decomposed bodies and skeletal remains [3]. Additionally, this index is clinically used as an anthropometric parameter in assessments of growth, development and specific disorders in relation to clinical diagnose and treatments. For example, it has been reported that dolichocranic individuals have less otitis media often than brachycranic individuals [4]. Another finding showed that individuals with Apert's syndrome are hyperbrachycranic [5].
The cranial index is the ratio of the maximum breadth of the cranium multiplied by 100 divided by its maximum length. Traditionally, crania are classified into broad categories based on shape variations from the index. Crania for which the length is greater than the breadth are classified as long and are termed dolichocranic, crania of intermediate lengths are called mesocranic, and crania with a greater breadth than the length are known as brachycranic [2]. Previous studies suggest that African crania were predominantly dolichocranic, while the crania of Europeans were categorized as brachycranic [67]. Accordingly, the index is specific to the population being examined. Among Asians, Japanese are mesocranic and Siberians are mesocranic or brachycranic in the cranial index [8]. In addition, generally Korean crania were classified as brachycranic [9]. Comparative studies show that the cranial shapes in Asians varied greatly according to the region [10].
In this context, the purpose of the present research is to examine the cranial index in a modern people of Thai ancestry. This study will help to creating a databank in the overall cranial index for the classification of Asian populations and will serve as a reference for forensic anthropologists when they attempt to identify unknown human remains.
Materials and Methods
In this study, 185 modern crania of adults (18 years and above) of supposed Thai ancestry were utilized. They were sourced from the Department of Anatomy of Chulalongkorn University in Bangkok, Thailand. However, unfortunately, no information of age at death, sex, cause of death and pathological histories was provided for the sample from Chulalongkorn University. This crania sample was made in an anatomy collection in Bangkok and the fact means they represent Thai people. Nevertheless, we stated it represent a sample of crania of people of supposed Thai ancestry because this cranial sample does not constitute a biological population without any biological records.
The adult ages of the crania were confirmed based on the closure of the spheno-occipital synchondrosis and on dentition [11]. Due to the lack of post-cranial elements, sex estimation of the crania was carried out on the basis of morphological analysis using the cranial features such as mastoid process, glabella, nuchal crest and supraorbital margin [1213]. As a result, crania were divided into 116 males and 69 females. Individuals which some overlapping ranges lead to an indeterminate sex determination were excluded from the analysis. Additionally, crania with fractures, abnormalities or disease (e.g., congenital anomaly or metastatic cancer) were excluded given that abnormal conditions may affect the cranial index.
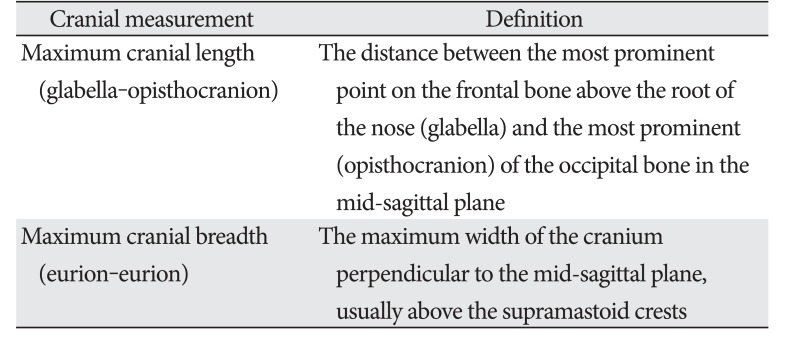
The maximum cranial length and breadth were measured using standard anthropometric instruments (spreading calipers with pointed ends) based on Martin's method [14]. The landmarks used for the measurements are described in Table 1. The cranial index was calculated using the equation (maximum cranial breadth/maximum cranial length)×100. The index was calculated from the ratio between averages. The data compiled were compared with earlier findings. The data were analyzed statistically using SPSS version 18. To identify significant mean differences between populations, t-tests were conducted. For comparisons of the indices between populations, modern Central Thai, Northeastern Thai, and Korean data were used.
Results
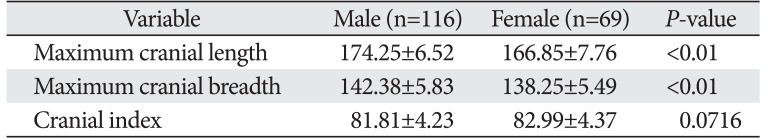
The measurements and index used for the crania of the modern Thai people are shown in Table 2. According to the measurements, the skull of a male is larger and higher than that of a female. The corresponding average maximum cranial length and maximum cranial breadth found in study were 174.25 mm and 142.38 mm in males and 166.85 mm and 138.25 mm in females. The mean cranial indices for the male and female skulls examined were 81.81±4.23 and 82.99±4.37, respectively. The cranial measurements under study show that the crania of Thai males are larger than those of Thai females with statistical significance (P<0.01), as shown in Table 2. However, there were no significant differences between the cranial indices of the male and female crania (P<0.05).
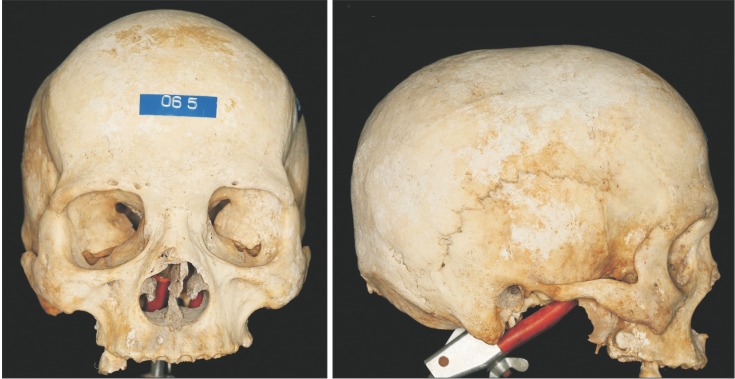
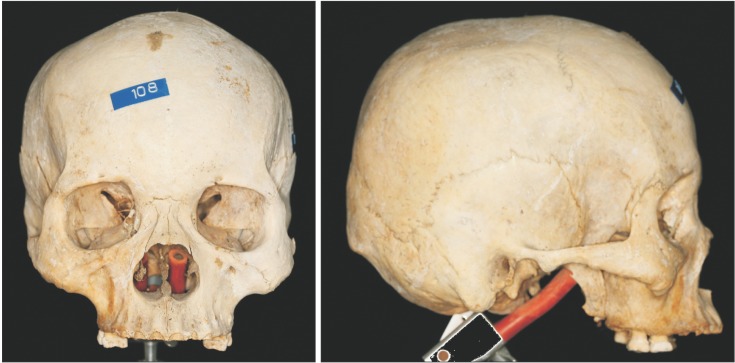
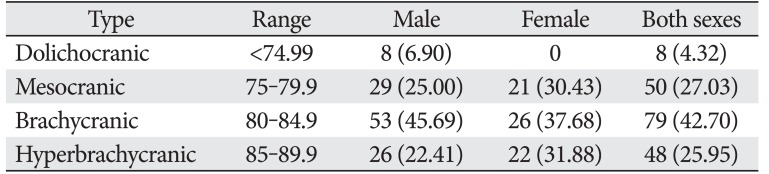
On the basis this study, it was concluded that the most common type of skull in the modern Thai population was brachycranic with a frequency of 42.7%, followed by the mesocranic (27.03%) and hyperbrachycranic types (25.59%) (Table 3). The rarest type observed in this study is the dolichocranic type (4.32%). In the female population, no dolichocranic types were observed. Among both sexes, the brachycranic type (42.7%) dominated (see example Figs. 1, 2). However, among males, the brachycranic type (45.69%) was most common, and followed by the mesocranic (25%), hyperbrachycranic (22.41%), and dolichocranic type (6.9%). In females, the bracycranic type (37.68) predominated with the hyperbrachycranic (31.68%) and mesocranic types (30.43%) following.
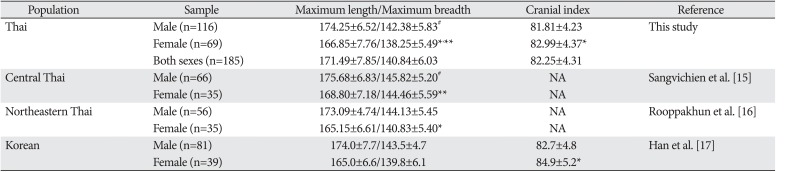
Table 4 presents a comparison of the craniometric data in the present study and that in previous research. Our data are compared in Table 4 with modern Thai skulls found in central and northeast regions of Thailand. In addition, modern Thai populations were compared with modern Koreans to identify any difference from another Asian population. Cranial measurements suggest that the cranial sizes of the Thai males under study are not significantly different, except for the central Thai males. Meanwhile, the maximum length and maximum breadth in the Thai females under study were significantly different from the central and northeast Thai female population. However, cranial measurements for both sexes from Thailand show no significant differences from modern Koreans. Only, the cranial index of Thai females in the current study is significantly different from that of modern Korean females.
Discussion
The present study provides valuable data pertaining to the cranial index in a modern Thai population, and revealing that modern Thai males and females belong to the brachycranic group. This result is consistent with earlier studies of modern Thai populations in that the craniometric data from the present study and the earlier reports are quite similar [1516]. Specifically, our findings were more similar to the findings by Rooppakhun et al. [16] and less similar to the measurements published by Sangvichien et al. [15]. The publication of Rooppakhun et al. [16] was based on Thai skulls found in the north-eastern region of Thailand, while the data from Sangvichien et al. [15] and that in the present study were based on Thai skulls from the central region of Thailand. Previously, Rooppakhun et al. [16] suggested that the craniometry of the Thai people differs by region. According to the study of Rooppakhun et al. [16], the craniometry of people in the northeast region is different from that of the people from the central region, with the difference statistically significant. However, the data here is not in accordance with that in previous report. This may be due to the different source properties of the specimens as compared to regional differences. Related to this difference, Freas [18] suggested the relative craniometric homogeneity of modern Thai population based on craniometric data.
It is widely known that are sex differences between male and female skulls. Sex determination for skeletonized human remains has played an important role in the process of forensic identification. Highly significant sexually dimorphic differences in size have been found in earlier cranial studies [1920]. The present study is in good agreement with previous research in this area. Cranial measurements under study show that the crania of Thai males are larger than those of Thai females at a statistically significant level (P<0.01). However, there were no significant differences in the cranial indices of the male and female skulls (P<0.05). In an osteometric study of East and Southeast Asian populations by King [21], the cranial shape differences were not significant, although males exhibited larger mean dimensions than females. In addition, research by Green and Curnoe [20] suggested that Southeast Asians are less sexually dimorphic in terms of the cranial shape than other populations. However, it appears that more research is necessary to prove the degree of cranial shape dimorphism in Southeast Asians.
The cranial index has also been used to quantify population differences [2]. In a study by Howells [22], an Asian group was found to have the largest cranial breadth among world populations. In Asian groups, dolichocranic type is rare, whereas brachycranic is rare in African populations [23]. In the current study, 42.7% of the skulls were observed to be brachycranic, with the mesocranic and hyperbrachycranic types the next most frequent and, as mentioned earlier. The rarest type observed in this study was the dolichocranic type. However, prehistoric skulls from the Ban Chiang site in northeast Thailand showed both sexes are predominantly mesocranic type, inconsistent with the present study [24]. Over the last 100 years, changes in cranial shapes have been reported in many countries [25]. In Japan, brachycephalization has continued since the medieval period [25], and the brachycephalization of Korea appeared over a short period of time in the twentieth century [9]. In this context, the current cranial shape under study may be related to the late secular change in Thailand. Additionally, paleoanthropological data suggest that early man was general dolichocranic, while later brachycephaly diffused as a result of repeated mutations and various other factors [23]. However, variation between and within populations is attributed to complex interactions between genetic and environmental factors [26]. The environmental factors that may affect the cranial shape include cultural influences, climate and nutrition [27]. Interestingly, even dietary habits have been shown to influence the craniofacial form of a population [26]. Accordingly, it is at present difficult to imagine cases in which the cranial index is not taken into account as an exclusive tool for classification in ancestral studies [2].
Craniometric studies of various Asian groups have described significant differences between Asian populations [28]. In particular, geographical variations of the morphologies in East Asia, defined here as the region between Siberia in the north and the islands of Southeast, are well documented [29]. Specifically, East/North Asian groups commonly display a series of features, such as non-projecting noses, facial flatness, round eye sockets and brachycranic vaults, while these features are less intense in the Southeast Asian cranial series [10]. Regarding the present separation between northern and southern Asian groups, a number of scholars currently hold that these distinguished features were caused by long-term accumulated continuity within regions [1030]. In the current study, the cranial measurements from Thailand showed no significant differences from those of modern Koreans. Only, the cranial index of the Thai females under study was significantly different from that of modern Korean females. In addition, a comparison of cranial measurements between populations from Thailand suggests that the skulls of Thai females differ significantly according to the region. In this study, Thai males were found to be significantly different from other Thai male populations from the same region (i.e., central Thailand). According to research on secular trends in the cranial shapes of modern Koreans, secular changes in females are more evident than those in males [9]. Meanwhile, Japanese data showed changes in only the cranial breadth for the sexes. In this way, secular trends vary according to the geographical context. Thus, the results of this study may be related to the pattern of secular change in Thailand.
Some scholars have become very cautious about relying on single index value representations of complex biological data [3132]. Nevertheless, numerous publications continue to use the cranial index for forensic purposes [33]. Despite the recognized problems association associated with the cranial index, its application may be valid in the forensic context. In fact, studies of cranial indexes among Asians remain limited due to the lack of skeletal material available. Thus, the results of this study will be of forensic and anthropologic importance to those who study populations from the locations where the skulls studied here were found.
 XML Download