Abstract
Background and Objectives:
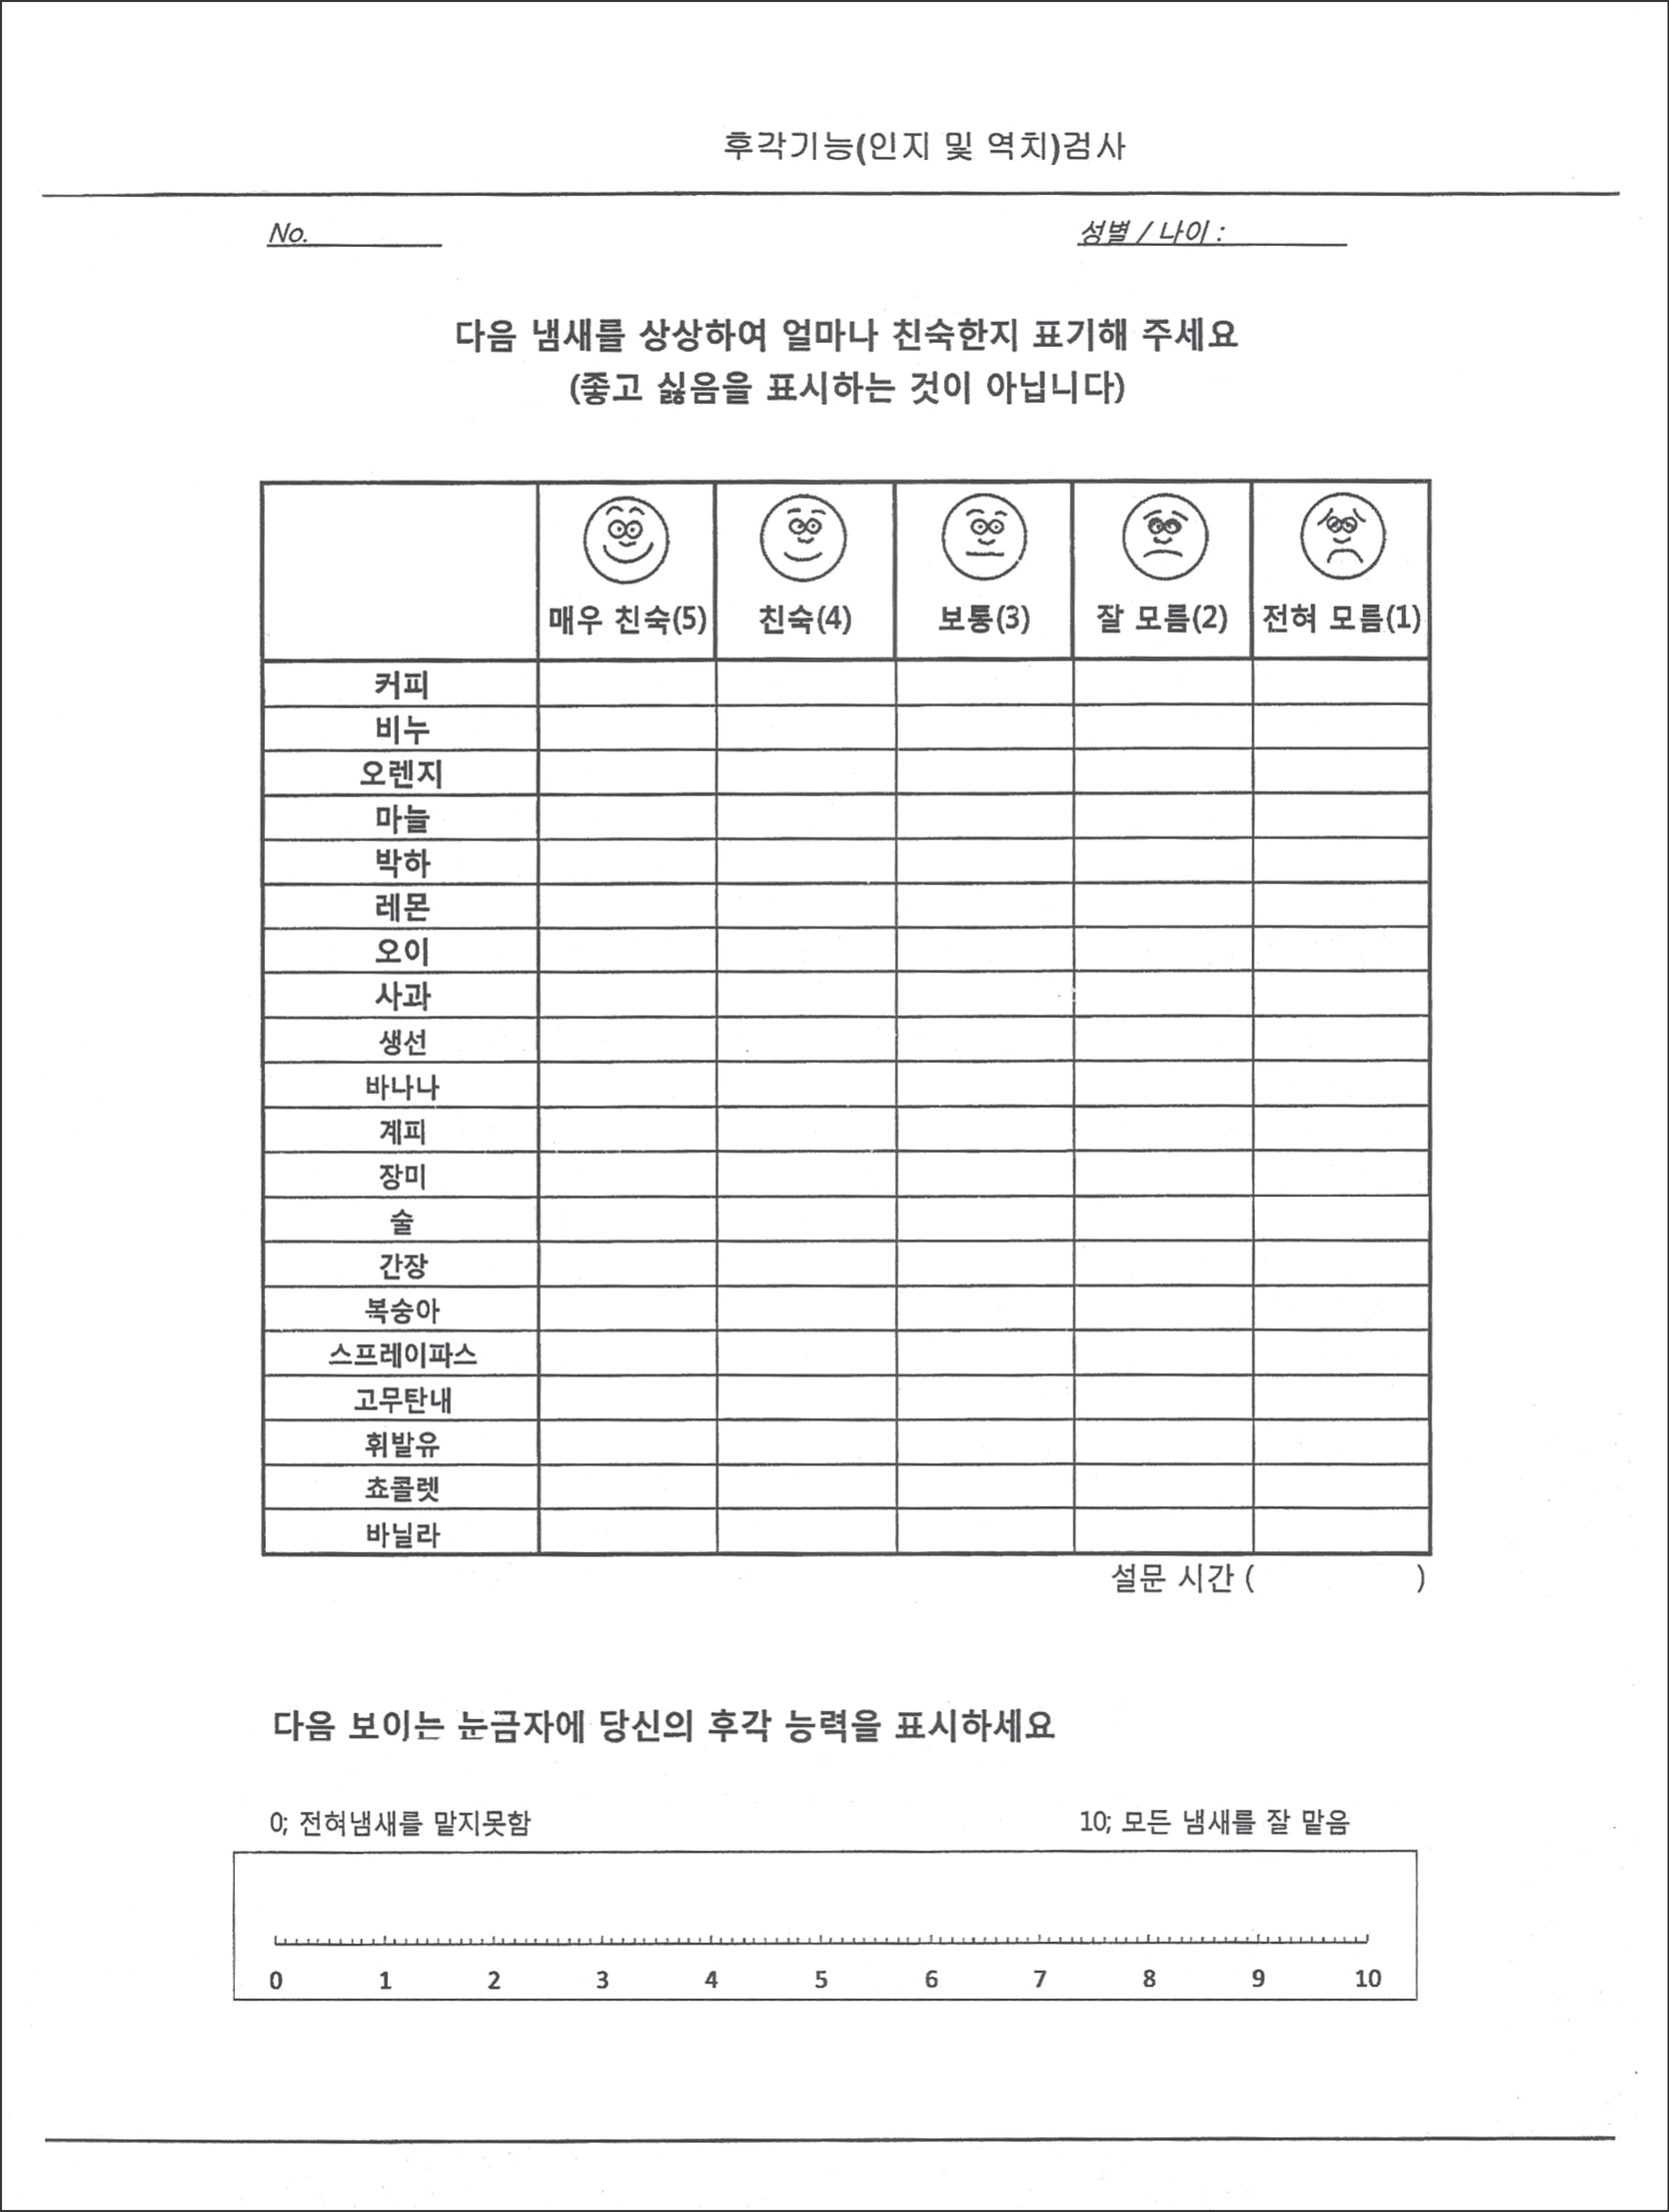
The scent survey for screening (SSS) test is a subjective olfactory questionnaire devised for this study. We demonstrated the correlation of the SSS test with other olfactory tests and the efficacy of the SSS test as an olfactory screening test compared to KVSSII.
Subjects and Method:
A total of 363 patients who visited our ORL outpatient department underwent the SSS test, VAS, and KVSS I and II. The patients were divided into two groups, a group with normal olfactory function and a group with olfactory dysfunction according to the KVSS II test. In each group, the correlations between the olfactory tests were studied, and the cutoff value of the SSS test as a screening test was investigated.
Results:
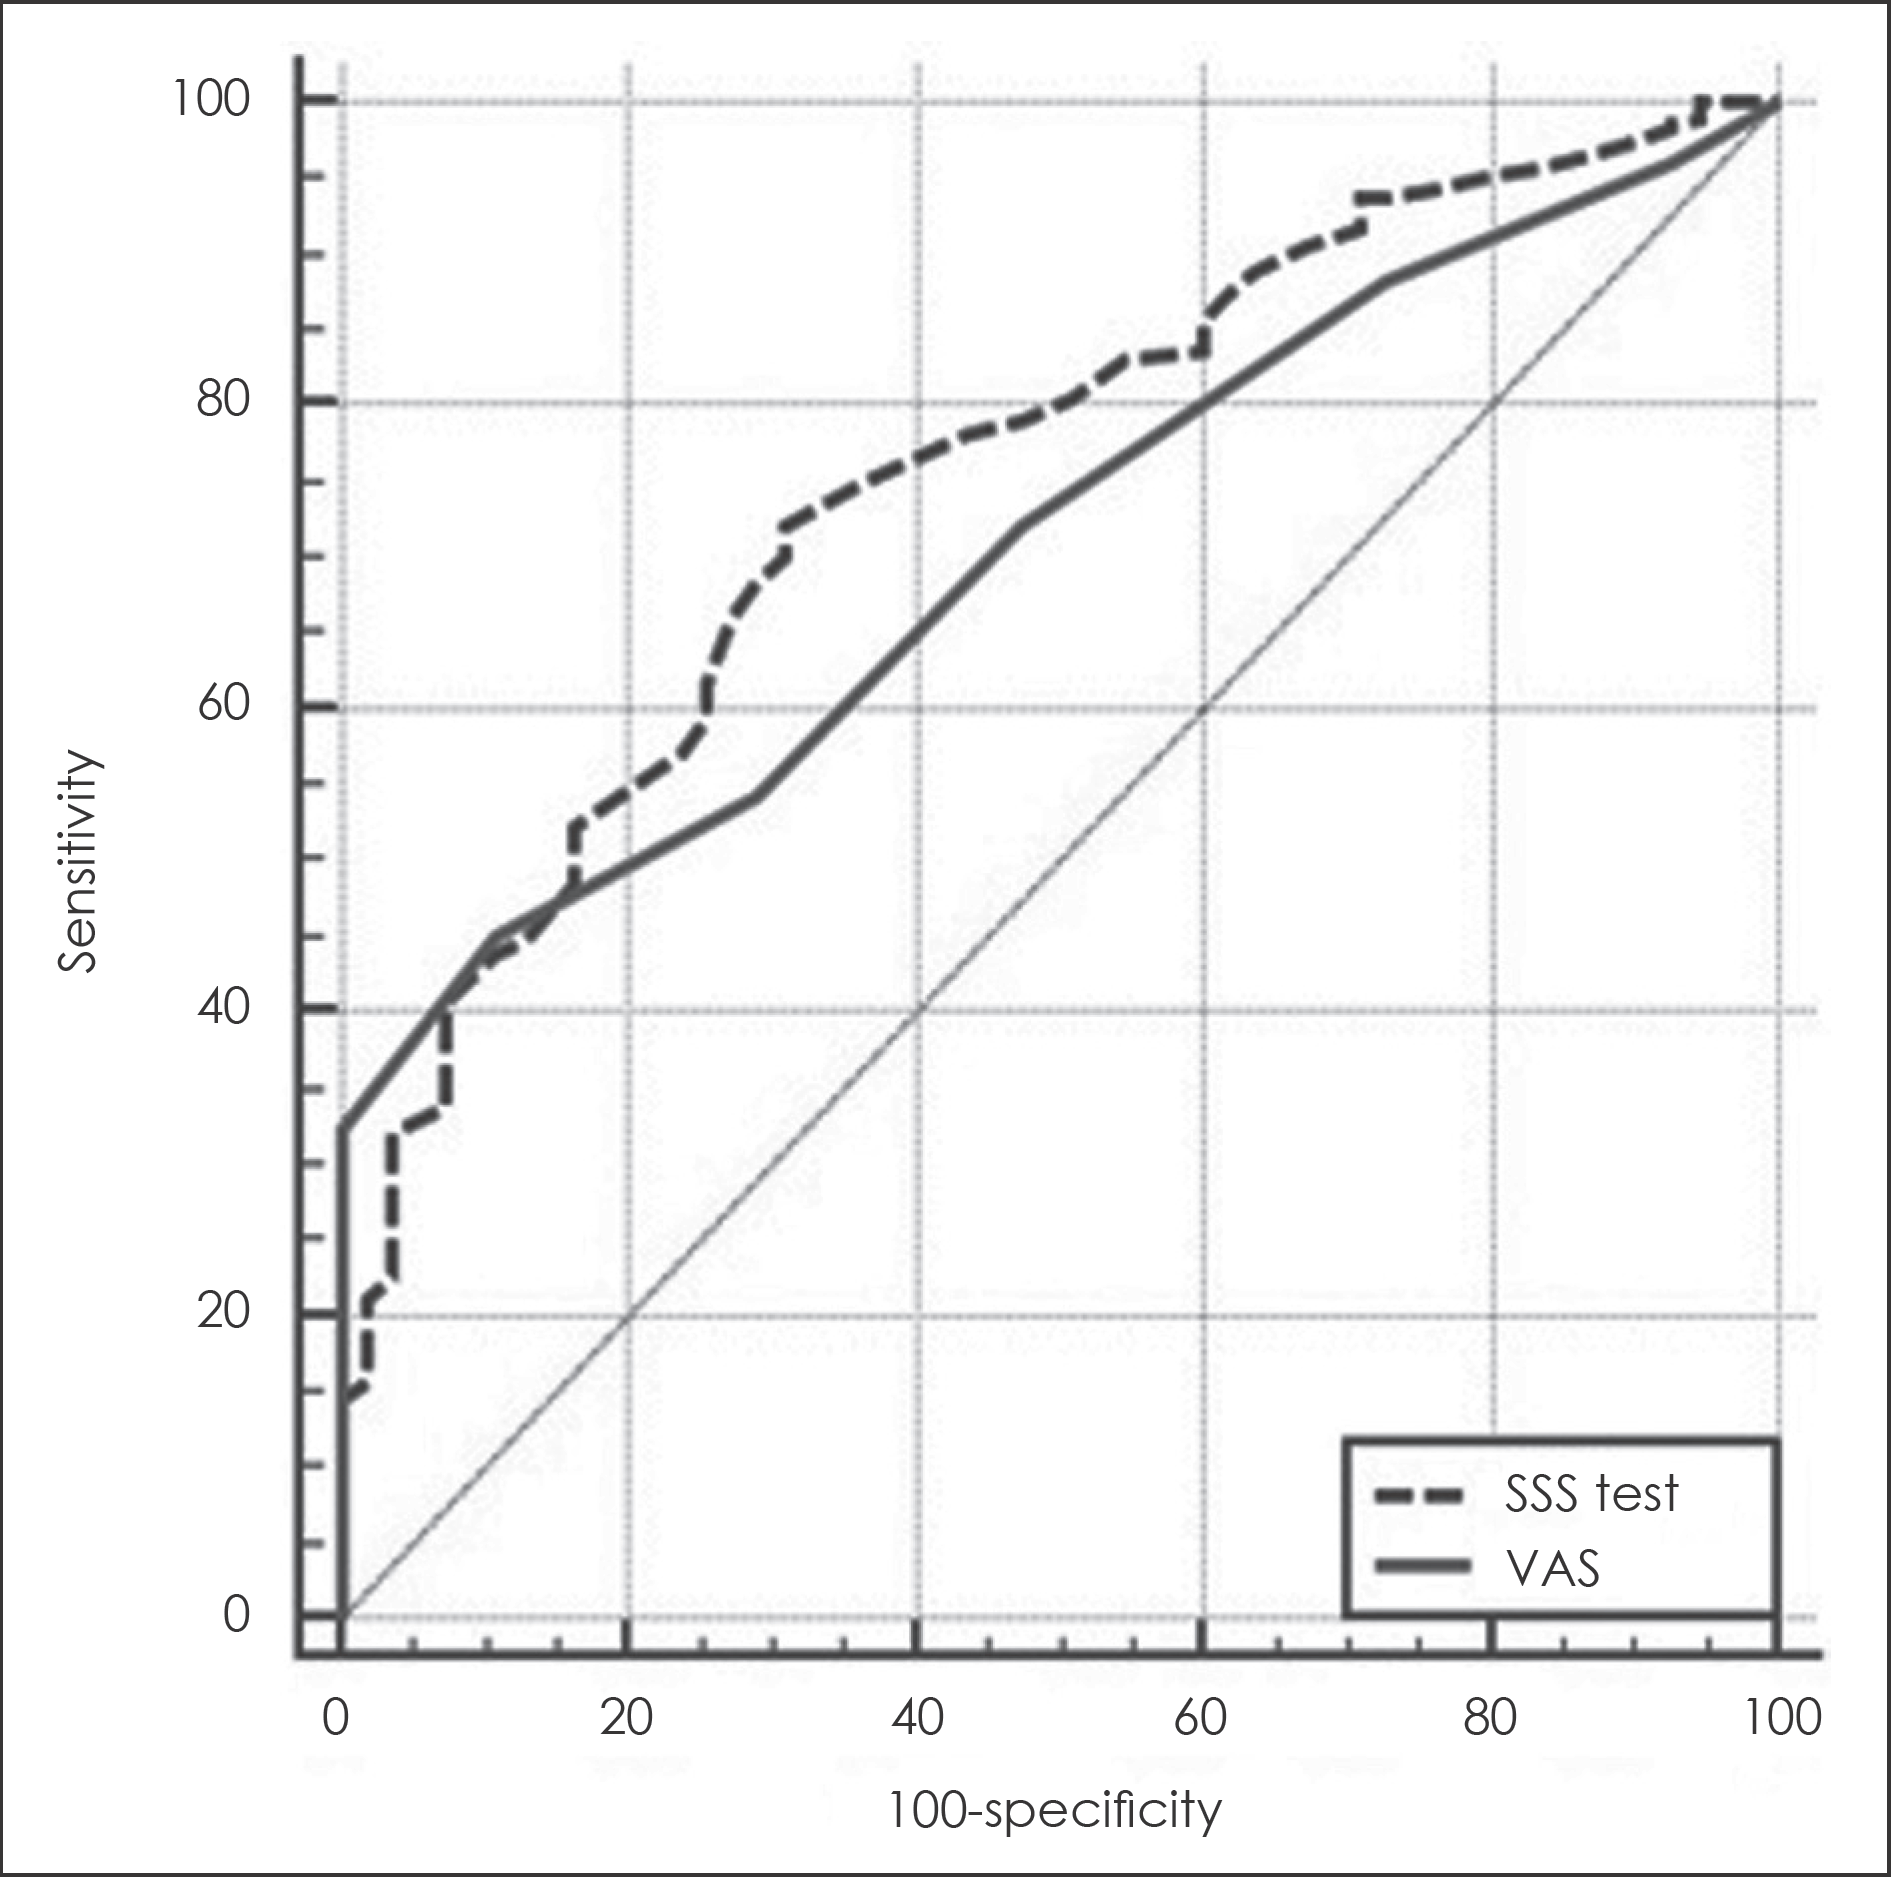
There was positive correlation between CCSIT and KVSS I, II, T, D, and I tests and the SSS test in the total group and in the olfactory dysfunction group (p<0.05). The identification test in the KVSS II showed the highest positive correlation. While the cut-off value of normal olfactory function in the KVSS II is 28, the SSS test showed the highest specificity and sensitivity of 74 under an ROC curve.
Go to : 
REFERENCES
1). Deems DA., Doty RL., Settle RG., Moore-Gillon V., Shaman P., Mester AF, et al. Smell and taste disorders, a study of 750 patients from the university of Pennsylvania smell and taste center. Arch Otolaryngol Head Neck Surg. 1991. 117:519–28.

3). Choi SH., Kim ST., Park HM., Moon KH., Jung JH., Cha HE. Analysis of characteristics and Steroid Effects in Olfactory Dysfunction Patients. J Rhinol. 2016. 23(1):39–43.

4). Jung DH., Paik SI., Jung YK., Kim KB. Clinical Analysis of Olfactory Dysfunction. J Rhinol. 1995. 2(2):118–23.
5). Landis BN., Hummel T. New evidence for high occurrence of olfactory dysfunctions within the population. Am J Med. 2006. 119(1):91–2.

6). Lee WH., Wee JH., Kim DK., Rhee CS., Lee CH., Ahn S, et al. Prevalence of subjective olfactory dysfunction and its risk factors: Korean national health and nutrition examination survey. PLoS One. 2013. 8(5):e62725.

7). Scott AE. Clinical characteristics of taste and smell disorders. Ear Nose Throat J. 1989. 68:297–315.
8). McCormack HM., Horne DJ., Sheather S. Clinical applications of visual analogue scales: a critical review. Psychol Med. 1988. 18:1007–19.

9). Croy I., Nordin S., Hummel T. Olfactory Disorders and Quality of Life. Chem Senses. 2014. 39:185–94.
10). Hong SC., Yoo YS., Kim ES., Kim SC., Park SH., Kim JK, et al. Development of KVSS Test (Korean Version of Sniffin' Sticks Test). Korean J Otolaryngol. 1999. 42:855–60.
11). Cain WS. Testing olfaction in a clinical setting. Ear Nose Throat J. 1989. 68:316–8.
12). Doty RL., Marcus A., Lee WW. Development of the 12-item Cross-Cultural Smell Identification Test (CC-SIT). Laryngoscope. 1996. 106:353–6.
13). Cho JH., Jeong YS., Lee YJ., Hong SC., Yoon JH., Kim JK. The Korean version of the Sniffin' stick (KVSS) test and its validity in comparison with the cross-cultural smell identification test (CC-SIT). Auris Nasus Larynx. 2009. 36:280–6.

14). Kim JM., Jeong MS., Shin DH., Seol JH., Hong SC., Cho JH, et al. Olfactory Identification Test Using Familiar Distracters for Koreans. Clin Exp Otorhinolaryngol. 2014. 7(1):19–23.

15). Ferdenzi C., Coureaud G., Camos V., Schaal B. Human awareness and uses of odor cues in everyday life: Results from a questionnaire study in children. Int J Behav Dev. 2008. 32:422–31.

16). Martin GN., Apena F., Chaudry Z., Mulligan Z., Nixon C. The development of an attitudes towards the sense of smell questionnaire (SoSQ) and a comparison of different profession's responses. N Am J Psychol. 2001. 3:491–502.
17). Song SW. Using the Receiver Operating Characteristic (ROC) Curve to Measure Sensitivity and Specificity. Korean J Fam Med. 2009. 30:841–2.

18). Bensafi M., Rouby C. Individual differences in odor imaging ability reflect differences in olfactory and emotional perception. Chem Senses. 2007. 32:237–44.

19). Tsuzuki K., Fukazawa K., Takebayashi H., Oka H., Miwa T., Kurono Y, et al. Olfactory evaluation using a self administrated odor questionnaire. Jpn J Rhinol. 2009. 48:1–7.
Go to : 
Table 1.
Demographic data result and Olfactory test result (n=363)
Table 2.
Correlation between SSS and other olfactory tests
Table 3.
Comparison of ROC curves
| AUC | SE | 95% CI | |
|---|---|---|---|
| SSS test | 0.754 | 0.0331 | 0.706-0.797 |
| VAS | 0.707 | 0.0314 | 0.658-0.754 |
Table 4.
SSS test of Criterions values and coordinates of the ROC curve


 PDF
PDF ePub
ePub Citation
 Print
Print


 XML Download