

 PDF
PDF ePub
ePub Citation
 Print
Print


Optical coherence tomography (OCT) allows real-time cross-sectional imaging of the retina with high axial and transverse resolution [1]. OCT is a useful diagnostic modality for assessing glaucoma and macular disease. Many studies have evaluated changes in the retinal nerve fiber layer (RNFL) and macular thickness to assess glaucoma progression and macular disease detection [2345]. OCT image quality is influenced by media opacity, which is altered by cataracts, vitreous opacity, and silicone oil in the vitreous cavity [678]. Thus, changes in media opacity can affect OCT measurements. Previous studies demonstrated that RNFL thickness and macular thickness increased after cataract surgery [891011]. These increases in RNFL and macular thickness could be due to changes in media opacity after cataract surgery rather than postoperative retinal edema [81213].
An ultra-wide-field scanning laser ophthalmoscope (SLO) (Optos Optomap Panoramic 200MA; Optos PLC, Dunfermline, Scotland) allows wide-angle retinal imaging [14]. The Optos Optomap increases the depth of focus, allowing the entire retina to be seen in a single image, and improves the detection of peripheral retinal pathology compared to conventional small-angle fundus imaging [151617]. However, wide-field fundus images can be affected by unwanted artifacts from cataracts, eyelashes, and eyelids due to increased depth of focus [18]. In cataract patients, cataract artifacts frequently obscure the macular area in wide-field fundus photos. As cataract severity increases, the degree of macular obscuring by cataract artifacts increases. Therefore, the aim of this study was to evaluate the effects of cataract grade based on wide-field fundus imaging on the macular thickness measured by spectral domain optical coherence tomography (SD-OCT) and the signal-to-noise ratio (SNR) of SD-OCT.
Materials and Methods
Study population
This retrospective cross-sectional study included 200 eyes from 200 consecutive cataract patients who underwent preoperative wide-field fundus imaging with a wide-field scanning ophthalmoscope, macular SD-OCT using a SD-OCT/SLO system (OPKO/OTI, Miami, FL, USA), and optical biometry using an IOLMaster version 5.4 or higher (Carl Zeiss Meditech, Jena, Germany) at our institute between May 6, 2013 and April 30, 2014. During the study period, patient electronic medical records were reviewed to evaluate the type of cataract and whether abnormal findings were present on the slit-lamp and fundus examinations.
Grades of nuclear opalescence (NO), cortical opacities (CO), and posterior subcapsular cataract (PSC) were recorded using the Lens Opacity Classification System III (LOCS III) [19]. Eyes that could be measured using the IOLMaster were defined as those with at least three valid measurements of an SNR above 1.5 for a single measurement and an SNR above 2.0 for the composite signal [20].
Patients with corneal pathology (such as corneal dystrophy or corneal opacity), media opacity other than cataracts, retinal pathology (such as age-related macular degeneration, epiretinal membrane, or diabetic retinopathy), or glaucoma were excluded because these conditions can influence macular thickness and imaging quality. Patients with refractive errors greater than +6.00 diopters (D) or smaller than −6.00 D also were excluded. OCT scans with operator-dependent artifacts, such as a decentration artifact (misidentification of the foveal center), were also excluded [21]. This study adhered to the Declaration of Helsinki, and approval for retrospective review of clinical records was obtained from the institutional review board of Korea University Guro Hospital (2015GR0730). According to the institutional review board standard operating procedures on retrospective single center clinical study, ethics committee of the Korea University Guro Hospital ruled that subject consent was not required for this study. The patient information was completely anonymized and de-identified prior to analysis.
Main outcome measures
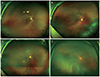
Fundus photos and macular thickness measurements were procured under the same scotopic conditions in the same examination room after pharmacologic pupil dilation using Optos Optomap and SD-OCT, respectively. Cataract severity was graded from 1 to 4 according to standard fundus photos of the Optos Optomap: grade 1, clearly visible or slightly obscured macular area; grade 2, mildly obscured macular area; grade 3, moderately obscured, but distinguishable macular area; and grade 4, severely obscured, undistinguishable macular area (Fig. 1A–1D). Cataract grading according to widefield fundus imaging was decided by a blind examiner (YE). To ensure interobserver reliability for cataract grading according to wide-field fundus imaging, all grades were determined on same fundus image by another observer (MK).
3D retinal topography & tomography mode was used as the scanning mode for OCT studies. Center, center circle, superior, temporal, inferior, nasal region, and total average macular thickness were measured using SD-OCT. Center average thickness is the average macular thickness at the fovea. Center circle average thickness is the average macular thickness of a circular area centered on the fovea with a radius of 0.5 mm. Superior, temporal, inferior, and nasal region average thickness values are the average macular thickness values of four parafoveal concentric ring zones around the central circle with an inner radius of 0.5 mm and an outer radius of 1.5 mm from the fovea. Total average thickness is the average macular thickness of the above five subfield areas. The quality of SD-OCT images was determined using SNR, with scores from 1 (lowest image quality) to 10 (highest image quality). All vertical and horizontal OCT B-scan images were evaluated to identify whether segmentation errors (such as inner boundary lines that do not correspond to the internal limiting membrane and/or outer boundary lines that do not correspond to the retinal pigment epithelium) occurred on SD-OCT [21].
Statistical analysis
Patient descriptive statistics were obtained using IBM SPSS ver. 21.0 (IBM Corp., Armonk, NY, USA). Analysis of variance and Fisher exact tests were performed to compare age, sex, and laterality among cataract grade groups. Intraclass correlation coefficients were calculated to assess the interobserver reliability of cataract grading according to wide-field fundus imaging. Pearson and Spearman correlation analyses were performed to evaluate the correlation among cataract grade based on wide-field fundus imaging, LOCS III grade, age, SD-OCT and IOLMaster SNR, and macular thickness. χ2 linear trend tests were performed to compare the percentage of eyes that could not be measured using the IOLMaster among the cataract grade groups. χ2 linear trend tests were also performed to compare the percentage of eyes with SD-OCT segmentation errors according to cataract grade and SD-OCT SNR. The Kruskal Wallis test with a Bonferroni correction post hoc analysis was performed to compare SD-OCT SNR and macular thickness among the cataract grade groups. The Mann-Whitney U-test was also performed to compare SD-OCT SNR and macular thickness according to presence of segmentation errors on SD-OCT. Results were considered statistically significant if p-value was less than 0.05.
Results
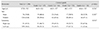
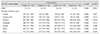
A total of 200 eyes from 200 cataract patients were included in this study. Of the 200 patients, 76 (38.0%) were men and 124 were women. The age (mean ± standard deviation) was 67.8 ± 9.5 years (range, 43 to 93 years). There were 91 right eyes (45.5%) and 109 left eyes. Of the 200 eyes, 47 (23.5%) were cataract grade 1, 64 (32.0%) were grade 2, 55 (27.5%) were grade 3, and 34 (17.0%) were grade 4 according to the standard fundus photos by Optos Optomap. There was no significant difference in mean age among the four cataract grade groups (Table 1). The intraclass correlation coefficient, calculated to evaluate interobserver reliability for cataract grading according to wide-field fundus image, was 0.918.
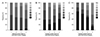
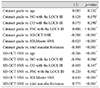
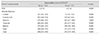
Using the LOCS III, cataract grade based on wide-field fundus imaging was positively correlated with PSC grade (rho = 0.486, p < 0.001) but not with NO or CO grade (Fig. 2A–2C). Cataract grade was negatively correlated with SD-OCT SNR (rho = −0.588, p < 0.001), IOLMaster SNR (rho = −0.625, p < 0.001), and total macular thickness (rho = −0.509, p < 0.001). The SD-OCT SNR was negatively correlated with age (r = −0.246, p < 0.001), NO (rho = −0.194, p = 0.006), and PSC grade (rho = −0.220, p < 0.002) according to the LOCS III and was positively correlated with IOLMaster SNR (rho = 0.430, p < 0.001) and total macular thickness (rho = 0.571, p < 0.001) (Table 2). The percentage of eyes that could not be measured using the IOLMaster in eyes with cataract grade 4 (26.5%) was significantly higher than that in eyes with cataract grade 1 (0.0%), 2 (1.6%), or 3 (10.9%) (all, p < 0.001).
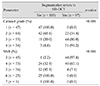
In macular SD-OCT measurements, the median SNR (interquartile range [IQR], 1 to 3) was 5 (IQR, 5 to 6) for eyes with cataract grade 1, 4 (IQR, 4 to 5) for grade 2, 4 (IQR, 3 to 4) for grade 3, and 3 (IQR, 3 to 4) for grade 4. Among all cataract grade groups, the median SNR was significantly highest in cataract grade 1 eyes. The median total macular thickness (IQR, 1 to 3) was 273 (IQR, 261 to 282) µm for eyes that were cataract grade 1, 255 (IQR, 232 to 276) µm for grade 2, 245 (IQR, 193 to 256) µm for grade 3, and 201 (IQR, 145 to 262) µm for grade 4. All macular thickness measurements performed using SD-OCT, including center, center circle, superior, temporal, inferior, nasal region, and total average macular thickness, were highest in cataract grade 1 eyes. The median SNR and total macular thickness of cataract grade 1 eyes were significantly higher than those of cataract grade 2 eyes (Table 3).
Of the 200 eyes, 97 (48.5%) had errors in automated segmentation of the retinal layer in the SD-OCT. The χ2 linear trend test showed that the percentage of eyes with segmentation errors tended to increase as cataract grade increased and SD-OCT SNR decreased (Table 4). None of the cataract grade 1 eyes had segmentation errors on SD-OCT. Conversely, 91.2% of cataract grade 4 eyes had segmentation errors. The three cataract grade 4 eyes (8.8%) without segmentation errors had dense centrally localized PSC (Fig. 3A, 3B). When eyes with and without segmentation errors on SD-OCT were compared to each other, the median SD-OCT SNR and macular thickness of eyes without segmentation errors were significantly higher than those of eyes with segmentation errors (Table 5).
Of the 97 eyes with segmentation errors on SD-OCT, 61 (62.9%) had segmentation errors only in the inner boundary line, and 36 had segmentation errors in both the inner and outer boundary lines (Fig. 4A, 4B). Among segmentation errors, most inner boundary lines were posterior to the actual internal limiting membrane, resulting in underestimation of macular thickness, and outer boundary lines were posterior to the actual retinal pigment epithelium, which resulted in overestimation of macular thickness.
Discussion
This study investigated standard photos from wide-field fundus imaging for grading cataract severity. Cataract severity was graded according to the degree of macular area obscured by cataract artifacts in wide-field fundus imaging; the larger the number of cataract artifacts that obscured the macular area in wide-field fundus images, the higher the cataract grade. In addition, this study evaluated the effect of cataract severity based on wide-field fundus imaging on macular thickness measured by SD-OCT and the SD-OCT SNR and compared that with LOCS III grade, which is a well-known system for cataract grading by slit lamp biomicroscopy [19]. The results showed that cataract grade based on wide-field fundus imaging was negatively correlated with macular thickness measured by SD-OCT and the SD-OCT SNR.
Cataract grade used in this study showed good correlation with LOCS III PSC grade. Thus, preoperative wide-field fundus images could be used to predict cataract grades, especially in patients with PSC, and SD-OCT SNR.
It is thought that the macula is thinner in eyes with higher grade cataracts due to decreased signal strength. In line with our study, previous studies have shown a positive correlation between signal strength and macular or RNFL thickness [81013]. Decreased macular thickness in eyes with lower signal strength can be explained by segmentation errors in OCT. Automated segmentation of the retinal layer in OCT can introduce error [21]. The automated segmentation error rate tends to increase as SNR decreases [1022]. In this study, the percentage of eyes with segmentation errors increased as the SD-OCT SNR decreased and cataract grade increased. In addition, macular thickness measured with SD-OCT was significantly lower in eyes with segmentation errors than in eyes without segmentation errors. All eyes with segmentation errors had errors in the inner boundary line, which tended to underestimate macular thickness. Conversely, of eyes with segmentation errors, 37.1% had segmentation errors in both the inner and outer boundary lines. Although segmentation errors in the outer boundary line tended to overestimate macular thickness, eyes with segmentation errors in the outer boundary did not overestimate macular thickness because they also had segmentations error in the inner boundary line.
Of 34 cataract grade 4 eyes, three did not have segmentation errors. Wide-field fundus imaging of these three eyes showed a dense centrally localized cataract artifact (Fig. 2A–2C) and small central dense PSC. The SD-OCT SNR of these three eyes with a small central dense PSC was 5, although SD-OCT SNR was negatively correlated with LOCS III PSC grade. Higher PSC grade was associated with higher cataract grade and lower SD-OCT SNR in this study. Among cataract types, late PSC showed the greatest reduction in visual acuity [23]. PSCs produce glare, visual disturbances, and decreased contrast sensitivity. Because PSCs involve subcapsular opacities in the central posterior cortex, most light is blocked or scattered by the PSC with ordinary pupil size, resulting in glare and reduced visual acuity. However, because measurements of the wide-field fundus imaging and SD-OCT were conducted after pharmacologic pupil dilation in this study, considerable light might not have been blocked or scattered by a small central dense PSC. This might have resulted in high SNR and no segmentation errors in the three eyes with a small central dense PSC. If the SD-OCT measurement was conducted before pupil dilation, these three eyes might have shown segmentation errors on SD-OCT. Cataract grade based on wide-field fundus imaging would be useful to assess the severity of cataracts because it reflects the degree of macular area obscured by cataracts regardless of pupil dilation.
A previous study showed that dense PSC was the main factor resulting in failed IOLMaster measurements, and that patients who could not be assessed using the IOLMaster showed higher intraoperative and postoperative complication rates than patients who could be assessed [20]. Thus, that study insisted that the unmeasured state is a risk-determining factor for cataract surgery [20]. In this study, cataract grade based on wide-field fundus imaging was mainly affected by LOCS III PSC grade and was negatively correlated with IOLMaster SNR. In addition, one-quarter of cataract grade 4 eyes could not be measured using the IOLMaster. Thus, cataract grade based on wide-field fundus imaging could be used to predict SNR and applicability of the IOLMaster.
Cystoid macular edema following cataract surgery causes macular thickening with accumulation of intraretinal fluid and is thought to be the result of inflammatory reactions caused by cataract surgery [2425]. Thus, information regarding whether macular thickness has changed after cataract surgery is important. OCT measurements have been used to evaluate changes in macular thickness after cataract surgery with or without medical treatment [262728]. The factors that affect macular thickness after cataract surgery are not only inflammatory insults due to surgery [242529], but also changes in media opacity caused by cataract removal [121330]. This study compared preoperative wide-field fundus imaging and SD-OCT to exclude the effect of postoperative inflammatory insult on macular thickness. The results showed that cataract severity, especially dense PSC, influenced SD-OCT SNR and macular thickness. Changes in SNR after cataract surgery and segmentation errors in OCT should also be considered when evaluating changes in macular thickness after cataract surgery.
This study has some limitations. First, the medical records of consecutive patients were retrospectively reviewed. Second, the laser wavelengths of Optos Optomap and SD-OCT/SLO differ. The Optos Optomap uses a 633 nm red laser and a 532 nm green laser, whereas the SD-OCT uses an infrared 840 nm wavelength. The amount of light obscured by a cataract might differ based on use of the visible or infrared region. However, there was significant correlation between cataract grade based on wide-field fundus imaging and the SD-OCT SNR.
In conclusion, this study demonstrated that cataract grade based on wide-field fundus imaging was negatively correlated with SD-OCT SNR. The underestimation of macular thickness in eyes with high-grade cataracts was due to segmentation errors on SD-OCT. Segmentation errors in SD-OCT should be considered when evaluating macular thickness in eyes with cataracts.


 XML Download