Abstract
Objective
Methods
Results
REFERENCES
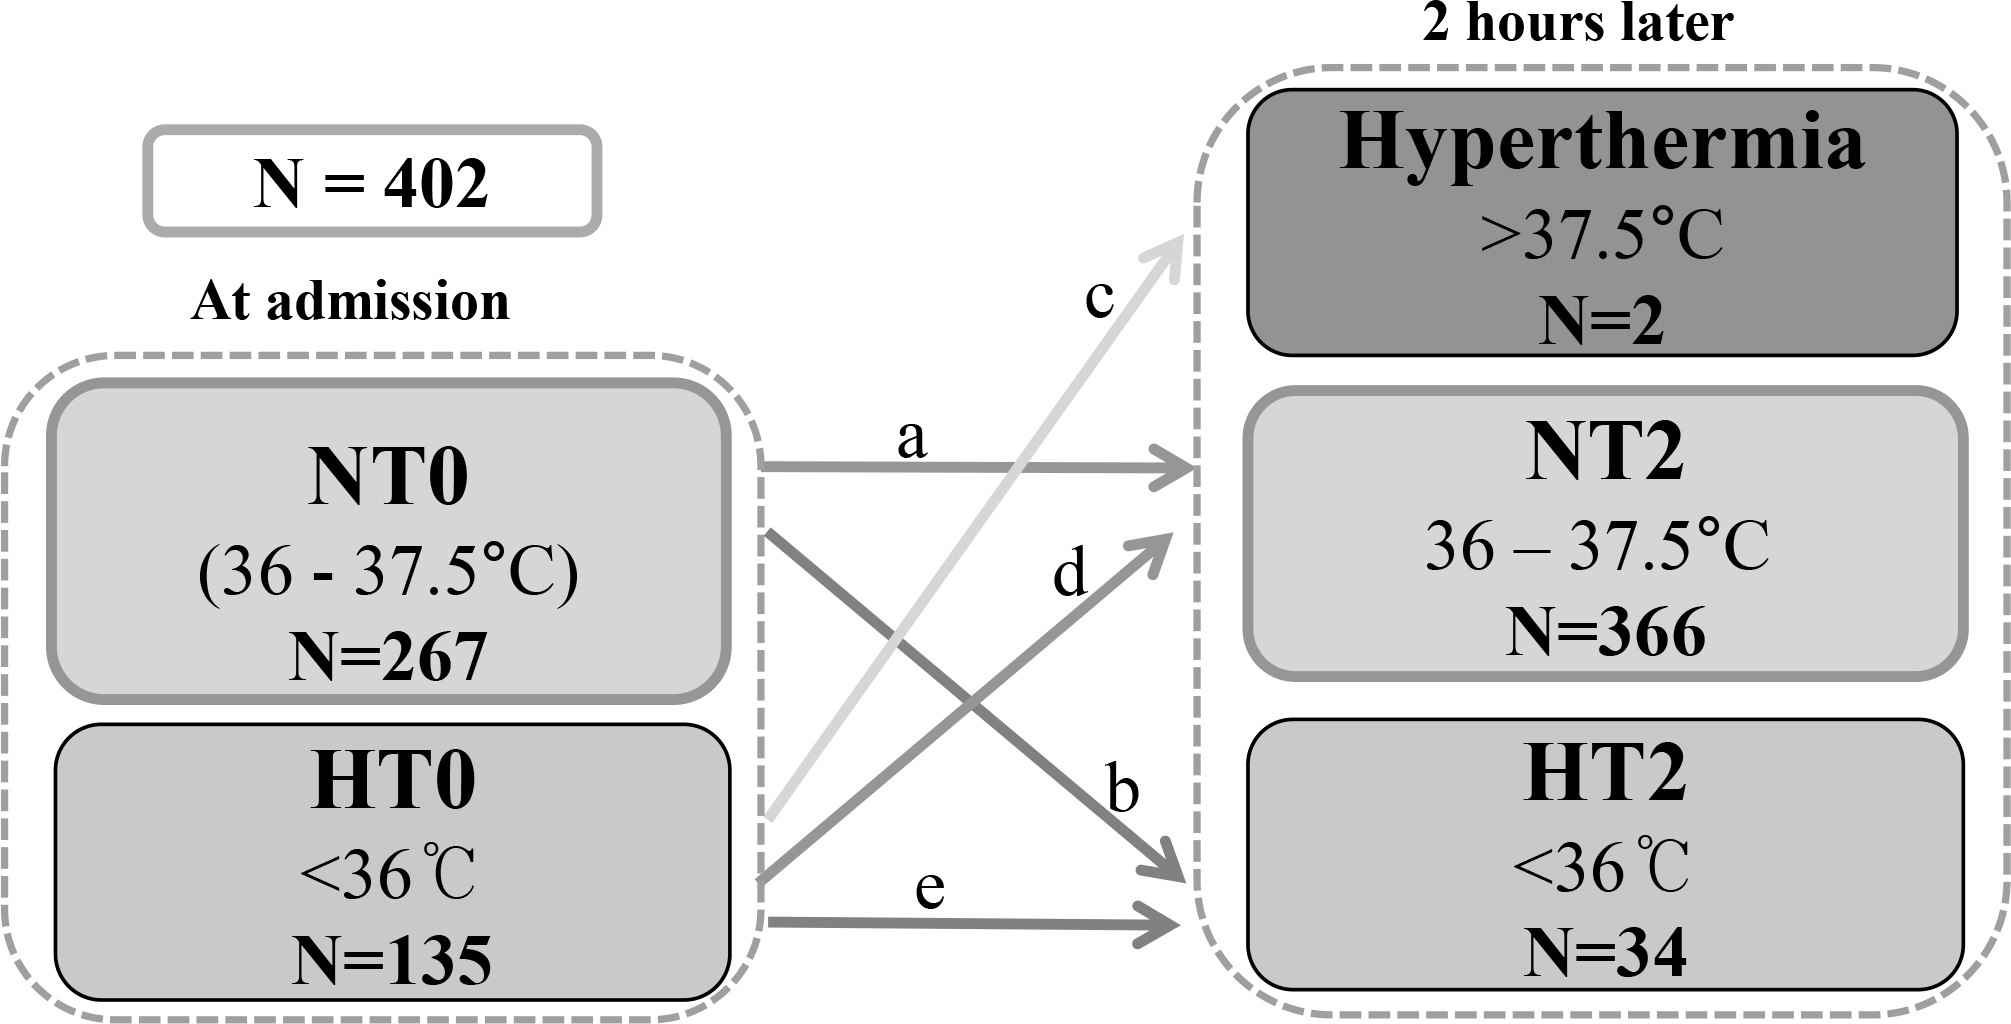
 | Fig. 1Body temperature distribution at neonatal intensive care unit (NICU) admission and 2 hours after hospitalization. NT0, normal body temperature group at NICU admission (n=267; 66.5%); HT0, hypothermia group at NICU admission (n=135; 33.5%); NT2, normal body temperature group at 2 hours in hospital (n=366; 91.1%); HT2, hypothermia group at 2 hours in hospital (n=34; 8.4%); a, continuous normal body temperature group (n=256; 63.8%); b: group whose body temperature decreased from normal (n=9; 2.2%); c, hyperthermia group at 2 hours in hospital (n=2; 0.5%); d, group whose body temperature improved to normal (n=110; 27.3%); e, continuously hypothermic group (n=25; 6.2%). |
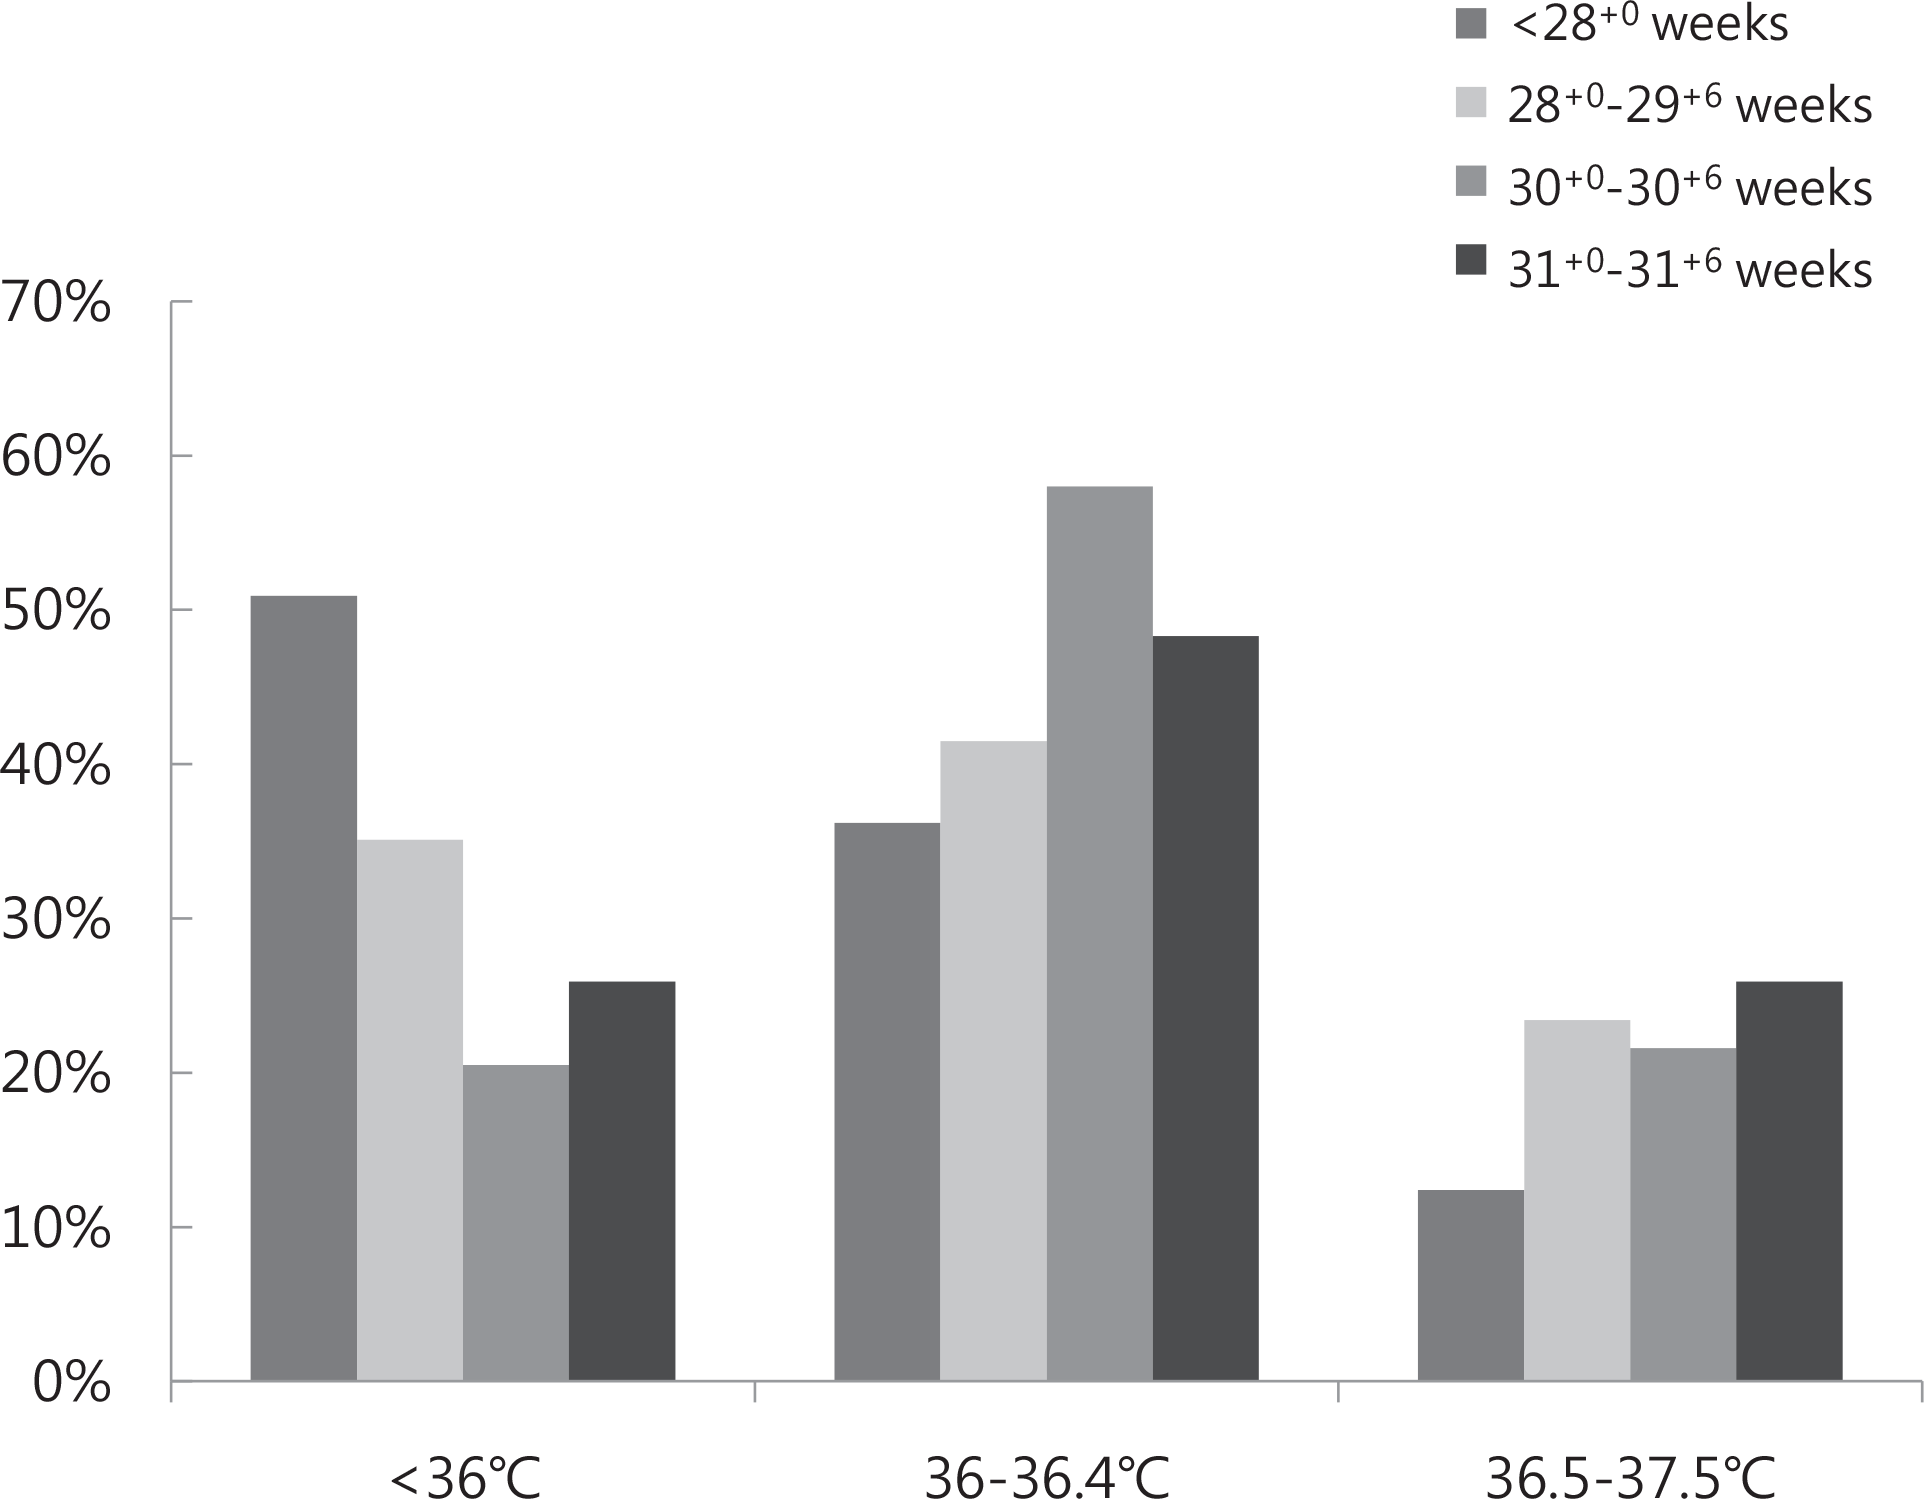
 | Fig. 2Distribution of initial temperature at neonatal intensive care unit admission according to gestational age. |
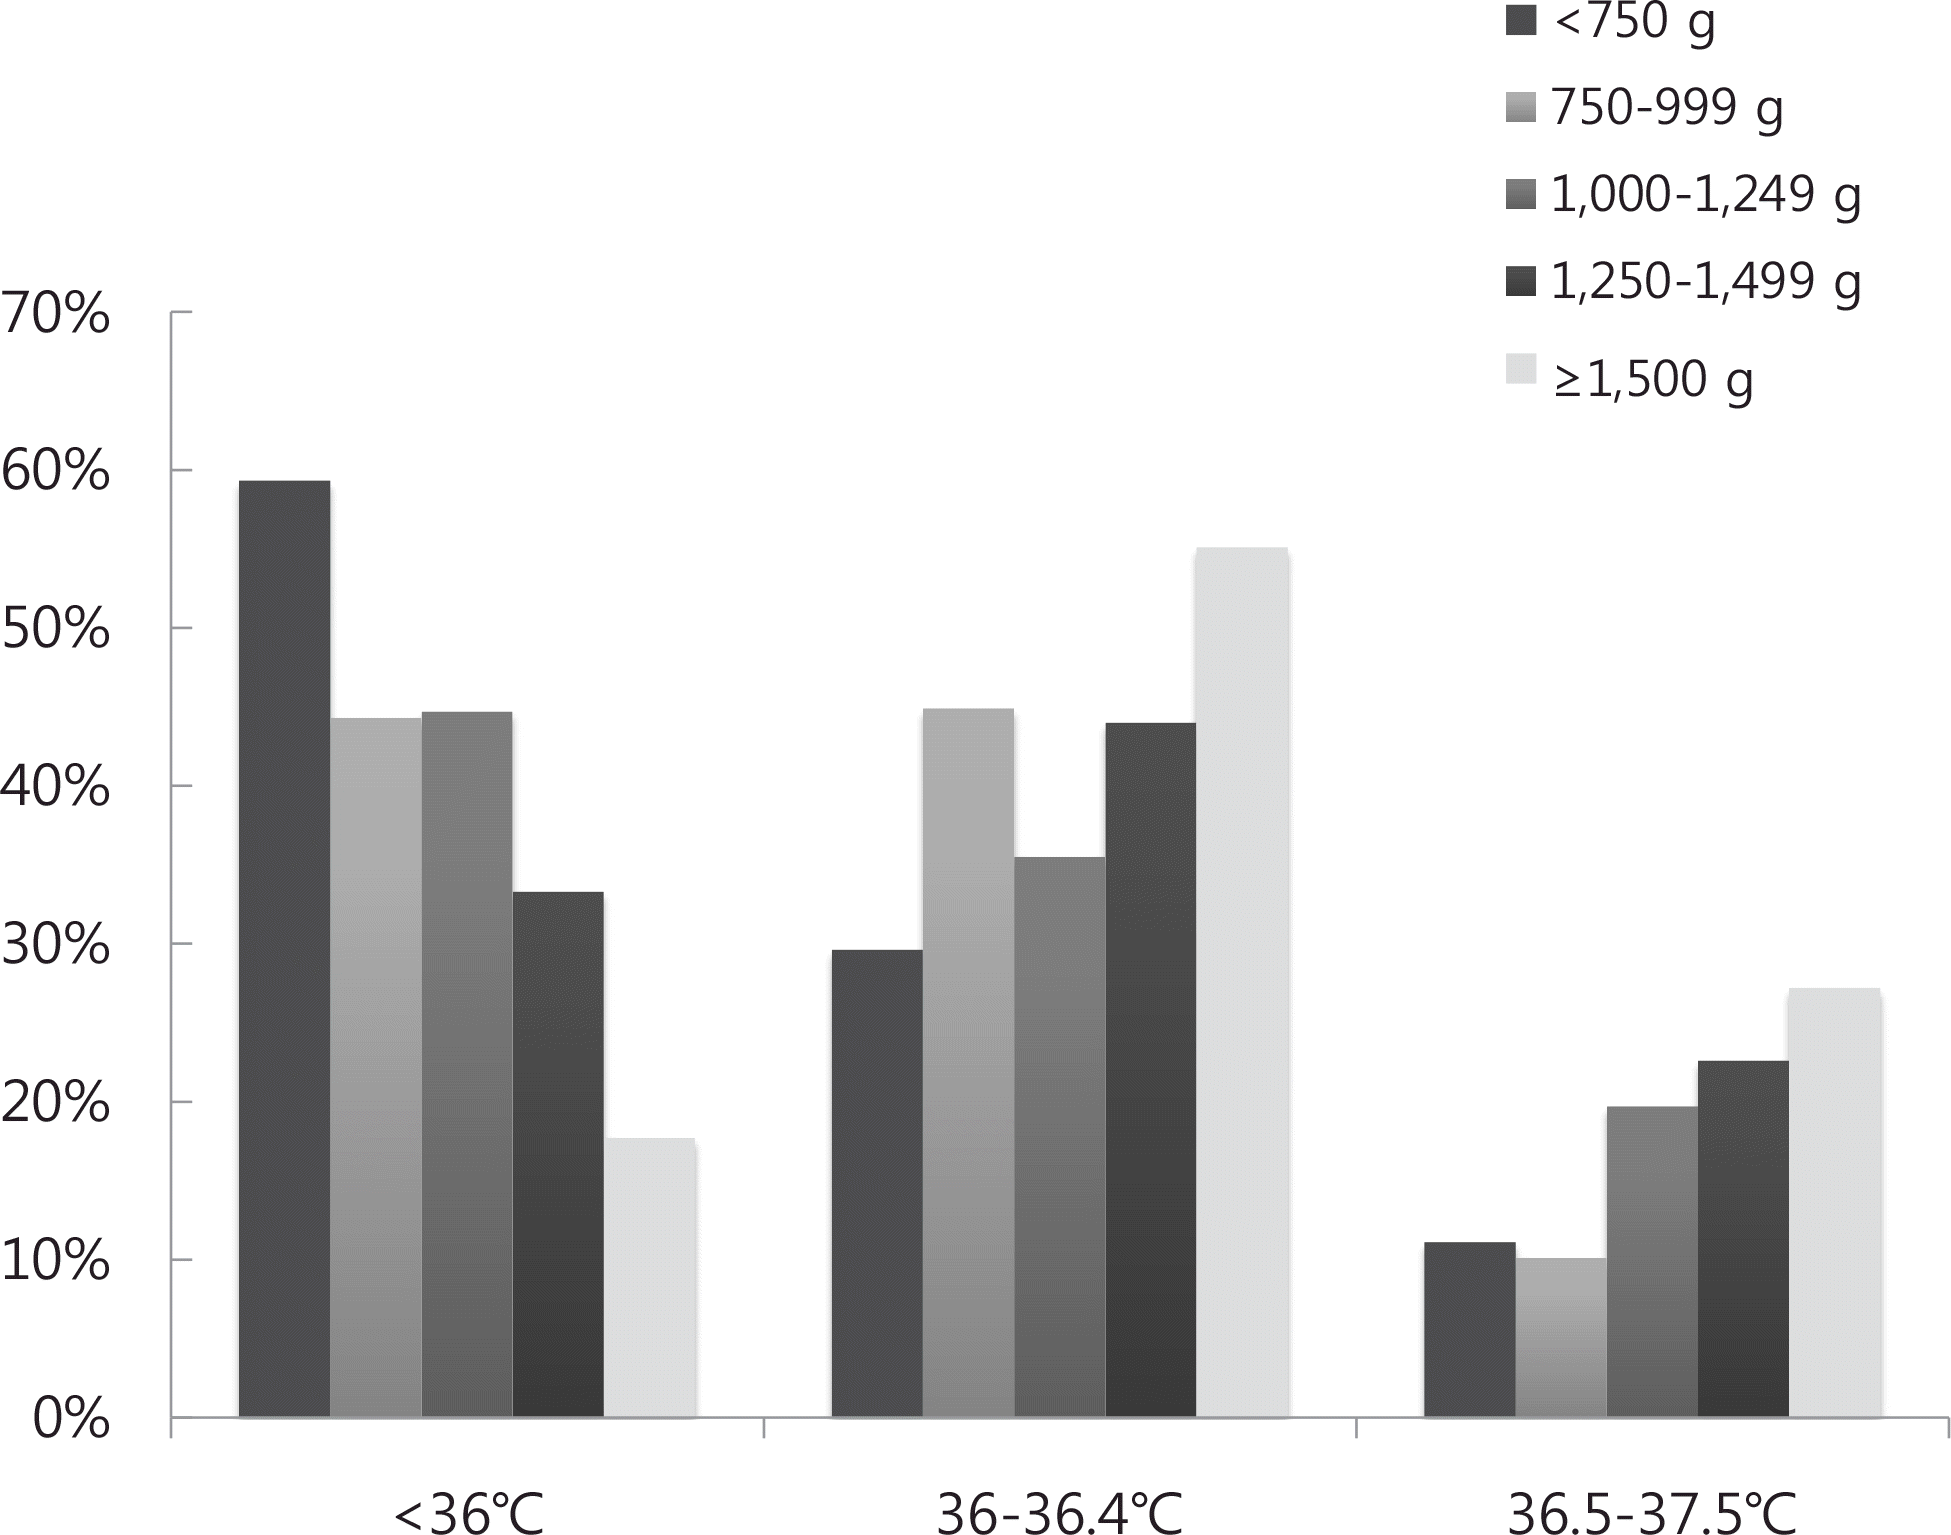
 | Fig. 3Distribution of initial temperature at neonatal intensive care unit admission according to birth weight. |
Table 1.
| HT0 group (n=135) | NT0 group (n=267) | Univariate analysis | Multivariate analysis | ||
|---|---|---|---|---|---|
| P-value | aOR (95% CI) | P-value | |||
| Initial body temperature (°C) | 35.5±0.4 | 36.4±0.3 | <0.001 | - | - |
| Gestational age (weeks) | 28+2±2+2 | 29+2±1+6 | <0.001 | 0.875 (0.735-1.041) | 0.132 |
| Birth weight (g) | 1,155±342 | 1,390±358 | <0.001 | 1.183 (1.068-1.309) | 0.001∗ |
| Male (%) | 67 (49.6) | 141 (52.6) | 0.572 | 1.210 (0.755-1.941) | 0.428 |
| Twin (%) | 47 (34.8) | 85 (31.7) | 0.532 | 1.134 (0.636-2.023) | 0.670 |
| C/S (%) | 104 (77.0) | 169 (63.1) | 0.005 | 1.539 (0.882-2.684) | 0.129 |
| IVF (%) | 41 (30.4) | 66 (24.6) | 0.218 | 1.090 (0.600-1.979) | 0.778 |
| AS <7 at 1 minute (%) | 118 (87.4) | 193 (72.3) | 0.001 | 3.421 (1.679-6.971) | 0.01 |
| AS <7 at 5 minutes (%) | 75 (55.6) | 105 (39.3) | 0.002 | 0.747 (0.425-1.313) | 0.311 |
| Resuscitation (%) | 126 (93.3) | 226 (84.3) | 0.010 | 1.354 (0.585-3.134) | 0.478 |
| Antenatal corticosteroid (%) | 75 (55.6) | 123 (46.1) | 0.072 | 1.674 (1.025-2.734) | 0.040 |
| PIH (%) | 22 (16.3) | 38 (14.2) | 0.573 | 0.869 (0.447-1.690) | 0.680 |
| GDM (%) | 18 (13.3) | 18 (6.7) | 0.028 | 2.561 (1.159-5.661) | 0.020 |
| Old mother ≥35 years (%) | 45 (33.3) | 61 (22.8) | 0.023 | 1.452 (0.857-2.458) | 0.165 |
Values are expressed as mean±standard deviation or number (%). Abbreviations: HT0 group, hypothermia group at neonatal intensive care unit admission; NT0 group, normal body temperature group at neonatal intensive care unit admission; aOR, adjusted odds ratio; CI, confidence interval; C/S, cesarean delivery; IVF, in vitro fertilization; AS, Apgar score; PIH, pregnancy induced hypertension; GDM, gestational diabetes mellitus.
Table 2.
| HT2 group (n=34) | NT2 group (n=366) | Univariate analysis | Multivariate analysis | ||
|---|---|---|---|---|---|
| P-value | aOR (95% CI) | P-value | |||
| Two hours temperature | 35.6±0.4 | 36.7±0.3 | <0.001 | - | - |
| Gestational age (wks) | 27+6±2+1 | 29+0±2+0 | <0.001 | 0.879 (0.677-1.141) | 0.347 |
| Birth weight (g) | 1,085±326 | 1,334±367 | <0.001 | 1.075 (0.913-1.265) | 0.378∗ |
| Male (%) | 19 (55.9) | 189 (51.6) | 0.625 | 1.514 (0.677-3.383) | 0.289 |
| Twin (%) | 7 (20.6) | 123 (33.6) | 0.123 | 0.433 (0.152-1.231) | 0.116 |
| C/S (%) | 28 (82.4) | 243 (66.4) | 0.054 | 2.987 (1.019-8.760) | 0.046 |
| IVF (%) | 9 (26.5) | 98 (26.8) | 0.977 | 1.182 (0.441-3.164) | 0.751 |
| AS <7 at 1 minute (%) | 32 (94.1) | 278 (76.0) | 0.014 | 3.293 (0.622-17.422) | 0.160 |
| AS <7 at 5 minutes (%) | 25 (73.5) | 154 (42.1) | <0.001 | 1.468 (0.537-4.015) | 0.431 |
| Antenatal corticosteroid (%) | 20 (60.6) | 177 (48.4) | 0.173 | 2.028 (0.904-4.548) | 0.097 |
| PIH (%) | 6 (17.6) | 53 (14.5) | 0.614 | 1.017 (0.365-2.831) | 0.988 |
| GDM (%) | 2 (5.9) | 34 (9.3) | 0.509 | 0.701 (0.139-3.531) | 0.662 |
| Old mother ≥35 years (%) | 9 (26.5) | 97 (26.5) | 0.996 | 0.643 (0.260-1.590) | 0.318 |
Values are expressed as mean±standard deviation or number (%). Abbreviations: HT0 group, hypothermia group at neonatal intensive care unit admission; NT0 group, normal body temperature group at neonatal intensive care unit admission; aOR, adjusted odds ratio; CI, confidence interval; C/S, cesarean delivery; IVF, in vitro fertilization; AS, Apgar score; PIH, pregnancy induced hypertension; GDM, gestational diabetes mellitus.
Table 3.
| E group (n=25) | D group (n=110) | Univariate analysis P-value | Multivariate analysis | ||
|---|---|---|---|---|---|
| aOR (95% CI) | P-value | ||||
| Initial body temperature | 35.4±0.5 | 35.5±0.4 | 0.205 | - | |
| Two hours Body temperatur | e 35.5±0.4 | 36.6±0.4 | <0.001 | - | |
| Gestational age (wks) | 27+5±2+2 | 28+3±2+2 | 0.086 | 1.009 (0.735-1.385) | 0.958 |
| Birth weight (g) | 1,034±331 | 1,182±340 | 0.048 | 1.089 (0.867-1.369) | 0.462∗ |
| Male (%) | 15 (60.0) | 52 (47.3) | 0.251 | 0.600 (0.225-1.600) | 0.308 |
| Twin (%) | 5 (20.0) | 42 (38.2) | 0.085 | 2.755 (0.649-11.692) | 0.169 |
| C/S (%) | 20 (80.0) | 84 (76.4) | 0.696 | 0.662 (0.185-2.370) | 0.526 |
| IVF (%) | 7 (28.0) | 34 (30.9) | 0.775 | 0.643 (0.173-2.397) | 0.511 |
| AS <7 at 1 minute (%) | 24 (96.0) | 94 (85.5) | 0.151 | 0.363 (0.320-4.074) | 0.412 |
| AS <7 at 5 minutes (%) | 18 (72.0) | 57 (51.8) | 0.067 | 0.740 (0.213-2.563) | 0.634 |
| Antenatal corticosteroid (%) | 15 (60.0) | 60 (54.5) | 0.620 | 0.699 (0.260-1.881) | 0.478 |
| PIH (%) | 4 (16.0) | 18 (16.4) | 0.703 | 1.301 (0.336-5.034) | 0.703 |
| GDM (%) | 2 (8.0) | 16 (14.5) | 0.385 | 1.454 (0.273-7.742) | 0.661 |
| Old mother ≥35 years (%) | 8 (32.0) | 37 (33.6) | 0.876 | 1.427 (0.479-4.247) | 0.523 |
Values are expressed as mean±standard deviation or number (%). Adjested by gestational age, birth weight, male, twin, C/S, IVF. AS <7 at 1 minute, AS <7 at 5 minutes, resuscitation, antenatal corticosteroid, PIH, GDM, and old mother ≥35 years. Abbreviations: E group, continuously hypothermic group; D group, body temperature improved to normal; aOR, adjusted odds ratio; CI, confidence interval; C/S, cesarean delivery; IVF, in vitro fertilization; AS, Apgar score; PIH, pregnancy induced hypertension; GDM, gestational diabetes mellitus.


 PDF
PDF ePub
ePub Citation
 Print
Print


 XML Download