

 PDF
PDF ePub
ePub Citation
 Print
Print


INTRODUCTION
Acute pancreatitis (AP) with an incidence of 50–80 per 100,000 population is a common cause of acute abdominal pain.1 Its management is influenced by etiology, severity, and local resources.23 SAP based the revised Atlanta classification4 occurs in 20% of AP cases. It has higher mortality rates than AP.56 To optimize outcomes, patients with predicted SAP should be identified early to allow prompt resuscitation, resource allocation, close monitoring, and timely interventions. For these patients, optimal prognostication allows clinicians to inform patients and caregivers on heightened possibility of critical care requirement, increased length of stay with interventions, higher hospital costs, and mortality. Hence, predictive scoring systems are essential to AP management. Many such systems exist. Ranson's score (RS) and Glasgow-Imrie (Glasgow) score (GS) have been traditionally used for severity stratification of AP.78 They have been widely validated for their prognostic utility.910111213
Despite their widespread use, both scores have been criticized for their limitations. A meta-analysis including 110 studies has reported that the predictive power of RS in clinical setting is insufficient for prognosticating new admissions.14 Another prospective study has evaluated 137 consecutive patients on admission and at 48 hours using RS, GS, and Acute Physiology and Chronic Health Evaluation (APACHE)-II score and found that none of them could achieve sufficient predictability when used alone.15
Both RS and GS scores have some limitations in clinical setting.16 Interpretation of blood glucose levels in diabetic patients, urea levels in patients with renal dysfunction, and redundancy of performing arterial blood gas analysis in a healthy patient are some of their limitations. It is not uncommon to find patients with predicted SAP clinically behaving as ‘mild’ AP. Furthermore, for patients clinically manifesting SAP, it is essential to have prompt treatment rather than waiting for 48 hours before full stratification. Both RS and GS have been criticized for their requirement of 48 hours for prediction. Many authors have reported prediction models that can provide risk stratification upon admission.1718 Lastly, multivariable scoring is cumbersome to perform in routine clinical practice. To overcome these limitations, recent guidelines advocate the implementation of organ failure (OF)-based scoring systems.45 While it is ideal to predict severity accurately upon admission, this deviates from clinical truth. Hence, experts now advocate 48 hours for OF-based scoring. Although OF-based scoring is being increasingly adopted worldwide, many units continue to use traditional scoring either exclusively or along with OF-based scores.
The search for an ideal scoring system continues. It remains our local practice to continue using traditional scoring systems along with OF-based systems. Conflicting evidence regarding the accuracy and predictive value of RS and GS brings to question their relevance to modern pancreatology. In addition, although presentation, etiology, and complications AP in a multi-ethnic population are more complex than those in other reported populations,19 few such studies exist. Therefore, the primary aim of this study was to validate RS and GS for stratifying the severity of acute pancreatitis in a local clinical setting and audit our experience of managing AP in a multi- ethnic population.
MATERIALS AND METHODS
Methodology
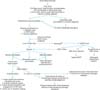
A retrospective cohort study of all patients admitted for AP in the Department of General Surgery between July 2009 and September 2016 was conducted. All patients were prognosticated with RS and GS at 48 hours. Demographic and clinical data were correlated with final severity outcome upon discharge. All patient data were reviewed retrospectively to assign severity stratification according to the revised Atlanta classification.4 Patients with insufficient data to complete any of the three scores were considered for imputation or exclusion. Imputation of variables with up to 20% missing data was done by mean substitution of missing data. Variables with >20% missing data were excluded from analysis. Electronic medical records were reviewed for demographic information, laboratory investigations, imaging, intervention history, morbidity, and mortality. Data on mortality and local complications were collected and correlated with risk scores. Tan Tock Seng Hospital's algorithm of management of AP is shown in Fig. 1. This study was approved by our Institutional Review Board.
Definitions
Diagnosis and severity stratification of AP were made in accordance with the revised Atlanta classification.4 The local laboratory did not measure amylase value in excess of 2000 units or lipase value in excess of 400 units. Hence, for these two variables, maximum value was fixed as predetermined. We have adopted Atlanta classification in clinical practice since 2013. Atlanta classification suggests the use of modified Marshall score which defines organ failure as a score of ≥2 for one of the following three systems: respiratory, cardiovascular, and renal. In our department, patients treated for AP are routinely prognosticated via Sequential Organ Failure Assessment (SOFA) score. The SOFA score is a mortality prediction tool based on six organ systems. It is widely used as mortality stratification tool in intensive care units (ICU).20 While SOFA score is not widely adopted for severity stratification or prognostication of SAP, there is evidence of its utility within ICU.21 Analysis of severity stratification using SOFA was included for comparison along with RS and GS.
Etiology of acute pancreatitis
The following aetiologies were documented: gallstones, alcohol, hypertriglyceridemia, hypercalcemia, post endoscopic retrograde cholangiopancreatography (ERCP), autoimmune, drug-induced, and idiopathic (Table 1). Gallstone-associated AP was based on identification of gallstones on any form of imaging. Alcohol-associated AP was based on the presence of a recent alcoholic binge or regular high intake. Hypertriglyceridemia-associated AP was based on the presence of hypertriglyceridemia (TG, defined as serum TG >10 mmol/L) at the time of presentation of AP. Autoimmune AP was diagnosed in accordance with the Mayo Clinic HISORt (Histology, Imaging, Serology, Other organ involvement, Response to steroid therapy, diagnostic criteria for autoimmune pancreatitis) criteria.22 Hypercalcemia was designated as the etiology if serum ionized calcium was >1.3 mmol/L. Drug-induced AP was diagnosed in the absence of the above common etiologies and in the presence of recent intake of hydrochlorothiazide, statins, non-steroidal anti-inflammatory drugs (NSAIDs), and sulfa-based medication. Idiopathic AP was diagnosed if no clear etiology was found. All patients should have at least two normal abdominal ultrasound scans or one ultrasound scan and one magnetic resonance cholangiopancreatography (MRCP) scan prior to excluding gallstone etiology. All patients were offered endoscopic ultrasound (EUS) prior to concluding idiopathic pancreatitis. All patients with idiopathic pancreatitis were offered laparoscopic cholecystectomy.
Ranson's score (RS)
First published in 1974,7 RS was based on 11 parameters. It requires 48 hours to complete scoring. SAP is considered when patients have a cumulative score of ≥3.
Glasgow score (GS)
GS was initially described by Blamey et al.8 in 1984 for severity prognostication of AP. It is scored at 48 hours post-admission. SAP is considered when patients have a score of ≥3.
Comorbidities
In this study comorbidities included hypertension, type 2 diabetes mellitus (T2DM), hyperlipidemia, ischemic heart disease (IHD), cerebrovascular disease, renal impairment, chronic obstructive pulmonary disease (COPD), and asthma (Table 1). Hypertension was diagnosed based on the eighth Joint National Committee (JNC8) guidelines. T2DM was diagnosed based on measured random serum glucose of ≥11.1 mmol/L or a fasting glucose level of ≥6.0 mmol/L with symptoms of diabetes mellitus and its complications. Hyperlipidemia was diagnosed based on National Cholesterol Education Program (NCEP) guidelines. History of smoking was defined as any personal history of tobacco use or dependence. History of alcohol consumption was regarded as any history of regular alcohol consumption.
Length of stay and mortality
Length of stay (LOS) was defined as the duration in days between the time of admission and the time of discharge. Mortality was defined as death occurring within the same hospital admission.
Statistical analysis
All statistical analyses were conducted via SPSS version 23 (Armonk NY: IBM Corp). Categorical variables are expressed as absolute numbers and proportions. Variance within categorical variables was analysed using chi-square test while continuous variables were analysed using Student's t-test. Multivariate analysis was conducted using logistic regression analysis. Statistical significance was considered at p<0.05. Sensitivity, specificity, positive predictive value (PPV), and negative predictive value (NPV), positive and negative likelihood ratios (LR+ and LR−, respectively), diagnostic odds ratio, and overall accuracy were calculated for both RS and GS (with ≥3 for either score as the cutoff for SAP). Receiver-operating characteristic (ROC) curves for the prediction of SAP were calculated for both scoring systems. The predictive accuracy of RS or GS was measured by the area under the receiver-operative curve (AUC). Pairwise AUC comparisons were performed between ROC curves for RS and GS via the nonparametric approach developed by DeLong et al.23 AUC ranged from 0.5 to 1.0. For prediction models, AUC values of <0.6, 0.6 to 0.8, 0.8 to 0.9, and >0.9 indicated poor, moderate, good, and excellent discriminatory ability, respectively.24
RESULTS
Demographic and clinical profile
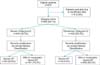
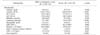
A total of 675 patients with a diagnosis of AP were admitted to Department of General Surgery. Six patients with insufficient data for either scoring system (RS or GS) were excluded. Figs. 2 and 3 reflect patient distribution according to RS and GS, respectively. Of variables studied, C-reactive protein (CRP), prothrombin time (PT), partial thromboplastin time (aPTT), and arterial partial pressure of O2 (PaO2) had over 20% data missing. Thus, they were excluded from analysis. For 12 variables (alanine transaminase [AST], lactate dehydrogenase [LDH], serum amylase, hemoglobin, total white (blood cell) count [TWC], platelet count, albumin, serum total bilirubin, urea, creatinine, alanine transaminase [ALT], and corrected serum calcium), missing data occurred for less than 20% of the sample. Thus, missing values were substituted with mean values. Average age of the 669 patients was 58.7±17.4 years (range, 21–98 years). There was a male preponderance (n=393, 53.8%). Their demographic characteristics are summarized in Table 1.
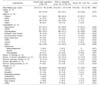
The three most common comorbidities were hypertension (n=347, 51.9%), hyperlipidemia (n=243, 36.3%), and T2DM (n=211, 31.5%). Seventy-six (11.4%) patients had previous history of pancreatic disease, including 30 (4.5%) with history of chronic pancreatitis. A total of 126 (18.8%) patients had smoking history while 163 (24.3%) patients consumed alcohol. The three most common etiologies of AP were gallstone disease (n=460, 68.8%), alcohol consumption (n=39, 5.8%), and hypertriglyceridemia (n=19, 2.8%). Hypertension (49.6% vs. 65.3%, p=0.044) and IHD (11.1% vs. 22.0%, p=0.012) were found to be significantly more prevalent in patients with SAP. History of smoking was more common in patients with mild-to-moderate AP (20.2% vs. 8.5%, p=0.041) (Table 1). On multivariate analysis, only IHD had significant association with severity (p=0.014).
Results of comparison for baseline biochemistry investigations done at admission are shown in Table 2. Of parameters assessed at initial presentation, univariate analysis using Student's t-test identified five variables with significant differences between the non-severe and severe AP groups: serum amylase (mean±SD: 1151.1±753.5 vs. 1484.6±736.5, p<0.001), TWC (13.7±12.5 vs. 17.0±6.4, p=0.017), urea (5.4±6.9 vs. 9.1±8.0, p<0.001), creatinine (97.0±91.5 vs. 154.2±129.7, p<0.001), and LDH (729.8±455.9 vs. 936.7±530.0, p=0.002).
Morbidity and outcomes
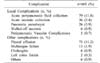
Of patients studied, 160 (23.9%) had imaging findings consistent with local complications, most commonly acute peripancreatic fluid collection (n=79, 11.8%) and acute necrotic collection (n=36, 5.4%). Eighty-seven (13.0%) patients developed other complications, most commonly pleural effusion (n=75, 11.2%) (Table 3).
Mean LOS was 6.8±8.7 days (range, 2–92 days). Ninety-four (14.1%) and 20 (3.0%) patients required admission to high dependency ward (HDU) and ICU, respectively. The most common surgical intervention was cholecystectomy (n=188, 28.1%), followed by percutaneous retroperitoneal drainage (n=10, 1.5%) and necrosectomy (n=7, 1.0%). Ninety-six (14.3%) patients underwent ERCP with stent insertion. Thirteen (1.9%) patients required endoscopic ultrasonography for diagnostic evaluation. The overall incidence of local complications was 23.9% (n=160). Twelve (1.8%) patients died in the hospital.
Patients with severe acute pancreatitis
Eighty-two (12.3%) patients eventually developed SAP. Mean age of patients with SAP was higher than those with mild-moderate AP (63.9±20.1 years vs. 57.9±16.9 years, p=0.003). The most common aetiology for AP was gallstone (n=61, 74.4%). Gender, ethnicity, and the three most common comorbidities were comparable between the two groups (SAP and mild-to-moderate AP). Incidence of previous pancreatic disease (n=9, 11.0%) and chronic pancreatitis (n=1, 1.2%) in overall distribution was similar to each other (p=0.097). SAP group had higher complications (54.9% vs. 19.6%, p<0.001) and mortality (14.6% vs. nil, p<0.001) compared to the non-severe group.
Score evaluation
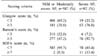
Distribution of RS, GS, and SOFA score is summarized in Table 4. Diagnostic outcomes stratified by initial scoring of both tests are shown in Table 5. RS demonstrated a sensitivity of 92.7%, a specificity of 52.8%, a PPV of 21.5%, and an NPV of 98.1%. Positive and negative likelihood ratios (LR+ and LR−) were 1.964 and 0.139, respectively. Diagnostic odds ratio of RS was 14.18 and its overall accuracy was 57.7%. GS demonstrated a sensitivity of 76.8%, a specificity of 69.2%, a PPV of 25.8%, and an NPV of 95.5%. LR+ and LR− were 2.492 and 0.335, respectively, corresponding to a diagnostic odds ratio of 7.44. The overall accuracy of GS was 70.1%.
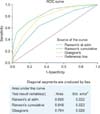
ROC curves for RS and GS are shown in Fig. 4. AUCs for RS and GS were 0.848 (95% CI: 0.819–0.875) and 0.784 (95% CI: 0.750–0.814), respectively, for SAP prediction (p<0.001). Pairwise comparison of ROC curves of GS and RS revealed that AUC of RS was significantly greater than that of GS (p=0.003).
DISCUSSION
Our study demonstrates that both RS and GS are effective in severity stratification at 48 hours. However, RS has superior diagnostic odds ratio and higher area under the curve for predicting severity of AP than GS in multiethnic Asian population with predominant gallstone aetiology.
Age was found to be significantly higher in the SAP group than that in the mild-to-moderate AP group in our study. The old age of our patients reflects local demography of 30% local population being ≥55 years.25 Ethnicity and distribution of comorbidities within the study population were congruent with those of the local population.26 Gallstone was a predominant aetiology, similar to findings of other studies.8927 However, Westerners have higher incidence of alcoholic pancreatitis.1015 This is likely due to lower alcohol consumption rate in our patients compared to Westerners. Incidence of SAP (12.3%) in this study was lower than 20–25% estimated by Beger and Rau,5 but comparable to results of more recent studies.1227 This might be due to changing definitions of SAP with the revised Atlanta classification.4 On univariate analysis, biochemical profiles of SAP patients revealed significant differences in serum amylase, TWC, urea, creatinine, and LDH compared to those of mild-to-moderate AP patients. These biochemical associations have been well-documented in previous studies, showing that increased TWC,3 serum urea,2829 creatinine,303132 and LDH3334 are associated with AP severity. Studies have also documented low serum albumin levels in patients with SAP.835 However, this was not evident in our study.
One key finding of this study was the high NPV of both scores (i.e., patients who were predicted not to have SAP truly did not have SAP). While the ideal NPV is 100%, these values remain consistent with other studies, highlighting the scores' utility in ruling out SAP.102736 Results from our study are consistent with other reports showing that RS has a higher sensitivity but a lower specificity than GS for SAP prediction.101415 This highlights the primacy of the treating physician's judgment and wisdom in deciding disposition and initial management regardless of scoring.
RS and GS have other inherent limitations. Both scores' low PPV raises a high alert level in many patients who eventually have mild AP, imposing an unnecessary resource burden and anxiety to patients. Chauhan and Forsmark16 have commented that using the revised Atlanta classification reduces the broad spectrum of AP severity to a binary result for the purpose of analysis. However, it fails to realistically capture the full spectrum of the condition. Nonetheless, our study demonstrates high AUC of both scores, emphasizing their suitability as a basic risk-stratification tool.
RS and GS have been compared to other prognostic indices in several studies. Comparative risk prediction tools include the APACHE-II score, Bedside Index of Severe Acute Pancreatitis (BISAP) score, and Harmless Acute Pancreatitis score (HAPS). Robert et al.15 have compared RS and GS scores to APACHE II and CRP and found that APACHE II is superior to RS on admission (p=0.049). This persisted throughout the subsequent five days,15 highlighting the limited prognostic value of RS before 48 hours. In a study on 185 patients with mean age of 57.1 years with 51% male population, Papachristou et al.9 have shown that RS has the highest AUC (94%) for predicting SAP compared to APACHE II score, BISAP score, and Computerised Tomography Severity Index (CTSI). In their study, the incidence of SAP (22% vs 12.3%) and mortality in SAP (17.6% vs 14.5%) were higher compared to our results. A study involving 161 patients with mean age of 62.3 years including 63% males by Cho et al.27 has reported that APACHE-II has higher AUC than RS, BISAP, CRP at 24 hours and CTSI. However, there was no significant difference. In addition, NPV of RS (95.3%) was on par with APACHE-II (95.8%). Their study involved 22% alcoholic and 21% idiopathic pancreatitis aetiologies. This is different from our experience. However, their incidence of SAP (13%) is comparable to ours. Both Papachristou et al.9 and Cho et al.27 have concluded that novel and unique models are needed to further improve the prognostic accuracy in SAP. Recently, many authors have evaluated the role of indices based on acute phase proteins and simple laboratory indices such as neutrophil to lymphocyte ratio (NLR) as predictive tools in SAP. A study including 328 patients with AP of mean age 47.5 years by Han et al.37 has reported that a combination of NLR and fluid sequestration has predictive abilities similar to RS. However, in that study, RS had higher AUC (82.4%) compared to NLR and fluid sequestration measured on days 0, 1, and 2. A study including 169 patients with mean age 54.3 years and 58% males by Yue et al.38 has reported that prealbumin/fibrinogen ratio score has higher AUC than RS (92.3% vs. 86%).38 These results need to be validated prospectively and in other units. A Spanish study by Valverde-López et al.39 including 269 patients with mean age 64.6 years and 50% males has reported that BISAP outperforms RS. However, AUCs for RS in predicting severity (85%) and mortality (94%) were high.39 Their study emphasized the role of BUN at 48 hours and serum lactate as simple biomarkers for severity prediction.
These findings prompt several questions. Firstly, given all scores possess a margin of error, should they be considered relevant given that ultimately clinical judgment triumphs all? Secondly, given traditional scoring systems have sufficient prognostic accuracy, is there a need to develop novel and unique indices? Thirdly, is there a need to continue investing efforts to develop an ‘upon-admission scoring system’ for severity or is the 48-hour time-frame essential for accurate severity prediction?
Regarding the first question, while these criteria cannot replace clinical judgment, they have value in providing objective stratification in doubtful cases, providing means for standardized reporting and auditing, and providing a platform for patient communication and future research.
For the second question, while novel indices such as BISAP, HAPS, and APACHE-II allow prognostication at admission, we believe scores at admission contradict the underlying pathophysiology of AP as a disease in evolution that requires daily review for severity reassessment. Severity is thus a ‘continuous phenomenon’ rather than a ‘time-point’. Many studies have suggested that the 48-hour time frame is essential to accurately predict severity.1345373839 Further, the quality of clinical care and treatment response contribute to clinical outcomes. One may thus consider the 48-hour requirement to complete RS as an inherent strength, which we have failed to acknowledge since the original report published by Ranson J H et al. in 1974. Recommendations by the recent Atlanta symposium similarly endorse the 48-hour timeframe for severity stratification, highlighting the importance of prognosticating AP accurately rather than prematurely.
For the third question, one must differentiate whether the system is designed for binary prediction (i.e., mild versus severe) or multiple stages of disease severity. For the latter, the 48-hour window seems essential. For the former, it is possible that composite scoring systems which incorporate ‘scoring on admission’ with ‘physician-determined severity’ should enable accurate and reliable severity prediction. Without the subjective component of ‘physician determined severity’, an adequately powered study to develop an objective severity stratification score is not feasible as the overarching aim in care of patients with SAP is to improve outcomes (i.e., reduce mortality). Merely predicting severity is only half of the process. Assuming a 15% rate of SAP, mortality of SAP of 15% and a dropout rate of 10%, approximately 5,000 patients with AP needs to be enrolled in a prospective trial to demonstrate mortality reduction to 10% with 80% power and two-tailed alpha of 5%.
Our study has several limitations. First, patients treated for AP under non-surgical departments were excluded. This might explain the paucity of post-ERCP AP patients. Second, this study did not account for certain laboratory limitations. In particular, for serum amylase, our laboratory cannot quantify beyond 2000 IU/L. Despite this, serum amylase was still significantly greater in the SAP group compared to that in the mild-moderate severe group, rendering this limitation negligible. Further, serum amylase is elevated in a myriad of other pathologies and its magnitude of rise is neither associated with severity nor predictive of mortality.40 Third, gallstone-associated AP appeared to be underreported here, with local incidence falling short of the reported 80% prevalence in other studies.1941 This might be due to inconsistencies in radiologic reporting and approximately 6% (n=41) patients in our study had no established aetiology. However, the overall distribution of gallstone etiology in our study remained congruent with that reported in other studies. Lastly, this was a single center retrospective study with missing data requiring imputation and exclusion (non-reporting) of certain important variables (e.g., C-reactive protein). We believe these limitations are in part compensated by large sample and computerized data recording system.
In conclusion, in the prediction of SAP, RS and GS have high NPV. RS has a higher AUC than GS. The 48-hour required for risk stratification by traditional scoring systems is their inherent strength rather than weakness. It is very plausible that scientific endeavors to investigate novel and unique scoring systems will have limited ability to improve outcomes of SAP with clinical impact. We foresee that the use of traditional scoring systems is a reasonable alternative to generic OF-based scoring systems. Further studies comparing the utility of both scores with organ failure-based systems are needed before traditional scoring systems are considered outdated and obsolete. Future effort needs to be invested in collaborative multicenter prospective studies aiming to identify simple bed side and/or biochemical variables routinely done as part of clinical care.


 XML Download