

 PDF
PDF ePub
ePub Citation
 Print
Print


INTRODUCTION
Colorectal cancer (CRC) is the third most commonly diagnosed cancer worldwide. The cause of CRC is not clear. However, it is regarded as a multifactorial disease affected by diverse factors such as aging, diet, obesity, smoking, drinking, and gene mutations [1]. Therefore, the best method of preventing CRC is to live a well-regulated life and have regular screening tests for the detection of polyps before they become cancerous. To screen for CRC, stool test, sigmoidoscopy, and colonoscopy are widely used, and these are considered gold standards for the detection of CRC. In addition, several blood biomarkers of CRC have been reported to improve diagnostic accuracy, and identifying CRC derivatives such as circulating tumor DNA and exosomes by liquid biopsy has been a focus of research in recent years [2].
In general, cancer immunity is considered a combination of the local immune response in the tumor microenvironment and the systemic immune response in circulating peripheral blood [3]. Most studies on cancer immunity have examined tumor microenvironments alone because of uncertainty about whether or not peripheral blood immunity is correlated with tumor progression [4]. However, studying the tumor microenvironment as the source of cancer immunity has some limitations because it is neither easily accessible nor available in all patients and healthy people [5]. This technical limitation might have hampered the development of reliable immunodiagnostic tests for cancer, whereas tests for other immune disorders such as allergy, autoimmune disease, and rejection of organ transplantation are more readily available.
In this respect, peripheral blood immune cells can provide real-time accessibility and offer an alternative window on cancer immunity. However, peripheral immunity has long been regarded as a minor part of the immune system, because it is not clear whether local cancer immunity always correlate with systemic immunity [35].
Despite this uncertainty, considerable information on cancer immunity has been gained by studying tumor microenvironments in parallel with peripheral blood. Peripheral blood is rich in various immune cells and soluble molecules that generate a systemic immune response, and valuable information from studying the peripheral blood remains to be discovered [6].
In this study, we identified cancer-related blood immune cells and associated molecules, and then estimated the likelihood of developing immunodiagnostics for determining cancer prognosis. We believe that our data shows that analyses of the peripheral blood immune system are valuable not only for cancer diagnosis and prognosis but also for personalized cancer immunotherapy.
METHODS
Subjects
Peripheral blood from 131 preoperative patients with CRC and 174 healthy individuals was drawn for this study. All participants, before providing blood, were administered a questionnaire to confirm their condition and health history. Those who did not meet our criterion of a healthy state were excluded. Exclusion criteria included chronic inflammation, autoimmune disease, allergy, severe anemia, hypertension, and hypercholesterolemia. Former cancer patients and pregnant women were also excluded. This study was performed with the approval of the Institutional Review Board of Seoul Song Do Colorectal Hospital (approval number: 2016-003) and registered in the Clinical Research Information Service (KCT0002469).
Study design
As not much is known about the peripheral blood cancer immunity, we assumed that there exist certain cancer-related immune compartments in the blood stream equivalent to tumor microenvironment, thereby selecting potential targets as follows: (1) list of the tumor-infiltrating lymphocyte subsets and immune checkpoint (ICP) molecules well described in tumor microenvironment, (2) selection of potential diagnostic markers among them according to priority of clinical relevance in terms of usefulness for evaluation of prognosis, survival, and treatment of cancer, (3) technical classification of testing targets into 7 categories for flow cytometric analysis: natural killer (NK) cells, helper T cells, myeloid-derived suppressor cells (MDSCs), regulatory T cells (Tregs), cytotoxic T cells (CTLs), ICPs, and gamma-delta T cells (GDTs).
Fluorochrome-conjugated antibodies
All antibodies used in this study were tagged with 4-color fluorochromes for detection by FL1, FL2, FL3, and FL4. For each cells type, the following antibodies were used: For NK cells, anti-CD3-fluorescein isothiocyanate (FITC; 1:100; cat. no. 555339; lot no. 6125658), anti-CD56-phycoerythrin (PE; 1:20; cat. no. 555516; lot no. 6054620), anti-CD314 (NKG2D)-PE–Cy7 (1:20; cat. no. 555348; lot no. 6140911), and anti-CD158b (KIR2DL3)-Allophycocyanin (APC; 1:100; cat. no. 312612; lot no. B210467; BioLegend); for helper T cells, anti-CD183 (CXCR3)-Alexa Fluor488 (1:100; cat. no. 558047; lot no. 6155849), anti-CD194 (CCR4)-PE (1:100; cat. no. 551120; lot no. 5107877), anti-CD4-PE–Cy5 (1:100; cat. no. 555348; lot no. 5037589), and anti-CD196 (CCR6)-APC (1:200; cat. no. 560619; lot no. 5135834); for MDSCs, anti-CD3-FITC (1:100; cat. no. 555339; lot no. 6125658), anti-CD19-FITC (1:100; cat. no. 555412; lot no. 5097663), anti-CD56-PE (1:20; cat. no. 555516; lot no. 6054620), anti-CD11b-PE (1:500; cat. no. 555388; lot. no. 4314750), anti-HLA–DR-PE–Cy5 (1:20; cat. no. 555813; lot no. 6132725 ), and anti-CD33-APC (1:500; cat. no. 551378; lot. no. 4288542); for Tregs, anti-CD4-FITC (1:100; cat. no. 555346; lot no. 5097644 ), anti-CD25-PE (1:20; cat. no. 555432; lot no. 6040885), anti-CD152 (CTLA–4)-PE–Cy7 (1:20; cat. no. 555854; lot no. 5142830), and anti-CD279 (PD–1)-APC (1:20; cat. no. 558694; lot no. 6154800); for CTLs, anti-CD3-FITC (1:100; cat. no. 555339; lot no. 6125658), anti-CD8-PE (1:100; cat. no. 555635; lot no. 4364551), anti-CD152 (CTLA–4)-PE–Cy7 (1:20; cat. no. 555854; lot no. 5142830), and anti-CD279 (PD–1)-APC (1:20; cat. no. 558694; lot no. 6154800); for ICP, anti-CD3-FITC (1:100; cat. no. 555339; lot no. 6125658), anti-CD366 (TIM-3)-PE (1:500; cat. no. 563422; lot. no. 5082811), anti-CD272 (BTLA)-PerCP (1:50; cat. no. FAB3354C; lot no. ABCC212071; R&D Systems, Minneapolis, MN, USA), and anti-CD223 (LAG–3)-APC (1:20; cat. no. FAB23193A; lot no. ADXM0116041; R&D Systems); for GDT, anti-CD3-FITC (1:100; cat. no. 555339; lot no. 6125658), and anti-γδ TCR-PE (1:50; cat. no. 555717; lot no. 5267944). All antibodies were obtained from BD Biosciences (Franklin Lakes, NJ, USA), with the exception of those companies noted in parentheses. The cell staining volume of the antibody mixture per test was fixed at 10 µL, and the antibody dilution was calculated relative to 50 µL of blood. For instance, 0.5 µL of anti-CD3 antibody, 2.5 µL of anti-CD56 antibody, 2.5 µL of anti-CD314 antibody, and 0.5 µL of anti-CD158b antibody were mixed with 4 µL of phosphate buffered-saline (PBS) in the single tube for the NK cell analysis, because all target antigens were surface bound. For surface staining, 0.5 µL of anti-CD4 antibody, 2.5 µL of anti-CD25 antibody, and 2.5 µL of anti-CD279 antibody were mixed with 4.5 µL of PBS in one tube, and, for intracellular staining of Tregs, 2.5 µL of anti-CD152 antibody was mixed with 7.5 µL of PBS in another tube.
Flow cytometry
For the analysis of NK cells, helper T cells, MDSCs, and GDTs, all test antigens were surface bound and directly stained with each antibody as described below: 50 µL of blood was distributed into 12 × 75-mm polypropylene round-bottom test tubes, stained with premixed mouse anti-human antibodies, and incubated for 15 min at room temperature (RT) in the dark. Then, red blood cells were lysed by adding 450 µL of FACS lysing solution (BD Biosciences) to each test tube for 15 minutes at RT in the dark. Cells were washed two times in 2 mL of PBS by centrifugation at 250 × g for 5 minutes at RT and resuspended in 200 µL of PBS. Another intracellular staining step was required for analysis of Tregs, CTLs, and ICP molecules. After the lysis of red blood cells, remaining cells were washed in 2 mL of permeabilization buffer composed of 0.1% saponin (Cat No. S7900, Sigma-Aldrich, Merck KGaA, Darmstadt, Germany) in PBS and then resuspended in 200 µL of PBS. Intracellular target antigens were as follows: CD152, CD366, CD272, and CD223. After staining was completed, cells were analyzed by flow cytometry (FACSCalibur; BD Biosciences). Data were analyzed using CellQuest Pro software version 6.0 (BD Biosciences) and are presented as percentages. Lymphocyte subsets were enumerated using the double platform method to obtain absolute counts from the lymphocyte differentials using an automatic hematology analyzer (Sysmex Corp., Kobe, Japan).
Quality control
Blood samples were collected between 8:00 and 10:00 AM and processed within 2 hours. Fifty microliters of blood was reverse pipetted into the staining tube. Before the study, all antibodies were titered to optimize the test volume by 2-fold serial dilution, and the optimal titer was determined by calculating the stain index. Gating and quadrant location of markers in the dot plot analysis were determined using fluorescence minus one controls. Daily calibration of the flow cytometer was performed using the manufacturer's software (FACSComp software, BD Biosciences) and materials (calibrated beads, BD Biosciences).
Statistics
Age- and sex-adjusted covariance testing was used for analyzing the differences between patients and healthy controls, and the Student t-test was used for other data. Data analyses were processed using the IBM SPSS ver. 18.0 (IBM Co., Armonk, NY, USA). The receiver operating characteristic (ROC) curve, sensitivity, and specificity were calculated using SigmaPlot 10.0 (Systat Software, Inc., San Jose, CA, USA). Data were considered statistically significant when the P-value was less than 0.05.
RESULTS
Clinical characteristics
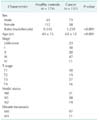
One hundred thirty-one patients (73 males and 58 females) with CRC and 174 healthy controls (61 males and 112 females) were classified by sex and age. There were age (63 ± 12 years vs. 43 ± 13 years, P < 0.001) and sex ratio (1.259 [male] vs. 0.545 [female], P < 0.001) differences between patients and healthy controls. The patients were further classified using the TNM staging system (Table 1).
Immunophenotypic characterization of cancer-related peripheral blood immune cells
WBCs, neutrophils, and lymphocyte subtypes
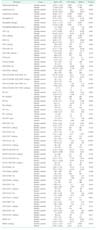
Peripheral blood immune cells of patients were analyzed and described in percentages and counts relative to those of healthy controls (Table 2). Because of age and sex differences between the 2 groups, age- and sex-adjusted mean values were compared. We found that there were significant differences in several immune cell subtypes between patients and healthy controls. Absolute counts of white blood cells (WBCs) and percentages and counts of neutrophils were higher in patients than in healthy controls (P < 0.005). In contrast, percentages of lymphocytes were lower in patients than in healthy controls (P = 0.005). Thus, the neutrophil-to-lymphocyte ratio (NLR) was increased in patients (P < 0.001). CD3+, CD3+CD8+, and CD4+ T cell subtypes were also examined. Percentages and counts of CD3+ and CD3+CD8+ T cells were not significantly different between patients and healthy controls (P > 0.05). However, percentages of CD4+ T cells were higher in patients than in healthy controls (P = 0.002).
NKG2D and KIR2DL3 expression on NK cells
NK cells play key roles in innate immunity. We examined NK cells and their activation (CD314) and inhibition (CD158b) signaling molecules. Percentages and counts of NK cells were not different between patients and healthy controls (P > 0.05). Similarly, CD314+ NK cells and CD158b+ NK cells were not statistically different (data not shown). Instead, we observed that percentages of CD314+CD158b− NK cells were lower in patients than in healthy controls (P = 0.047), whereas percentages of CD314−CD158b+ NK cells were higher in patients than in healthy controls (P < 0.001).
PD-1 and CLLA-4 expression on Tregs and CTLs
Tregs are major immune suppressive cells in cancer progression, whereas CTLs are the primary antitumor effector cells. Percentages of CD4+CD25+ Tregs (P = 0.029) and percentages and counts of CD4+CD279+ and CD4+CD152+ cells were significantly higher in patients than in healthy controls (P < 0.001). Likewise, percentages and counts of CD152+CD3+CD8+ and CD279+CD3+CD8+ cells were significantly higher in patients than in healthy controls (P < 0.005). However, CD8+CD152 and CD8+CD279+ cells were not different between patients and healthy controls (data not shown).
Th1/Th2 balance
An abnormal Th1/Th2 balance is associated with cancer, and the Th1/Th2 ratio has been used in in vitro assays of quantifying cytokines such as IFN-γ and IL4 after cell stimulation. However, we analyzed the ex vivo state of the Th1/Th2 balance using surface chemokine receptors CD183, CD194, and CD196, as described in a previous report [7]. Percentages of Th1 cells were lower in patients than in healthy controls (P = 0.001). In contrast, percentages of Th2 cells were higher in patients than in healthy controls (P = 0.006). Consequently, the Th1/Th2 ratio was significantly decreased in patients (P < 0.001). However, there was no difference in Th17 cells between patients and healthy controls (P > 0.05).
Circulating MDSCs
Lineage-negative (CD3−/CD19−/56−) HLA–DR–CD11b+CD33+ MDSCs are immune suppressive cells that function similar to Tregs. Thus, these peripheral cells were also analyzed. Significantly high counts of MDSCs were observed in patients compared to healthy controls (P = 0.010). Likewise, the percentages of MDSCs seemed higher in patients than in healthy controls, although this difference was not statistically significant (P = 0.232).
ICPs TIM-3, LAG-3, and BTLA
In our pilot study, we observed that CD223 was rarely expressed on lymphocyte surfaces, whereas CD366 and CD272 were detected on the cell surfaces. Furthermore, we found that all three molecules were stably expressed in lymphocytes, which led us to analyze their intracellular levels. Thus, we examined these molecules in both CD3+ T cells and CD3− cells. CD366 expression was not different between patients and healthy controls (P > 0.05). However, the percentages and counts of CD3+CD272+ and CD3+CD223+ T cells were significantly higher in patients than in healthy controls (P < 0.02), whereas those of CD3−CD272+ and CD3−CD223+ cells were not different between patients and healthy controls (P > 0.05).
Blood immune cells and cancer stage
Next, we wondered whether blood immune cells are altered as cancer progresses. To examine this, we classified patients into two early stage (I and II) and late stage (III and IV) groups. The percentages of lymphocytes and neutrophils were markedly decreased and increased, respectively, as with advance cancer stages (P < 0.05), and the NLR was increased in the late stage group compared to early stage group (P < 0.05). The percentages of Th2 cells were also significantly higher in the late stage group (P = 0.029) (Table 3). Similarly, we found distant metastasis altered immune cells (Table 4). Counts of WBCs, neutrophils, CD279+CD3+CD8+ CTLs, and CD3+CD223+ cells were significantly higher in the M1 group than in the M0 group (P = 0.01). The percentages of CD3+CD366+ and CD3+CD223+ cells were also significantly higher in the metastasis group than in the non-metastasis group (P < 0.05).
Binary logistic regression analysis for cancer diagnosis
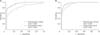
We then examined whether cancer-related changes in blood immune cell compartments would be useful in cancer diagnosis. Because cancer prediction with a single factor is unlikely, we examined reliable algorithms that could reflect cancer-related immune dynamics, and a well-designed binary logistic regression model was used for this analysis. According to the initiation date of our study, the total data set was divided into a training data set that included a retrospective cohort (62 patients and 100 healthy co ntrols) to establish the model and validate the data set for use with the prospective cohort (69 patients and 74 healthy controls) to confirm the model. Various forward stepwise logistic regression models were obtained. The area under the curve (AUC) of the ROC curve, sensitivity, and specificity were then calculated. Among the models, we found the best fit, and the following diagnostic equations were used:
The ROC curve analysis showed that the AUC of the training data set was 0.960 and the sensitivity and specificity were 88.50% and 87.50%, respectively, with a cutoff value of 0.365, whereas the AUC of the validation data set was 0.840 and the sensitivity and specificity were 76.74% and 78.13%, respectively (Fig. 1A). Next, age was added to the 11 variables to obtain the modified equation below:
The AUC of the ROC curve, sensitivity, and specificity of the training data set and validation data set were 0.980 vs. 0.940, 91.53% vs. 85.80%, and 93.50% vs. 86.20%, respectively (Fig. 1B).
DISCUSSION
Dynamic cross-talk between various types of immune cells and secretory molecules such as cytokines and chemokines, immunoglobulins, and complement constitutes the immune network [8]. Thus, immunity is not the effect of single cells or molecules but a net effect resulting from the several compartments of the whole immune system [69]. The peripheral blood stream as opposed to the central lymphoid organs allows systemic immunity to react rapidly to exogenous and endogenous dangers that are able to breach the host in a physiologically steady state [10]. As a result, the peripheral immune system is sensitive and changes constantly. Circadian change in WBCs and different immune profiles depending on sex, age, and even the lifestyle are examples of this phenomenon.
Immune changes are believed to be associated with cancer progression [11,12]. Growing evidence from animal experiments supports this idea, although the process and mechanisms of cancer immunity are not still clearly understood [13]. In fact, reports on basic and clinical studies indicate that immunity in most cancer patients is defective compared to that in healthy controls [14,15]. It is well known, for example, that Tregs [16], MDSCs [17], and tumor-associated macrophages [18] play an adverse role in anti-tumor immunity, Th2 cell dominance over Th1 cells is favorable for tumorigenesis [19], and the frequency of infiltrating tumor lymphocytes affects patient survival [20]. These observations suggest that restoring the immune balance would be beneficial for cancer treatment and therapy [21].
Therefore, cancer immunotherapy might offer promising treatment modalities, and many different types of immunotherapy have been applied to patients, depending on the supposed path to anti-tumor immunity [2223]. Among them are successful therapies targeting ICPs—crucial molecules that function as receptors and ligands in cell signaling pathways related to antitumor immunity [2425]. The main strategy of the therapy is to block abnormally expressed inhibitory signaling molecules using specific antibody to restore antitumor immunity. For instance, programed death 1 (PD-1) and cytotoxic T lymphocyte antigen 4 (CTLA-4) are the most wellknown target molecules associated with cytotoxic activity of effector T cells against cancer cells, and therapeutic antibodies targeting PD-1 and CTLA-4 signaling pathway components have been used clinically with U.S. Food and Drug Administration approval [26]. In addition, other signaling checkpoint molecules such as T-cell immunoglobulin and mucin-domain containing-3 (TIM-3), Lymphocyte-activation gene 3 (LAG3), B-and T-lymphocyte attenuator (BTLA), T cell immunoreceptor with Ig and ITIM domains (TIGIT), and V-domain Ig suppressor of T cell activation (VISTA) have been scrutinized for clinical application [27]. Therefore, suppressive immune cells and ICP molecules could be valuable indicators for diagnosis and treatment of cancer [28].
Based on these promising studies, we considered immunodiagnostics for cancer feasible and attempted to identify indicators that could be detected in the peripheral blood. Specifically, we investigated major blood immune cells and checkpoint molecules in the peripheral blood using flow cytometry and an automatic hematology analyzer. We observed that WBCs, Tregs, MDSCs, and the NLR were increased, but that Th1/Th2 decreased in the blood stream of cancer patients. These findings indicate that immune cells unfavorable in antitumor immunity also reside in the peripheral blood, as they do in tumor microenvironments [3512].
Then, we were interested in whether ICP molecules that had mostly been reported in tumor microenvironments were also highly expressed in the peripheral blood immune compartment of cancer patients. KIR2DL3 and NKG2D on NK cells, and PD-1, CTLA-4, TIM-3, LAG-3, and BTLA on T cells were examined. We found that CD314 and CD158b on NK cells were only significantly elevated in CD314+CD158b−CD3−CD56+ and CD314−CD158b+CD3−CD56+ cells, but not in CD314+CD3−CD56+ and CD158b+CD3−CD56+ cells. Likewise, PD-1 was constitutively expressed on T cells subsets. However, the most significant difference between patients and controls was detected in CD4+CD279+ and CD3+CD8+CD279+ cells compared to CD4+CD25+CD279+ or CD3+CD279+ cells. In contrast, CTLA-4 and LAG-3 was hardly expressed on cell surfaces, but we found they were stably expressed intracellularly, with the most statistical significant difference in intracellular CTLA-4 levels found in CD4+CD152+ and CD3+CD8+CD152+ cells compared to CD4+CD25+CD152+ or CD3+CD152+ cells. In addition, surfacerare LAG-3 and surface-bound BTLA were only significant when they were examined intracellularly in CD3−CD223+ and CD3−CD272+ cells. These observations all show that the gating strategy and analytical technique are critical in identifying meaningful checkpoint molecules for the immunodiagnostics of cancer.
Finally, our main concern was to determine the likelihood of devising reliable immunodiagnostics for cancer that would show both sensitivity and specificity over 80% in accordance with the general recommendations for clinical diagnostic tests [2930]. For this, we used a binary logistic regression analysis model comprising various combinations of blood immune cells as variables in logit equations. We found a best logit function that included 11 variables, with acceptable retrospective AUC, sensitivity, and specificity; however, the results of prospective validation were unacceptable. Next, we made a logit model that included the best 11 variables plus one more variable, age, on the supposition that age affected blood immune cells, and the result of retrospective and prospective estimation of sensitivity and specificity for predicting cancer were both acceptable at greater than 80%. This finding supports our idea that peripheral blood immunity is very valuable and the more significant peripheral indicators we can find, the better and more reliable immunodiagnostics for cancer that could be developed for use in clinics.
In conclusion, this study is a pilot test that has several limitations: above all, the sample size was small, and age- and sex-mismatched healthy controls were used in developing logistic regression algorithm without enough test and conclusion of whether or not these two factors would influence an expression of certain markers on immune cells. This might be shortcomings because some research articles have covered age- and sex-related changes in lymphocyte subpopulations, although we did not find a statistical difference between the healthy male and female groups in all 11 parameters used in our logistic regression model. Methodologically, the double platform method was performed using a hematology analyzer and flow cytometer based on simultaneous four-color detection of target antigens. Furthermore, whether the patterns of peripheral blood cancer immunity in CRC are analogous to those of other types of cancer should be investigated. Despite these limitations, we believe that our results would appeal to the broad readership interested in cancer diagnosis and treatment, and suggest that research of peripheral blood immune system should be extensively conducted to develop reliable immunodiagnostics for cancer prediction and treatment.


 XML Download