Journal List > J Rheum Dis > v.25(2) > 1094821

Byun, Jung, Song, Park, and Lee: Hemoglobin A1c, Not Glycated Albumin, Can Independently Reflect the Ankylosing Spondylitis Disease Activity Score

Abstract

Objective

This study examined whether glycated hemoglobin (HbA1c) and glycated albumin (GA) are well correlated with the Ankylosing Spondylitis Disease Activity Score (ASDAS)-erythrocyte sedimentation rate (ESR), and ASDAS-C-reactive protein (CRP) in AS patients without medical conditions affecting the glycated protein levels.

Methods

The data of 76 patients with AS were analyzed. Univariate and multivariate analyses of the variables associated with ASDAS-ESR and ASDAS-CRP were performed using a linear regression test. The patients were divided into active and inactive AS groups based on an ASDAS-CRP of 2.1, and the variables between the two groups were compared.

Results

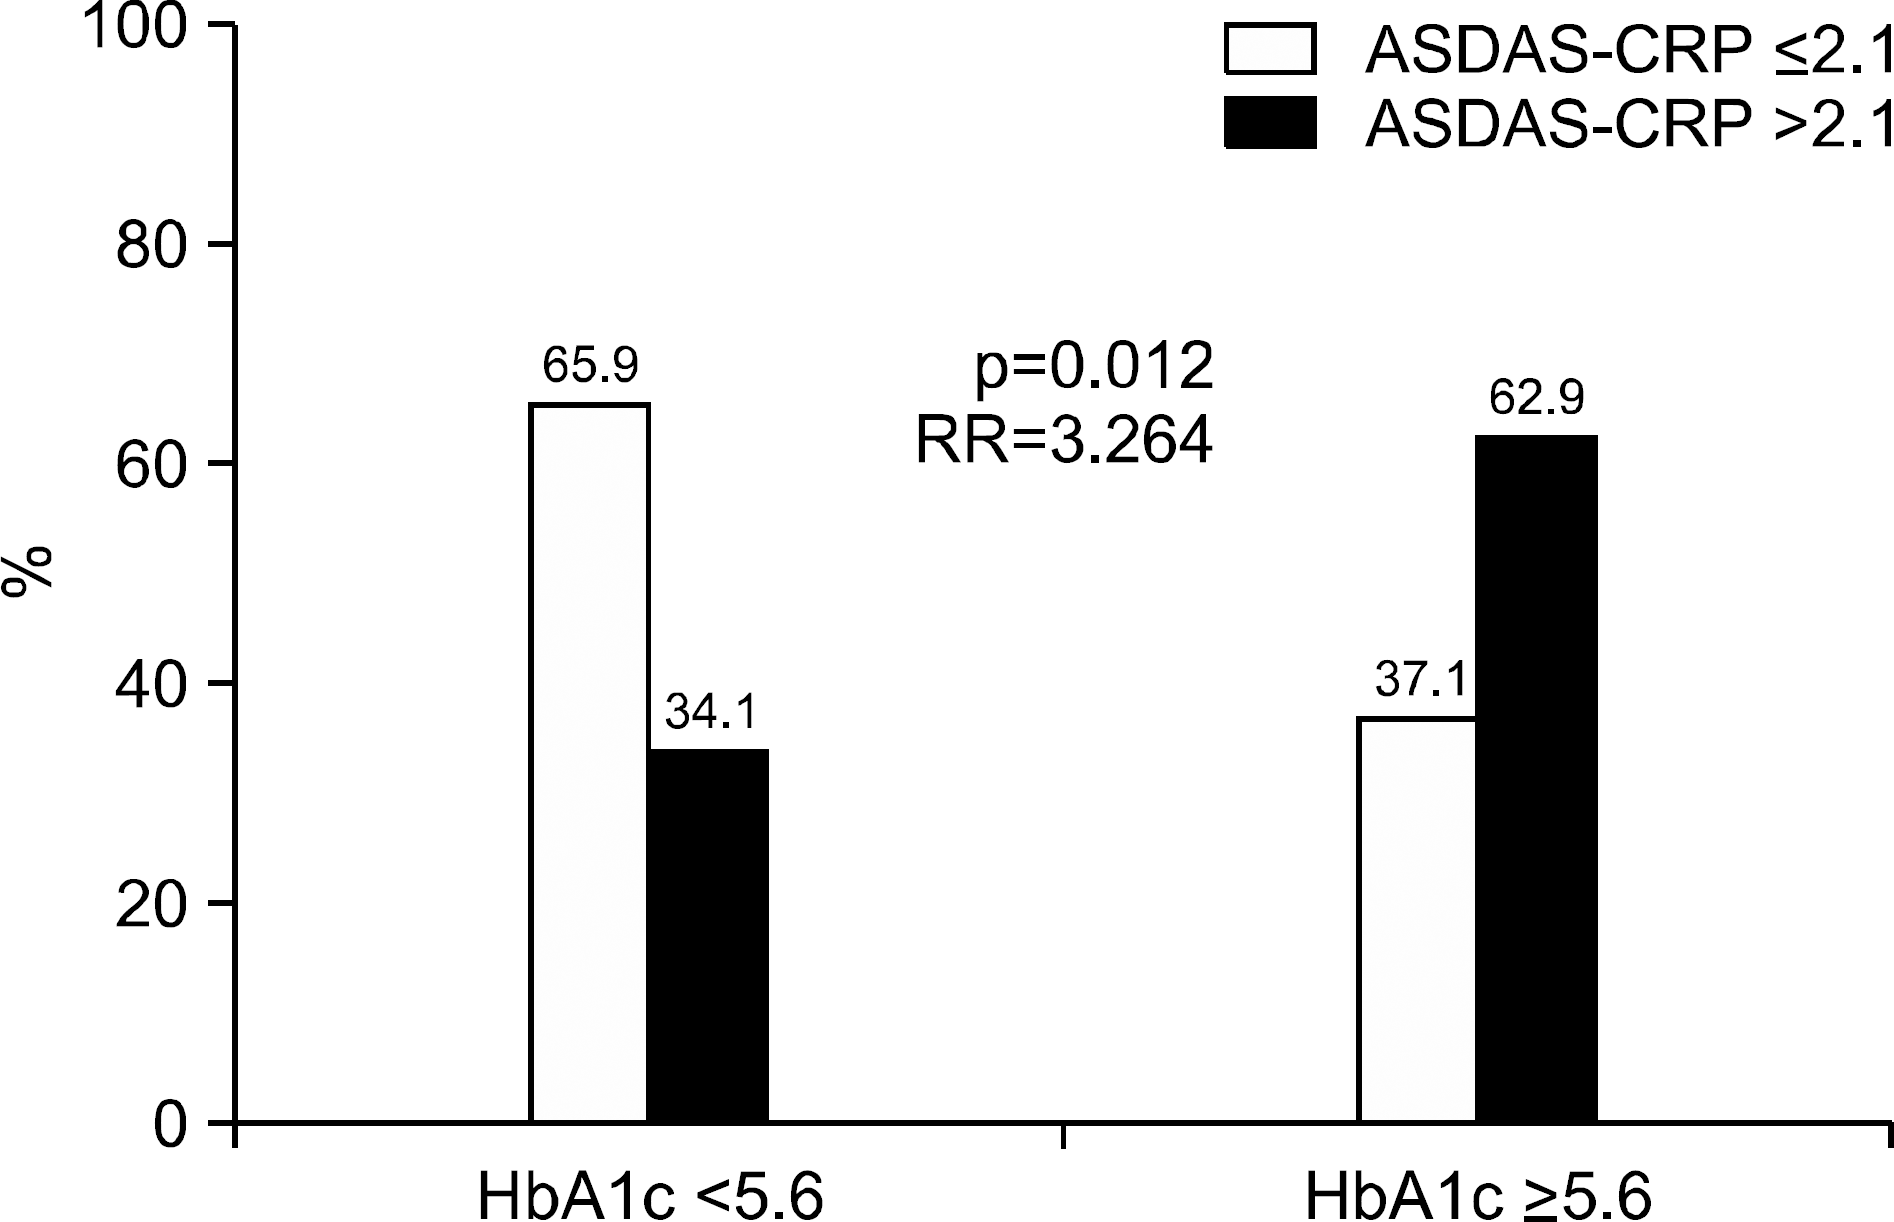
ASDAS-ESR did not correlated with either HbA1c or GA. ASDAS-CRP was positively correlated with HbA1c (r=0.315, p=0.006) and the white blood cell (r=0.288, p=0.012), and inversely correlated with hemoglobin (r=−0.241, p=0.036) and serum albumin (r=−0.262, p=0.022), but not GA. Multivariate analysis revealed HbA1c and white blood cell to be significantly correlated with ASDAS-CRP (β=0.234, p=0.033 and β=0.265, p=0.017). The mean HbA1c, not GA, of the active group was significantly higher than that of the inactive group (p=0.020). In addition, the optimal cutoff value of HbA1c was set to 5.6, and the patients with HbA1c ≥5.6 were found to have a 3.3 times higher risk of active AS than those without.

Conclusion

HbA1c was significantly correlated with ASDAS-CRP, and could be a useful marker to reflect ASDAS-CRP in AS patients without medical conditions affecting the glycated protein levels.

REFERENCES

1. Pedersen SJ, Sørensen IJ, Garnero P, Johansen JS, Madsen OR, Tvede N, et al. ASDAS, BASDAI and different treatment responses and their relation to biomarkers of inflammation, cartilage and bone turnover in patients with axial spondyloarthritis treated with TNFα inhibitors. Ann Rheum Dis. 2011; 70:1375–81.
crossref
2. Braun J, Davis J, Dougados M, Sieper J, van der Linden S, van der Heijde D. First update of the international ASAS consensus statement for the use of anti-TNF agents in patients with ankylosing spondylitis. Ann Rheum Dis. 2006; 65:316–20.
crossref
3. Braun J, van den Berg R, Baraliakos X, Boehm H, Burgos-Vargas R, Collantes-Estevez E, et al. 2010 update of the ASAS/EULAR recommendations for the management of ankylosing spondylitis. Ann Rheum Dis. 2011; 70:896–904.
crossref
4. Dougados M, Gueguen A, Nakache JP, Velicitat P, Zeidler H, Veys E, et al. Clinical relevance of C-reactive protein in axial involvement of ankylosing spondylitis. J Rheumatol. 1999; 26:971–4.
5. Garrett S, Jenkinson T, Kennedy LG, Whitelock H, Gaisford P, Calin A. A new approach to defining disease status in ankylosing spondylitis: the Bath Ankylosing Spondylitis Disease Activity Index. J Rheumatol. 1994; 21:2286–91.
6. van der Heijde D, Lie E, Kvien TK, Sieper J, Van den Bosch F, Listing J, et al. ASDAS, a highly discriminatory ASAS-en-dorsed disease activity score in patients with ankylosing spondylitis. Ann Rheum Dis. 2009; 68:1811–8.
crossref
7. Basta G, Lazzerini G, Massaro M, Simoncini T, Tanganelli P, Fu C, et al. Advanced glycation end products activate endothelium through signal-transduction receptor RAGE: a mechanism for amplification of inflammatory responses. Circulation. 2002; 105:816–22.
8. Goldin A, Beckman JA, Schmidt AM, Creager MA. Advanced glycation end products: sparking the development of diabetic vascular injury. Circulation. 2006; 114:597–605.
9. Koga M, Kasayama S. Clinical impact of glycated albumin as another glycemic control marker. Endocr J. 2010; 57:751–62.
crossref
10. Koga M, Murai J, Morita S, Saito H, Kasayama S. Comparison of annual variability in HbA1c and glycated albumin in patients with type 1 vs. type 2 diabetes mellitus. J Diabetes Complications. 2013; 27:211–3.
crossref
11. Koga M, Otsuki M, Matsumoto S, Saito H, Mukai M, Kasayama S. Negative association of obesity and its related chronic inflammation with serum glycated albumin but not glycated hemoglobin levels. Clin Chim Acta. 2007; 378:48–52.
crossref
12. Park JS, Song J, Park YB, Lee SK, Lee SW. Glycated albumin increases with disease activity in rheumatoid factor positive rheumatoid arthritis patients with normal fasting glucose and HbA1c. Joint Bone Spine. 2017; 84:115–8.
crossref
13. van der Linden S, Valkenburg HA, Cats A. Evaluation of diagnostic criteria for ankylosing spondylitis. A proposal for modification of the New York criteria. Arthritis Rheum. 1984; 27:361–8.
14. Koga M, Murai J, Saito H, Kasayama S, Imagawa A, Hanafusa T, et al. Serum glycated albumin to haemoglobin A(1C) ratio can distinguish fulminant type 1 diabetes mellitus from type 2 diabetes mellitus. Ann Clin Biochem. 2010; 47:313–7.
crossref
15. Koga M, Murai J, Saito H, Matsumoto S, Kasayama S. Effects of thyroid hormone on serum glycated albumin levels: study on non-diabetic subjects. Diabetes Res Clin Pract. 2009; 84:163–7.
crossref
16. Okada T, Nakao T, Matsumoto H, Nagaoka Y, Tomaru R, Iwasawa H, et al. Influence of proteinuria on glycated albumin values in diabetic patients with chronic kidney disease. Intern Med. 2011; 50:23–9.
crossref
17. Nomura Y, Nanjo K, Miyano M, Kikuoka H, Kuriyama S, Maeda M, et al. Hemoglobin A1 in cirrhosis of the liver. Diabetes Res. 1989; 11:177–80.
18. Panzer S, Kronik G, Lechner K, Bettelheim P, Neumann E, Dudczak R. Glycosylated hemoglobins (GHb): an index of red cell survival. Blood. 1982; 59:1348–50.
crossref
19. Machado P, Navarro-Compán V, Landewé R, van Gaalen FA, Roux C, van der Heijde D. Calculating the ankylosing spondylitis disease activity score if the conventional c-reactive protein level is below the limit of detection or if high-sensitivity c-reactive protein is used: an analysis in the DESIR cohort. Arthritis Rheumatol. 2015; 67:408–13.
20. Calin A, Garrett S, Whitelock H, Kennedy LG, O'Hea J, Mallorie P, et al. A new approach to defining functional ability in ankylosing spondylitis: the development of the Bath Ankylosing Spondylitis Functional Index. J Rheumatol. 1994; 21:2281–5.
21. Jones SD, Steiner A, Garrett SL, Calin A. The bath ankylosing spondylitis patient global score (BAS-G). Br J Rheumatol. 1996; 35:66–71.
crossref
22. Pu LJ, Lu L, Xu XW, Zhang RY, Zhang Q, Zhang JS, et al. Value of serum glycated albumin and high-sensitivity C-reactive protein levels in the prediction of presence of coronary artery disease in patients with type 2 diabetes. Cardiovasc Diabetol. 2006; 5:27.
crossref
23. Maria Z, Yin W, Rubenstein DA. Combined effects of physiologically relevant disturbed wall shear stress and glycated albumin on endothelial cell functions associated with inflammation, thrombosis and cytoskeletal dynamics. J Diabetes Investig. 2014; 5:372–81.
crossref
24. Gustavsson CG, Agardh CD. Markers of inflammation in patients with coronary artery disease are also associated with glycosylated haemoglobin A1c within the normal range. Eur Heart J. 2004; 25:2120–4.
25. Rudwaleit M, Haibel H, Baraliakos X, Listing J, Märker-Hermann E, Zeidler H, et al. The early disease stage in axial spondylarthritis: results from the German Spondyloarthritis Inception Cohort. Arthritis Rheum. 2009; 60:717–27.
crossref
26. Kim KJ, Lee BW. The roles of glycated albumin as intermediate glycation index and pathogenic protein. Diabetes Metab J. 2012; 36:98–107.
crossref
27. Danve A, O'Dell J. The ongoing quest for biomarkers in Ankylosing Spondylitis. Int J Rheum Dis. 2015; 18:826–34.
crossref
28. de Rotte MC, de Jong PH, den Boer E, Pluijm SM, Özcan B, Weel AE, et al. Effect of methotrexate use and erythrocyte methotrexate polyglutamate on glycosylated hemoglobin in rheumatoid arthritis. Arthritis Rheumatol. 2014; 66:2026–36.
crossref
29. Krogh Jensen M, Ekelund S, Svendsen L. Folate and homocysteine status and haemolysis in patients treated with sul-phasalazine for arthritis. Scand J Clin Lab Invest. 1996; 56:421–9.
30. Lithell HO. Effect of antihypertensive drugs on insulin, glucose, and lipid metabolism. Diabetes Care. 1991; 14:203–9.
crossref
31. Goyal A, Singh S, Tandon N, Gupta N, Gupta YK. Effect of atorvastatin on pancreatic Beta-cell function and insulin resistance in type 2 diabetes mellitus patients: a randomized pilot study. Can J Diabetes. 2014; 38:466–72.
crossref

Figure 1.
Optimal cutoff values of HbA1c to reflect active ankylosing spondylitis. Active ankylosing spondylitis in patients having HbA1c ≥5.6 was identified more often than in those having HbA1c <5.6 (62.9% vs. 34.1%, p=0.012). Patients having HbA1c more than 5.6 showed significantly enhanced risk of active AS than those having not (RR=3.264). ASDAS: ankylosing spondylitis disease activity score, CRP: C-reactive protein, RR: relative risk, HbA1c: hemoglobin A1c, AS: ankylosing spondylitis.
jrd-25-131f1.tif
Supplementary Table 1.
Correlation among variables related to glucose metabolism and disease activity of ankylosing spondylitis (n=76)
  BMI HbA1c GA Fasting glucose ASDAS-ESR ASDAS-CRP BASDAI BAS-G
BMI 1              
HbA1c 0.227* 1            
GA −0.268* 0.400* 1          
Fasting glucose 0.331* 0.405* 0.186 1        
ASDAS-ESR 0.013 0.220 0.105 0.011 1      
ASDAS-CRP 0.032 0.315* 0.135 0.037 0.792* 1    
BASDAI 0.019 0.226* 0.192 0.010 0.719* 0.774* 1  
BAS-G 0.039 0.401* 0.221 0.166 0.568* 0.617* 0.655* 1
BASFI −0.118 0.124 0.111 0.013 0.376* 0.322* 0.211 0.279*

BMI: body mass index, HbA1c: haemoglobin A1c, GA: glycated albumin, ASDAS: ankylosing spondylitis disease activity score, BASDAI: Bath ankylosing spondylitis disease activity index, BAS-G: Bath ankylosing spondylitis patient global score, BASFI: Bath ankylosing spondylitis disease activity functional index.

* p<0.05.

Table 1.
Baseline characteristics of patients with ankylosing spondylitis (n=76)
Variable Value
Demographic data
Age (yr) 39.0 (18.0)
Male gender 58 (76.3)
Follow-up duration (yr) 5.0 (8.5)
Smoking 29 (38.2)
BMI (kg/m2) 24.0 (5.0)
HLA-B27 60 (78.9)
Syndesmophyte formation 20 (26.3)
Laboratory results
HbA1c (%) 5.5 (0.4)
GA (%) 12.7 (1.5)
Fasting glucose (mg/dL) 95.5 (12.8)
ESR (mm/h) 19.0 (28.0)
CRP (mg/L) 2.3 (5.9)
Ferritin (mg/dL) 75.5 (70.0)
White blood cell (/mm3) 7,325.0 (2,580.0)
Hemoglobin (g/dL) 14.9 (2.4)
Platelet×103 (/mm3) 261.0 (69.5)
Albumin (mg/dL) 4.4 (0.5)
Blood urea nitrogen (mg/dL) 13.9 (4.4)
Creatinine (mg/dL) 0.8 (0.2)
Alkaline phosphatase (IU/L) 70.0 (26.0)
Aspartate aminotransferase (IU/L) 21.0 (8.0)
Alanine aminotransferase (IU/L) 18.0 (17.0)
Total cholesterol (mg/dL) 188.0 (40.5)
High density cholesterol (mg/dL) 53.0 (17.0)
Low density cholesterol (mg/dL) 107.8 (24.4)
Triglyceride (mg/dL) 96.0 (76.0)
Disease activity indexes
ASDAS-ESR 2.2 (1.5)
ASDAS-CRP 1.8 (1.4)
BASDAI 3.3 (2.4)
BAS-G 3.0 (3.3)
BASFI 1.3 (2.6)
Medications
Glucocorticoid use 7 (9.2)
Methotrexate use 5 (6.6)
Sulfasalazine use 39 (51.3)
Anti-TNF agents use 27 (35.5)

Values are expressed as median (interquartile range, IQR) or number (%). BMI: body mass index, HLA: human leukocyte antigen, HbA1c: hemoglobin A1c, GA: glycated albumin, ESR: erythrocyte sedimentation rate, CRP: C-reactive protein, ASDAS: ankylosing spondylitis disease activity score, BASDAI: bath ankylosing spondylitis disease activity index, BAS-G: bath ankylosing spondylitis patient global score, BASFI: bath ankylosing spondylitis disease activity functional index, TNF: tumour necrosis factor.

Table 2.
Univariate and multivariate analysis of ASDAS-ESR and other variables
Variable Univariate analysis Multivariate analysis
Regression coefficient (crude B) Correlation coefficient (R=β) p-value Standardized β* 95% confidential interval p-value
Demographic data
Age (yr) 0.013 0.172 0.136      
Follow-up duration (yr) −0.002 −0.011 0.923      
BMI (kg/m2) 0.003 0.013 0.910      
Laboratory results
HbA1c (%) 0.661 0.220 0.056 0.102 −0.298, 0.911 0.316
GA (%) 0.069 0.105 0.368      
Fasting glucose (mg/dL) 0.001 0.011 0.923      
ESR (mm/h) N/A N/A N/A      
CRP (mg/L) 0.054 0.448 0.001      
Ferritin (mg/dL) −0.002 −0.145 0.296      
White blood cell (/mm3) 0.120 0.266 0.020 0.266 0.028, 0.211 0.011
Hemoglobin (g/dL) −0.229 −0.414 0.001 −0.355 −0.316, −0.075 0.002
Platelet×103 (/mm3) 0.003 0.206 0.074      
Serum albumin (mg/dL) −1.187 −0.394 0.001 −0.195 −1.249, 0.075 0.081
Blood urea nitrogen (mg/dL) 0.057 0.223 0.053      
Creatinine (mg/dL) −0.620 −0.104 0.373      
Alkaline phosphatase (IU/L) 0.009 0.181 0.121      
Aspartate aminotransferase (IU /L) 0.004 0.029 0.805      
Alanine aminotransferase (IU/L) 0.004 0.040 0.734      
Total cholesterol (mg/dL) 0.003 0.109 0.350      
High density cholesterol (mg/dL) 0.005 0.078 0.569      
Low density cholesterol (mg/dL) −0.001 −0.040 0.765      
Triglyceride (mg/dL) 0.002 0.121 0.366      
Medications
Glucocorticoid use 0.350 0.106 0.364      
Methotrexate use −0.056 −0.015 0.901      
Sulfasalazine use 0.385 0.201 0.082      
Anti-TNF agents use −0.140 −0.070 0.548      

ASDAS: ankylosing spondylitis disease activity score, ESR: erythrocyte sedimentation rate, BMI: body mass index, HbA1c: hemoglobin A1c, GA: glycated albumin, CRP: C-reactive protein, TNF: tumour necrosis factor, N/A: not available. *CRP was not included in multivariate analysis, because CRP is a variable closely correlated with ESR (ASDAS-ESR) in inflammation in order not to confound the interpretation of statistical results.

Table 3.
Univariate and multivariate analysis of ASDAS-CRP and other variables
Variable Univariate analysis Multivariate analysis
Regression coefficient (crude B) Correlation coefficient (R=β) p-value Standardized β* 95% confidential interval p-value
Demographic data
Age (yr) 0.013 0.164 0.158      
Follow-up duration (yr) 0.015 0.105 0.367      
BMI (kg/m2) 0.008 0.032 0.781      
Laboratory results
HbA1c (%) 0.972 0.315 0.006 0.234 0.060, 1.383 0.033
GA (%) 0.091 0.135 0.244      
Fasting glucose (mg/dL) 0.004 0.037 0.750      
ESR (mm/h) 0.026 0.477 0.001      
CRP (mg/L) N/A N/A N/A      
Ferritin (mg/dL) −0.003 −0.199 0.150      
White blood cell (/mm3) 0.133 0.288 0.012 0.265 0.022, 0.222 0.017
Hemoglobin (g/dL) −0.137 −0.241 0.036 −0.204 −0.248, 0.016 0.084
Platelet×103 (/mm3) 0.002 0153 0.186      
Serum albumin (mg/dL) −0.811 −0.262 0.022 −0.099 −1.030, 0.419 0.404
Blood urea nitrogen (mg/dL) 0.027 0.104 0.373      
Creatinine (mg/dL) −0.243 −0.040 0.734      
Alkaline phosphatase (IU/L) 0.011 0.212 0.068      
Aspartate aminotransferase (IU/L L) 0.015 0.098 0.402      
Alanine aminotransferase (IU/L) 0.014 0.145 0.213      
Total cholesterol (mg/dL) 0.004 0.119 0.307      
High density cholesterol (mg/dL) −0.012 −0.159 0.246      
Low density cholesterol (mg/dL) 0.002 0.069 0.609      
Triglyceride (mg/dL) 0.004 0.184 0.166      
Medications
Glucocorticoid use 0.147 0.044 0.707      
Methotrexate use 0.236 0.060 0.604      
Sulfasalazine use Anti-TNF agents use 0.349−0.325 0.180 −0.161 0.120 0.166      

ASDAS: ankylosing spondylitis disease activity score, CRP: C-reactive protein, BMI: body mass index, HbA1c: hemoglobin A1c, GA: glycated albumin, ESR: erythrocyte sedimentation rate, TNF: tumour necrosis factor, N/A: not available.

* ESR was not included in multivariate analysis, because ESR is a variable closely correlated with CRP (ASDAS-CRP) in inflammation in order not to confound the interpretation of statistical results.

Table 4.
Comparison variables between patients with active and inactive ankylosing spondylitis based on ASDAS-CRP >2.1
Variable Inactive AS (n=40) Active AS (n=36) p-value
Demographic data
Age (yr) 37.3±11.2 40.8±12.8 0.201
Male gender 34 (85.0) 24 (66.7) 0.061
Follow-up duration (yr) 7.7±6.4 8.0±7.4 0.824
Smoking 14 (35.0) 15 (41.7) 0.055
BMI (kg/m2) 24.5±4.0 23.9±4.0 0.526
HLA-B27 30 (75.0) 30 (83.3) 0.374
Laboratory results
HbA1c (%) 5.4±0.3 5.6±0.3 0.020
GA (%) 12.7±1.2 13.0±1.7 0.395
Fasting glucose (mg/dL) 97.7±9.8 95.9±9.7 0.414
ESR (mm/h) 14.3±11.7 30.6±18.8 0.001
CRP (mg/L) N/A N/A N/A
Ferritin (mg/dL) 107.7±69.4 75.3±73.1 0.100
White blood cell (/mm3) 7,088.5±1,767.6 8,273.6±2,280.8 0.013
Hemoglobin (g/dL) 15.0±1.4 14.0±1.9 0.008
Platelet×103 (/mm3) 252.1±45.4 275.6±75.3 0.110
Albumin (mg/dL) 4.5±0.3 4.3±0.3 0.016
Blood urea nitrogen (mg/dL) 14.1±3.4 14.9±4.1 0.330
Creatinine (mg/dL) 0.8±0.2 0.8±0.2 0.551
Alkaline phosphatase (IU/L) 69.1±18.1 74.5±20.3 0.230
Aspartate aminotransferase (IU/L) 20.5±7.1 21.6±5.7 0.442
Alanine aminotransferase (IU/L) 19.7±10.1 21.7±9.5 0.398
Total cholesterol (mg/dL) 189.7±28.3 194.0±31.6 0.534
High density cholesterol (mg/dL) 53.4±8.6 50.7±15.8 0.425
Low density cholesterol (mg/dL) 116.8±31.4 116.3±29.3 0.945
Triglyceride (mg/dL) 95.5±39.3 113.4±49.1 0.129
Disease activity
ASDAS-ESR 1.8±0.6 3.1±0.8 0.001
ASDAS-CRP N/A N/A N/A
BASDAI 2.5±1.2 4.5±1.7 0.001
BAS-G 2.5±1.7 4.7±2.2 0.001
BASFI 1.7±4.3 2.9±1.8 0.185
Medications
Glucocorticoid use 2 (5.0) 5 (13.8) 0.181
Methotrexate use 2 (5.0) 3 (8.3) 0.651
Sulfasalazine use 19 (47.5) 20 (55.5) 0.258
Anti-TNF antibody use 16 (40.0) 11 (30.6) 0.390

Values are expressed as mean±standard deviation or number (%). ASDAS: ankylosing spondylitis disease activity score, CRP: C-reactive protein, AS: ankylosing spondylitis, BMI: body mass index, HLA: human leukocyte antigen, HbA1c: hemoglobin A1c, GA: glycated albumin, ESR: erythrocyte sedimentation rate, BASDAI: bath ankylosing spondylitis disease activity index, BAS-G: bath ankylosing spondylitis patient global score, BASFI: bath ankylosing spondylitis disease activity functional index, TNF: tumour necrosis factor, N/A: not available.

Table 5.
Multivariate logistic regression analysis using variables with statistical significance between patients with active and inactive ankylosing spondylitis based on ASDAS-CRP >2.1
Variable Odds ratio 95% confidence interval p-value
HbA1c (%) 4.132 0.704, 24.240 0.116
White blood cell (/mm3) 1.442 1.067, 1.947 0.017
Hemoglobin (g/dL) 0.656 0.456, 0.940 0.022
Albumin (mg/dL) 0.482 0.075, 3.086 0.441

ASDAS: ankylosing spondylitis disease activity score, CRP: C-reactive protein, HbA1c: hemoglobin A1c.

TOOLS
Similar articles