Abstract
Objective
Urolithiasis is one of the manifestations of gout and the risk is higher in gouty patients. On the other hand, an independent association between the urinary stone and serum uric acid (UA) level has not been established. This study examined whether the risk of urolithiasis increases with increasing serum UA level.
Methods
Among the people who visited a tertiary hospital from 2010 to 2013, 13,964 individuals who underwent both ultrasonography and a laboratory test were recruited in the study. The risk of urolithiasis on ultrasonography was analyzed in association with the serum UA level by multiple logistic regression analysis with an adjustment for age, sex, body mass index, estimated glomerular filtration rate, and known underlying diseases, including diabetes mellitus and hypertension.
Results
Among the 6,743 men (48.3%) and 7,221 women (51.7%), the age was 51.3±13.5 and the serum UA level was 4.5±2.1 mg/dL. Hyperuricemia (>7 mg/dL) was observed in 1,381 cases (9.9%). Urolithiasis was detected by ultrasonography in 608 cases (4.4%). The detection rates of urolithiasis in individuals with hyperuricemia and normouricemia were 5.9% and 4.1%, respectively (p=0.001). Multiple logistic regression analysis showed that individuals with hyperuricemia had a significantly higher risk of urolithiasis (adjusted odds ratio [OR]=1.54; 95% confidence interval [CI], 1.20∼1.96; p=0.001). A comparison of the highest with the lowest quartile of serum UA revealed a multi-variable-adjusted OR of 3.17 (95% CI, 1.98∼5.11) for men and 1.79 (1.08∼2.93) for women.
Go to : 
REFERENCES
1. Scales CD Jr, Smith AC, Hanley JM, Saigal CS. Prevalence of kidney stones in the United States. Eur Urol. 2012; 62:160–5.

3. Mehta TH, Goldfarb DS. Uric acid stones and hyper-uricosuria. Adv Chronic Kidney Dis. 2012; 19:413–8.

4. Shekarriz B, Stoller ML. Uric acid nephrolithiasis: current concepts and controversies. J Urol. 2002; 168:1307–14.

5. Yü T, Gutman AB. Uric acid nephrolithiasis in gout. Predisposing factors. Ann Intern Med. 1967; 67:1133–48.
6. Kramer HM, Curhan G. The association between gout and nephrolithiasis: the National Health and Nutrition Examination Survey III, 1988-1994. Am J Kidney Dis. 2002; 40:37–42.

7. Kramer HJ, Choi HK, Atkinson K, Stampfer M, Curhan GC. The association between gout and nephrolithiasis in men: The Health Professionals' Follow-Up Study. Kidney Int. 2003; 64:1022–6.

8. Madore F, Stampfer MJ, Willett WC, Speizer FE, Curhan GC. Nephrolithiasis and risk of hypertension in women. Am J Kidney Dis. 1998; 32:802–7.

9. Roubenoff R, Klag MJ, Mead LA, Liang KY, Seidler AJ, Hochberg MC. Incidence and risk factors for gout in white men. JAMA. 1991; 266:3004–7.

10. Fox J. Effect displays in R for generalised linear models. J Stat Softw. 2003; 8:1–27.
11. Roughley MJ, Belcher J, Mallen CD, Roddy E. Gout and risk of chronic kidney disease and nephrolithiasis: meta-analysis of observational studies. Arthritis Res Ther. 2015; 17:90.

13. Mazzali M, Hughes J, Kim YG, Jefferson JA, Kang DH, Gordon KL, et al. Elevated uric acid increases blood pressure in the rat by a novel crystal-independent mechanism. Hypertension. 2001; 38:1101–6.

14. Johnson RJ, Nakagawa T, Jalal D, Sánchez-Lozada LG, Kang DH, Ritz E. Uric acid and chronic kidney disease: which is chasing which? Nephrol Dial Transplant. 2013; 28:2221–8.

15. Brisbane W, Bailey MR, Sorensen MD. An overview of kidney stone imaging techniques. Nat Rev Urol. 2016; 13:654–62.

16. Teichman JM. Clinical practice. Acute renal colic from ureteral calculus. N Engl J Med. 2004; 350:684–93.
Go to : 
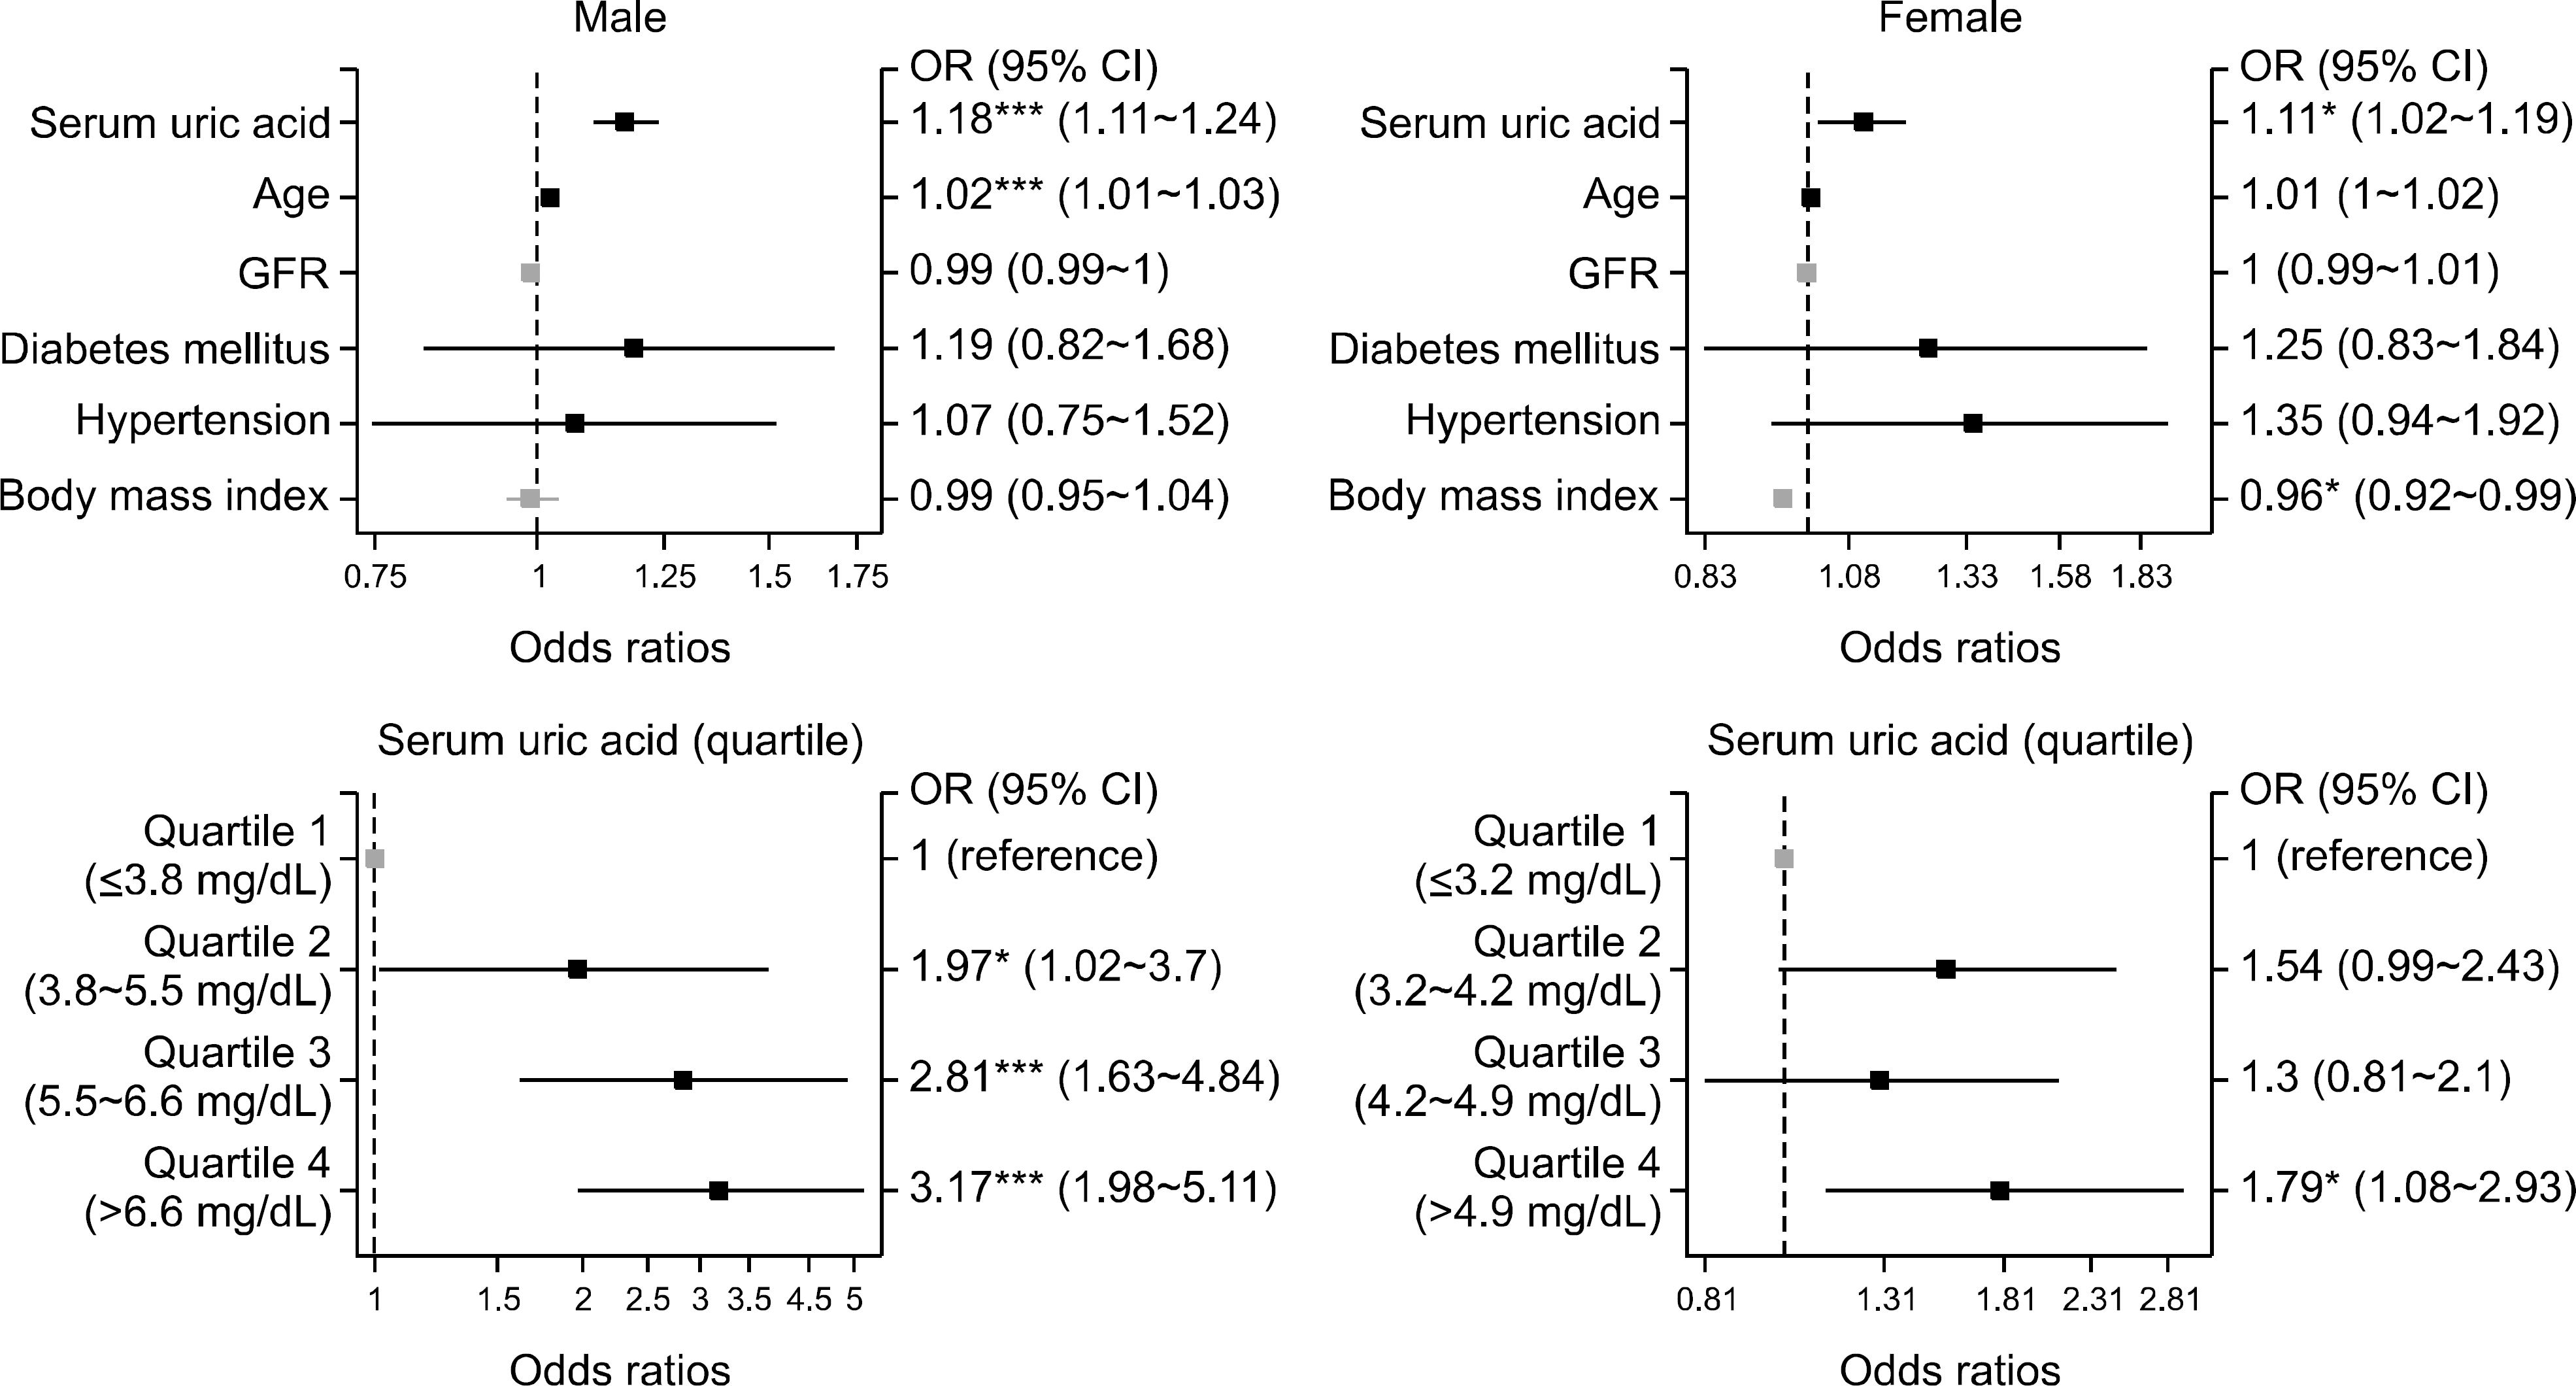
 | Figure 2.Plots of odds ratios (ORs) for urolithiasis according to serum uric acid level, age, glomerular filtration rate (GFR), presence of diabetes mellitus, presence of hypertension, body mass index, and serum uric acid quartile. Squares and horizontal bars represent ORs and 95% confidence intervals (CIs), respectively. *p<0.05, **p<0.01, ***p<0.001. |
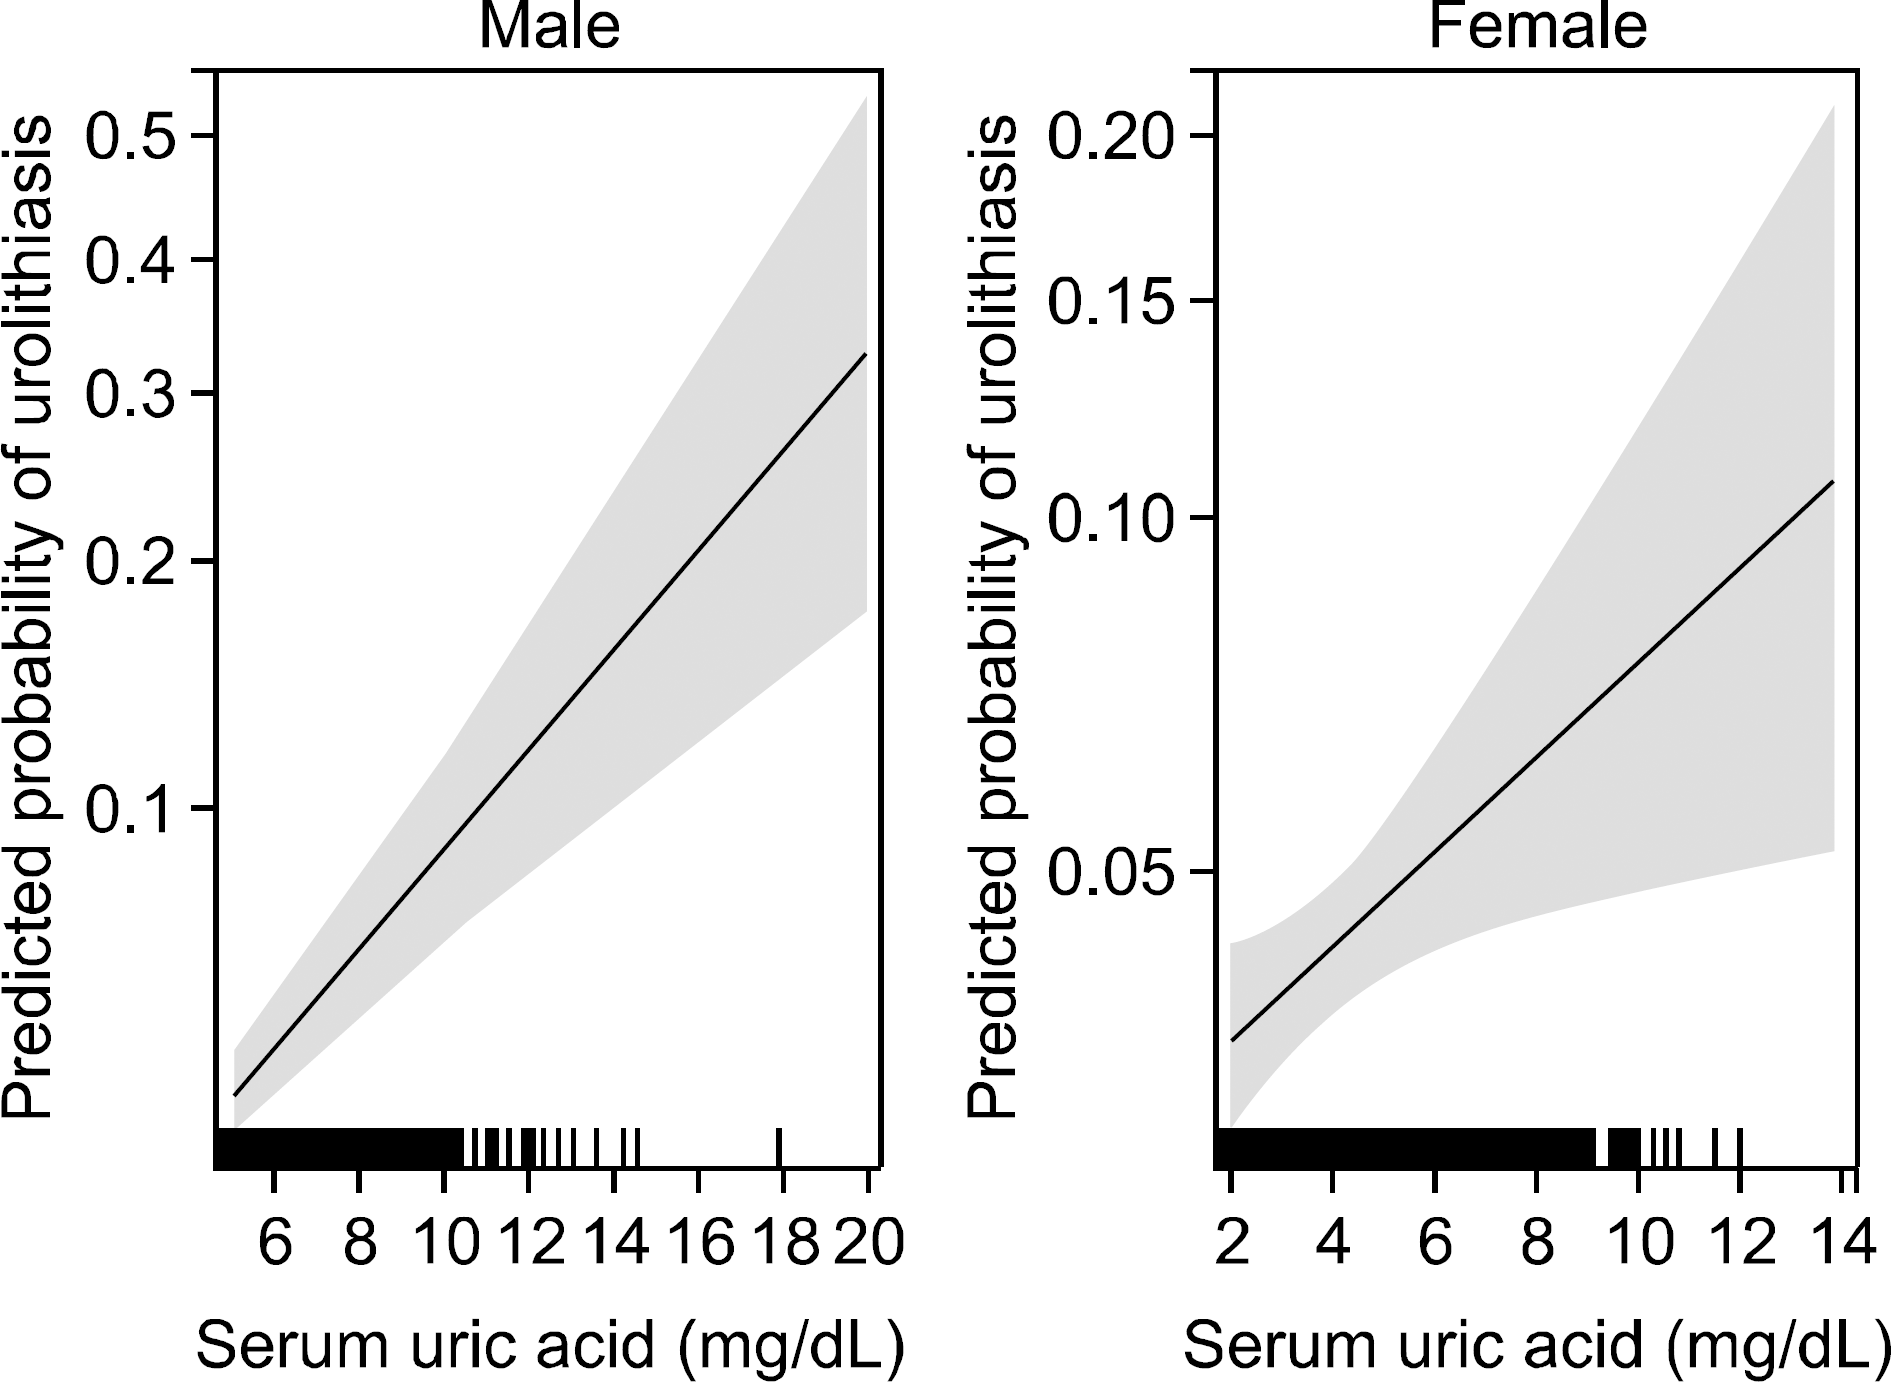
 | Figure 3.Effect plots showing the predicted probabilities and 95% confidence intervals (represented by shaded areas or error bars) for urolithiasis based on the multivariable logistic regression model. |
Table 1.
Clinical characteristics of the study population
Table 2.
Clinical characteristics of the study population according to gender
Table 3.
Age-adjusted and multivariable-adjusted odds ratio for the presence of urolithiasis by hyperuricemia
| Variable | Age-adjusted | p-value | Multivariable-adjusted* | p-value |
|---|---|---|---|---|
| Odds ratio (95% CI) | Odds ratio (95% CI) | |||
| No hyperuricemia | 1.00 (Reference) | 1.00 (Reference) | ||
| Hyperuricemia (serum uric acid >7 mg/dL) | ||||
| Total | 1.54 (1.21∼1.94) | <0.001 | 1.54 (1.20∼1.96) | 0.001 |
| Male | 1.50 (1.12∼1.98) | 0.005 | 1.47 (1.09∼1.94) | 0.009 |
| Female | 1.89 (1.13∼2.99) | 0.010 | 1.89 (1.11∼3.02) | 0.012 |
Table 4.
Age-adjusted and Multivariable-adjusted odds ratio for the presence of urolithiasis by serum uric acid level
| Variable | Age-adjusted | p-value | Multivariable-adjusted* | p-value |
|---|---|---|---|---|
| Odds ratio (95% CI)† | Odds ratio (95% CI)† | |||
| Total | 1.11 (1.07∼1.15) | <0.001 | 1.15 (1.09∼1.20) | <0.001 |
| Male | 1.13 (1.08∼1.19) | <0.001 | 1.18 (1.11∼1.24) | <0.001 |
| Female | 1.10 (1.03∼1.17) | 0.003 | 1.11 (1.02∼1.19) | 0.012 |


 PDF
PDF ePub
ePub Citation
 Print
Print


 XML Download