

 PDF
PDF ePub
ePub Citation
 Print
Print


INTRODUCTION
Limiting exposure to pollutants created by traffic, industrial complexes, gas stations, and commercial facilities is extremely important in terms of their health effects on school children.1 In addition, various potential hazards are likely to exist in schools adjacent to major roads, highways, and bus terminals.2 However, some researchers argue that there is no clear evidence regarding the complex health-hazard effects of traffic pollutants generated by nearby roads.3,4
The air pollutants from vehicle emissions are known to cause adverse health effects, and in particular, have been identified in previous studies as being involved in reduced lung function, respiratory infections, and asthma for people near large roads with heavy traffic.4567891011
Children are exposed to pollutants in schools and various school-related spaces for many hours of the day.12,13 In general, schools in downtown areas are exposed to pollutants from traffic emissions, while exposure to additional traffic pollutants due to drop-off and pick-up traffic as children arrive to or depart from school13 is often a factor, not only in rural or local schools but also in Korea's downtown schools. Heavy traffic is commonly present around the front gates at the start and end of the school day.
In general, the direct and indirect air pollutants created by traffic are particulate matter (PM10), sulfur dioxide (SO2), nitrogen oxides (NOx), volatile organic compounds, and polycyclic aromatic hydrocarbons.14151617 Black carbon (BC), which is emitted by the incomplete combustion of fuels in vehicles, has been shown by research to contribute to global warming, as well as respiratory disease and allergic diseases.181920212223
This study is an annual study, and has also been conducted in previous years. Its primary purpose is to classify schools based on traffic pollutants and complex pollution sources, to assess environments, to determine the state of allergic diseases among students by using the International Study of Asthma and Allergies in children (ISAAC) questionnaire, and to assess the association between the said diseases and air pollutants. Its secondary purpose is to integrate data from seven schools and to evaluate the data using odds ratios (ORs) for the status of allergic diseases among schools in specific environmental categories.1
MATERIALS AND METHODS
Study design
This is a cross-sectional study that categorized school areas and focused on schools and school zones in four cities, including three schools in Seoul, two schools in Incheon, one school in Busan, and one school in Ulsan. It also examined the relationship between the degree of environmental pollution and prevalence of allergic disease.
With a population of about 10 million, Seoul is the capital city of South Korea and is the nation's political, economic, and cultural center. Incheon is a metropolitan port city near Seoul with a population of about 2.5 million and a number of large-scale industrial complexes. Busan is a port city in the southern coastal area, and is the farthest major city from Seoul and the second largest city in Korea, with a population of about 5 million and various industrial complexes. Ulsan is a city near Busan, and as the mecca of the nation's automobile industry, it can be considered a representative industrial complex based city.
In terms of pollutants, an assessment was conducted on substances whose associations with allergic diseases have been examined in previous studies.1,24,25 In other words, pollutants such as PM10, BC, NO2, SO2, and O3 were assessed. Information about the allergic diseases of individual children and relevant family factors was collected with the ISAAC questionnaire. In addition, the present study divided final schools into three categories based on a traffic survey prior to the full investigation.
Traffic-related zone schools (S1: school inside beltway, S2: school near highway interchanges and bus terminals, S3: school with high numbers of large vehicles, such as heavy-duty and cargo vehicles), complex source zone schools I (S4: school with major roads, distribution centers and a cement plant, S5: school near small factories and highway), and complex source zone schools II (S6, S7: schools in industrial complexes).
Field site selection
In order to determine the effects of traffic pollutants, we conducted a survey of traffic volume by vehicle type (Table 1). In cases with average traffic volume in school zones, we determined the distribution of traffic volume during a 12-hour period (around 8:00 a.m. and 7:00 p.m.). The traffic volume during rush hours with heavy traffic (around 8:00 a.m. and 9:00 a.m.) when school children arrive to and leave from school was video-recorded at specific sites and then analyzed. This investigation focused on traffic volume during a specific time period, and traffic volume was measured over 15-minute intervals. The survey categorized vehicles into eight vehicle types based on the purpose of use, size of exterior, loading capacity, etc.
Traffic-related zones (S1, S2, S3)
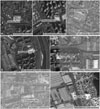
Among traffic-related zones, the S1 school is located in downtown Seoul, north of the Han River, with a road of 8 or more lanes and a beltway in front of the school (a noise barrier installed near a road), a bus stop at the front gate, and frequent traffic and idling vehicles nearby (Fig. 1A). It has high traffic volume during non-rush hours as well as rush hours (Table 1). The S2 school is located in downtown Seoul south of the Han River and has an express bus terminal, an interchange, and roads with 8 or more lanes within a 300 m radius of the school. It is generally exposed to high traffic volume as well as large buses in the nearby express bus terminal, and idling vehicles are common in the area. While having the highest traffic volume, it is about 100 m from major roads, has a green zone between roads and the school, and is located in a large-scale apartment complex (Fig. 1A). The S3 school is located in downtown Incheon in the outskirts of Seoul, and has Incheon's second international passenger airport terminal and a distribution center within a 500 m radius of the school, as well as a gas station within 50 m from its front gate (noise barrier installed near roadside) (Fig. 1A). Compared other schools, its adjacent roads have more heavy-duty vehicles and cargo traffic (Table 1).
Complex source zones I (S4, S5)
The S4 school is located in the north of downtown Seoul and although the road in front of the school has low traffic volume (Fig. 1B), it has major sources of pollution: a road with 4 or more lanes nearby, a cement plant, the east main street, and a large-scale distribution center. The S5 school is located in Incheon on the outskirts of Seoul; it has roads with 4 or more lanes around it, and other nearby sources of pollution include the agricultural wholesale market, bus garages, and a number of small-scale factories. To the north of the school is a highway and the Incheon tollgate, but a sound barrier and green zones exist between the highway and the school (Fig. 1B).
Complex source zones II (S6, S7)
The S6 school is located in the port city of Busan and has roads of 4 or more lanes and an industrial complex nearby. It experiences a high traffic volume comprised of heavy-duty vehicles due to its location in an industrial complex (Table 1), and the river nearby had a foul odor at the time of measurement. Exposure to traffic and vehicular idling was low due to light traffic volume except during those hours when school starts and ends (Fig. 1C). The S7 school is located in Ulsan, on the outskirts of Busan, and has roads with 4 or more lanes nearby and a bus stop about 100 m from the school's front gate. It is in the representative industrial complex and is near (within 100 m) a large-scale automobile manufacturing plant, an area where commercial facilities and residential areas coexist (Fig. 1C). Its exposure to traffic and vehicular idling is low except during those hours when school starts and ends.
Experimental methods
The investigation to determine the level of environmental pollutants in school zones was conducted at 14 school zone sites for seven schools for the total of 10 hours (07:30–17:30) per site between June 19 and October 25 in 2012 (excluding summer vacation). PM10, SO2, NO2, and O3 (average minute measurements) were measured at one site on the road around the front gate and at sites on the playground in each school. BC (average of minute measurements) was measured at two sites in classrooms on lower and higher floors (2nd and 4th floors). The method used to measure PM10 was the β-ray absorption method (TAPI, Beta-Attenuation Mass Monitor, Model BAM1020), which traps on filter paper any particulate matter under 10 µm floating in the atmosphere for 10 hours, and which then passes β-rays through it and calculates the weight concentration of the particulate matter. The method used to measure SO2 (sulfur dioxide) was the UV fluorescence method (TAPI, UV Fluorescence Analyzer, Model 100E), which measures sulfur dioxide concentration in the sample atmosphere by measuring the intensity of the fluorescent light emitted from sulfur dioxide excited by short-wavelength ultraviolet light. The method to measure NO2 (TAPI, Chemiluminescence Analyzer, Model 200E) was the chemiluminescence assay, which converts nitrogen dioxide into nitric oxide with a converter and measures the nitric oxide concentration in the sampled atmosphere, using the fact that the chemiluminescence created when NO2 is generated by reacting with ozone is proportional to nitric oxide concentration. The method used to measure CO (Gas Filter Correlation CO Analyzer-Model 300E) was non-dispersive infrared spectrometry, which measures carbon monoxide in the atmosphere with a non-dispersive type infrared gas analyzer using optical absorption of carbon monoxide in the infrared region. The method used to measure O3 (TAPI, UV Absorption Analyzer, Model 400E) was the UV absorption method, which repeatedly measures ozone concentration in the atmosphere by measuring the change in absorption of UV waves measuring around 254 nm in wavelength. BC concentration was measured using a portable aethalometer (model AE42-7-ER-MC, Magee Scientific) that converts the degree to which light from seven wavelengths (370, 470, 520, 590, 660, 880, 950 nm) is attenuated by particles collected by the quartz filter into a concentrated mass by wavelength.1 Then a single wavelength infrared light (880 nm) of known intensity is directed onto the collection area.2326
ISAAC questionnaire
The assessment of asthma and allergic diseases was based on survey questions with verified reliability and validity using the ISAAC, and all questionnaires were completed by parents and students together.17192728 The survey was distributed to 5567 students between the 2nd and 6th grades in seven schools which participated in the study between July and October 2012, and 4404 surveys were returned and analyzed (81.3% return rate). The 1st grade was excluded from the study, due to the short period of their exposure on the way to school and to school life. ISAAC was validated and used to identify children currently suffering from symptoms of asthma. In this study, prevalent wheezing is defined as a history of at least 1 attack of wheezing during the last 12 months. We also asked whether students had ever been diagnosed by a doctor with asthma and been treated for asthma in last 12 months. We asked similar questions about eczema, allergic rhinitis, and allergic conjunctivitis.1
The data from the automatic monitoring system installed at applicable schools is not representative of all schools because the data was obtained by remote monitoring. Therefore, the results were always derived from two locations (main road and entrance) selected as representative locations. We obtained the ORs of allergic diseases related to air pollution after adjusting for individual-level risk factors. We calculated adjusted ORs for a change in measured pollution concentration equal to the interquartile ranges of the pollution distribution.1
The study protocol was approved by the Institutional Review Board of Severance Hospital, Yonsei University Health System (4-2013-0450).
Statistical methods
Dependent variables were lifetime symptoms and symptoms and treatments over the past 12 months for asthma, allergic rhinitis, and atopic dermatitis, each identified by the questionnaires. Personal characteristics and the known allergic disease risk factors (age, gender, household income, exposure to secondhand smoking, type of residence, home built year, leak status, etc.) were designated as potential confounding variables. To investigate the association between allergic diseases and air pollutants, the air pollution concentration measured for each school was divided into four ranges. The results are presented as ORs with 95% confidence intervals (Cls). We obtained the ORs of allergic diseases related to air pollution by adjusting for individual-level risk factors. We calculated adjusted ORs for a change in measured pollution concentration equal to the interquartile ranges of the pollution distribution. Statistically, significance was provided by a p-value<0.05. All statistical analyses were performed using PASW (Predictive Analytics SoftWare), version 20.0 (IBM, Armonk, NY, USA).
RESULTS
Traffic status prior to study
In order to categorize the schools, including the traffic-related zone schools, traffic volumes on the major roads and commuting roads nearest the main entrance of each studied primary school were surveyed for 9 hours from 8:00 a.m. to 5:00 p.m. and presented by hour in Table 1.
Three schools in traffic-related zones showed 2–3 times higher traffic volumes than the four complex source zone schools: the S2 school located south of the Han River and near an express bus terminal, an interchange, and roads with 8 or more lanes showed the highest traffic volume with 32092 vehicles, followed by the S3 school located in downtown Incheon. The school with the 3rd highest traffic volume was the S1 school located in midtown Seoul north of the Han River, and is near a road with 8 or more lanes and has a beltway in front of the school. In contrast, the aggregate statistics showed that the school with the lowest traffic volume was the S5 school located in Incheon, but this conclusion is not based on comprehensive aggregate statistics that include local highway traffic data.
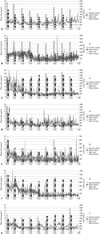
The survey of hourly traffic volume showed that traffic volume peaked during 8:00–9:00 a.m. in most sites, and the traffic volume between 12:00–5:00 p.m., during which elementary school ends, varied among schools (Fig. 2). In terms of traffic volume on major roads and major commuting routes, general passenger vehicles were most common, followed by diesel-fueled SUVs or small trucks.
Measurements of air pollution
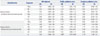
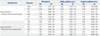
The level of air pollution around elementary schools in the study is shown in Table 2.
Results showed that PM10 (average of minutely measurements) was at its highest with 53.0 µg/m3 (main road 60.9 and main entrance 45.1 µg/m3) in the traffic-related zone (school 2 with an express bus terminal existing nearby), and BC (average of minutely measurements) was at its highest with 6.34 µg/m3 (main road 7.34 and main entrance 5.34 µg/m3) at the school (S3) with the most truck traffic among traffic-related zone schools. The average of all seven schools in SO2, NO2, CO, and O3 (average of minutely measurements) was 0.005 ppm (main road 0.009 and main entrance 0.01 ppm), 0.024 ppm (main road 0.018 and main entrance 0.021 ppm), 0.40 ppm (main road 0.37 and main entrance 0.33 ppm), and 0.025 ppm (main road 0.03 and main entrance 0.025 ppm), respectively, with no significant differences among schools. SO2 concentration levels were in the range of 0.002–0.007 ppm, which is lower than the Korean Air Quality Standard of 0.05 ppm (24 hour basis). NO2 concentration was close to the Air Quality Standard of 0.06 ppm (24 hour basis), and CO was 10 times lower than the Air Quality Standard of 9 ppm (24 hour basis).
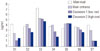
The results of BC measurement by school showed the highest concentration of 7.34 µg/m3 at the main road in the S3 school zone, which is located in downtown Incheon of the Seoul Metropolitan area and has the highest traffic volume. As shown in Table 1, this was where overall traffic was high and the truck traffic in the morning (8:00 a.m.–12:00 p.m.) was the highest among schools. The average BC concentrations for the six other schools were in the range of 3.41–5.34 µg/m3. The measurement obtained at main entrances at the same time has the highest concentration of 5.34 µg/m3 at S3, which also has the highest concentration on the main road (school zone), as well as the highest concentration of BC in classrooms (lower and higher floors classrooms: 5.24–4.76 µg/m3) among the seven schools, indicating that BC generated on the major roads in front of the school contaminates playgrounds and indoor spaces, i.e., classrooms. The average concentration of BC by site for the seven schools was found to be high in the following order: main road (school zone)>main entrance>class-room-lower floor (2nd)>classroom-higher floor (4th) (Fig. 3). The results for BC concentration distribution of the seven schools measured hourly show the highest concentrations during morning rush hours, i.e., the hour when children go to school (8:00–9:00 a.m.) (Fig. 2).
Questionnaire data
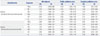
Of the total of 4524 subjects from the seven schools who returned questionnaires, the results of 4404 subjects, after 120 questionnaires with missing responses were excluded, are shown in Table 3. The questionnaires revealed that female children constituted 50.7%, and apartment residences were 79.6% followed by townhouses, 13.0%. Children exposed to secondhand smoke were 20.2%. Concerning the age of the residential buildings, those 10–20 years old constituted 33.6%, while newly built residences constituted 4.0%. 12.9% of students had experienced leaks in their homes within the last 3 years.
Subjects with lifetime symptoms of asthma, allergic rhinitis, and atopic dermatitis were 10.5%, 35.1%, and 21.7% of the group, respectively, and the examination by school characteristics showed that the school in complex source zones in metropolitan areas showed somewhat higher frequencies. The prevalence of asthma, allergic rhinitis, and atopic dermatitis within the last year was 3.4%, 30.9%, and 15.3%, respectively.
Associations between air pollution and allergic diseases
In order to determine the associations between air pollution level at subjects' schools and symptoms of asthma, allergic rhinitis, and atopic dermatitis, a regression model was provided with health effect indicators adjusted for age, gender, exposure to secondhand smoke, household income, type of residence, age of residence, and indoor leak status (Table 4, 5, and 6). The exposure assessment of air pollution emitted by local traffic was based on conclusions drawn from complex-pollution areas I and II.
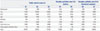
In the case of asthma, the OR of asthma symptoms experienced during the past 12 months increased at a statistically significant level (p<0.05) with SO2 (1.53, 95% CIs 1.00–2.34) in traffic-related zones. Although not statistically significant, the OR increased by 1.35 (95% CIs 0.80–2.30) per 2.8 µg/m3 increase of BC, by 1.32 (95% CIs 0.96–1.81) per 1.32 ppm increase of NO2, and by 1.15 (95% CIs 0.95–1.40) per 0.010 ppm increase of O3, which indicates positive associations.
In particular, in the case of complex source zones, asthma symptoms experienced during the past 12 months were positively correlated with all of the surveyed pollutants. The last 12-month treatment experience showed that the OR at complex source zones increased at a statistically significant level (p<0.05) due to the exposure to NO2 (1.67, 95% CIs 1.03–2.71). Although not statistically significant, positive associations with BC, SO2, and O3 were found in all subjects. As a result, in all subjects without zonal classification based on pollutant characteristics, asthma symptoms and treatment experience showed a positive association with BC, SO2, NO2, and O3 exposure (Table 4).
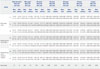
The major findings on symptoms associated with allergic rhinitis are shown in Table 5. As for allergic rhinitis, in all subjects without zonal classification based on pollutant characteristics, symptoms experienced during the past 12 month showed positive although not statistically significant associations with PM10, BC, SO2, and O2 (Table 5). In all subjects without zonal classification based on pollutant characteristics, the allergic rhinitis-related treatment experienced during the past 12 months showed a significant increase in ORs for BC (1.60, 95% CIs 1.36–1.90) (p<0.001), SO2 (1.09, 95% CIs 1.01–1.17) (p<0.05), NO2 (1.18, 95% CIs 1.07–1.30) (p<0.01). Although not statistically significant, the positive associations also existed with PM10 and O3. In particular, BC and O3 were found to have positive associations when the traffic-related zones and complex source zones were analyzed separately (Table 5).
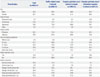
The major findings related to atopic dermatitis are shown in Table 6. In the case of atopic dermatitis, symptoms experienced during the past 12 months in all subjects without zonal classification based on pollutant characteristics showed a statistically significant increase in the ORs of 1.14 (95% CIs 1.00–1.30) (p<0.05) per 0.01 ppm increase in O3. Positive associations were also found for SO2 and NO2, although these too were not statistically significant. In the treatment of atopic dermatitis experienced during the past 12 months in all subjects without zonal classification based on pollutant characteristics, positive associations were found for BC, SO2, NO2, and O3. In particular, the complex source zones showed a statistically significant increase in the OR, of 1.21 (95% CIs 1.02–1.46) (p<0.05) per 0.01 ppm increase in NO2.
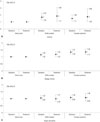
In order to evaluate the associations with allergic disease, the seven schools investigated by Kim, et al.1 and the seven schools investigated in this study were integrated and evaluated (Fig. 4). The 14 schools were categorized into traffic-related zone schools and complex source zone schools using the home town zone (S1) studied in Kim, et al.1 as the criterion, and the ORs of the symptoms and the treatments for asthma, allergic rhinitis, and atopic dermatitis experienced during the past 12 months were integratively compared.
For asthma, the symptoms experienced during the past 12 months showed an increase in traffic-related zone schools (OR=1.06, 95% CIs 0.73–1.53) and complex source zone schools (OR=1.04, 95% CIs 0.72–1.50), compared to children in S1 schools. The treatment experience during the past 12 months showed a higher risk in traffic-related schools (OR=1.84, 95% CIs 1.11–3.05) and complex pollutant schools (OR=1.74, 95% CIs 1.05–2.89), compared with the treatment experience of children in the S1 school (Fig. 4A). In the case of allergic rhinitis, the treatment experienced during the past 12 months showed a higher risk among children in traffic-related schools (OR=1.17, 95% CIs 1.02–1.35) and in complex source schools (OR=1.34, 95% CIs 1.16–1.55) compared with children from the S1 school (Fig. 4B). In the case of atopic dermatitis, the symptoms experienced during the past 12 months showed a higher risk among children in traffic-related schools (OR=1.06, 95% CIs 0.92–1.22) and complex source schools (OR=1.08, 95% CIs 0.94–1.25) compared to children in the S1 school (Fig. 4C).
DISCUSSION
The present study showed that traffic-related and other pollutants around primary school areas are associated with increased risks of allergic diseases among elementary school students. The average PM10 concentration around schools in this study peaked at 53.0 µg/m3 in traffic-related zone schools (school 2 has an express bus terminal nearby) and exceeded the standard value that the World Health Organization (WHO) recommends (AQG value, 24 h 50 µg/m3/WHO AQG value, 24 h 50 µg/m3). In comparison with Kim, et al.,1 it was highest with 67.9 µg/m3 at S2 where traffic pollutants exist (bus lanes). The measured results of PM10 using beta-ray could be overestimated or underestimated due to environmental conditions such as road moisture.29
The averages of the seven schools for SO2 (EPA standard 24 h 0.14 ppm/WHO AQG value, 24 h 20 µg/m3), NO2 (EPA standard, 1 h 100 ppb, 188 µg/m3/WHO AQG value, 1 h 200 µg/m3), CO (EPA standard, 8 h 9 ppm), and O3 (EPA standard, 8 h 0.075 ppm) were 0.005 ppm, 0.024 ppm, 0.40 ppm, and 0.025 ppm respectively, each of which is below the standard value set by the EPA/WHO, and each of which is similar to the seven schools studied by Kim, et al.1
Among traffic-related zone schools, BC was highest, at 7.34 µg/m3, in the school with highest truck traffic (S3). In the results, the schools in industrial complexes showed higher BC levels than at S2, S3, and S4, as demonstrated by the 6.91 µg/m3 and 10.98 µg/m3 average measurements for the two schools in industrial complexes (S5, S6, respectively).1 In addition, the S2 and S3 category schools are located in traffic-related pollution areas, including downtown Seoul. The S4 school is located near the Daejeon IC where the Gyeongbu Express Highway is in school back and where bus garages and a residential area are located. One of the complex pollution areas located in the S5 school in the Nan-dong industrial complex is 100 meter away. S6 school is located in the city of Siheung City, Gyeonggi-do, is the only industry within 300 meters.
Also, the level was high during 8–9 a.m. rush hours, i.e., when students go to school, and the results of Cheng, et al.18 also showed BC concentrations peaked during 7:00–9:00 a.m. and 4:00–6:00 p.m. However, traffic volume also differs according to the day of the week because of general air pollution. So, we measured the effect of general air pollution on all schools by taking into account the traffic count on Monday or Friday. This was necessary because air conditions and vehicle emissions were not clearly distinguished from one another, and our study failed to show the influence of common air pollutants.
In Cheng, et al.,18 the BC level was closely related to traffic volume, especially in the morning rush hours. Most elementary schools are located on main roads for traffic convenience, and morning rush hours are identical with the hours when school students come to and leave school (8:00 a.m.–9:00 a.m.). Hence, BC exposure occurs directly and indirectly in school zones, playgrounds, and classrooms. In Korean school zones, people are encouraged to drive less than 30 km/hour on roads located within 500 m of schools.1 In addition, the BC concentration was higher in the schools where the distance between major roads and school is short and the concentration was lower at the locations farther from major roads. It was also found that BC generated on adjacent roads enters classrooms, where children are exposed. BC aerosol is a substance emitted from the incomplete combustion of fossil fuel and traffic in the urban environment, and transportation is the leading contributor to BC emissions in downtown areas.18,30,31 Reche, et al.32 reported that the BC concentration levels in downtowns and background concentration levels in six European cities were 0.7–1.9 µg/m3. The average concentration of 3.70–7.34 µg/m3 in school zones adjacent to major roads and the average playground concentration of 2.46–5.34 µg/m3 among the seven schools in the present study were estimated to be comparable to the concentration level in the downtown area in Reche, et al.32 Importantly, the BC concentration measured indoors is higher than the background concentration level suggested by Reche, et al.,32 with a concentration of 1.01–5.24 µg/m3 in classrooms on lower floors (2nd floor) and of 1.03–4.76 µg/m3 in classrooms on higher floors (4th floor). Such school environments are expected to increase the potential for allergic disease. Diesel particles have been shown to enhance inflammatory reactions and sensitisation.33 However, this study is limited by short-term measurements, i.e., measurements over one day per site (one on the road in the school zone near the front gate and one on the playground), providing data for only two days per school.
In this study, the results on the association between allergic disease of elementary school students and major air pollutants such as BC in seven schools showed that ORs significantly increased (p<0.05) with SO2 for the symptoms experienced during the past 12 months in traffic-related zones, and likewise increased with NO2 in the treatment history during the past 12 months in complex source zones. BC levels showed positive associations are not significant. The similar study by Kim, et al.1 had no air pollutants that showed a statistically significant association with asthma in asthma symptoms and treatment experienced during the past 12 months, but they showed positive associations with, BC, PM10, and SO2. Gruzieva, et al.29 conducted a study on the association between exposure to traffic-related air pollution and asthma, and reported an association of 2.0 (95% CIs 1.1–3.5) with PM10 exposure among 8–12 year old children, which was similar with NOx as well. In the present study, the association with PM10 was not present, but the association with NO2. The Taiwanese study of Lee, et al.34 reported an association between asthma in children and NO2 (1.42, 95% CIs 1.21–1.66), but some studies including Peters, et al.35 reported no association between exposure to PM10 and NO2 and children's asthma symptoms. In Table 4, the children have more asthma symptoms related to SO2, but they showed an increase in treatment related to NO2. One conclusion drawn by Liu, et al.22 is that the association of SO2 and NO2 concentrations to the prevalence of respiratory symptoms is statistically significant among girls but not among boys. In our study, this was not confirmed, so it warrants further study.
In the case of allergic rhinitis, the ORs increased significantly in all subjects in their treatment histories of the past 12 months with exposure to BC, SO2, and NO2 (p<0.01). Kim, et al.1 showed that the OR for the history of allergic rhinitis treatment during the past 12 months increased significantly with exposure to BC and SO2, results which are similar to the findings of the present study. In Annesi-Maesano, et al.,36 although not statistically significant, positive associations were reported between allergic rhinitis among primary school children and PM2.5 1.09 (95% CIs 0.93–1.27), NO2 1.08 (95% CIs 0.92–1.27). For atopic dermatitis, the odds that symptoms were experienced during the past 12 months increased by 1.14 (95% CIs 1.00–1.30) per 0.01 ppm increase in O3 in all subjects, at a statistically significant level (p<0.05). In Kim, et al.1 similar results were obtained: the OR for atopic dermatitis symptoms increased with O3 at a statistically significant level. Table 5 shows that children experience a decrease in the need for therapy related to allergic rhinitis in traffic polluted areas compared to complex pollution areas with respect to NO2 and O3. Misinterpretation of data is often an issue in studies in which allergic rhinitis and asthma are assessed through parental questionnaires, particularly in young children who have less distinctive symptoms.
It is important to note that children only spend a fraction of their school hours in the classroom, and move between classrooms and visit playgrounds and other locations within their schools. In addition, none of these studies mention any associations between exposure and daily activity pattern at school,37 nor do they study the toxicological associations with indoor and outdoor levels.17 In studies on pollutants, results can vary significantly depending on research scale, design, materials measured, measurement instrument, long-term and short-term measurement period, monitoring site and method.19,22
This study is an annual study by Kim, et al.1 It is a significant case study focusing on major metropolitan cities. The strength of this study is thought to be the presentation of the results that simultaneously assessed the air quality on major roads near schools and inside classrooms and compared them, which has never been attempted in previous studies. In addition, in order to evaluate the connection of air quality to allergic disease, the seven schools investigated in Kim, et al.1 and the seven schools investigated in this study were integrated and evaluated. A total of 4545 students was assessed for allergic diseases. Three school zones with critical exposure were selected withn each school and they were evaluated according to the levels of BC, PM10, SO2, NO2, and O3. The result is similar to that found by Kim, et al.,1 which had an identical research design. For the reasons determined in the previous study, the results were used to represent the spatial distribution of air quality levels around the primary school and in adjacent areas during school hours in the Korean case study.
However, in these studies, measuring changes in air quality at schools is extremely important.37 In terms of assessing the environmental pollution of the seven elementary schools included in the present study, it would be ideal to use automatic monitoring data from installations in respective school areas, but such data is provided from sites a few dozen kilometers away, so their data cannot reflect the state of air pollution around the seven schools.1 Therefore, this study selected two sites that can fairly represent school air quality, and obtained representative data using automatic measuring vehicles. However, this study is limited by the short measurement period per site. As well, our study findings are limited by the short measuring period (2 days) per school. The study should at least have performed longer sampling periods and used a fixed between-site effect to correct the temporal variability due to the fact that sampling was performed simultaneously at all locations.1 The levels of the pollutants in the ambient atmosphere could be influenced by the climate conditions (seasonal variations) such as wind speeds and directions.2,13 However, the pollution levels in the studied cities have been sO3 during the last years, suggesting that emissions of pollutant evaluated in this study may not have changed much.
This study shows the results of 7 schools tested by an autonomous measuring vehicle. In this sense, there is a fundamental limit insofar as air pollution was evaluated every other day during the 5 month period. We revised the annual regional average concentration for exposure of air pollution during long periods in relevant areas. However, we decided that each material concentration did not affect the outcomes because variations in each material concentration were insignificant. The study also has a fundamental limitation because data were not obtained in the seven primary schools during the same period simultaneously, although weather conditions such as temperature and relative humidity were very similar in each school.
Furthermore, this study has the limitation of all cross-sectional studies; therefore, a causal inference cannot be made, and a comprehensive assessment of the residence and residential environment where most of the day is spent was not made.19 Also, this study has a limitation because factors such as genetic influences, climate, diet, body mass index and social cultural factors that are known to influence allergic diseases were not considered.1,17,36,38
Finally, the survey responses in this study showed that children whose parents smoke, i.e., children exposed to indirect smoking, accounted for 20.2% of all subjects, which is believed to affect the odds of allergic disease. Also, 24.9% were found to be exposed to indirect smoking at home.1 Although some studies have reported no association between indirect smoking and respiratory symptoms such as asthma, other studies have shown an association.22,39,40,41,42
In recent studies, concerns have been raised about the association between students' allergic diseases such as asthma and air pollution around elementary schools. BC, PM, NO2, SO2, and O3 have been mostly mentioned as hazardous materials, and vehicles are known as major contributing sources of these substances. Therefore, this study attempted to assess the association between the elementary school students' history of symptoms and treatments of asthma, allergic rhinitis, and atopic dermatitis and the distribution of the previously mentioned and exposed hazardous substances in seven schools.
The study results showed that risk increased significantly with SO2 exposure in traffic-related zones in the history of asthma symptoms, and with NO2 exposure in complex source zones in the treatment history of asthma. As for the history of allergic rhinitis treatment, risk increased significantly due to BC and NO2 exposure in all subjects, and as for the history of atopic dermatitis symptoms, the risk increased significantly with O3 exposure in all subjects. According to the results of the evaluation of the integrated data between the seven schools in Kim, et al.1 and the seven schools in the present study, in the history of symptoms during the past 12 months, the risk of asthma, allergic rhinitis, and atopic dermatitis was higher among children in schools in traffic-related zones and complex source zones compared to the risks experienced by children in the school in the control group (S1). However, in our study, changes in environmental exposures may have resulted in bias.22 Our air pollutant measurements were only available for a limited time period (2 days), so it may not be representative of the schools. Previous studies made the same point.2,29 In addition, although air pollutant levels were measured during the study period, we did not include air pollutant data in the analysis as we did not have school-based measurements.
Therefore, care and prevention measures must be given to spaces used in coming to and leaving schools, as well as in playgrounds and classrooms, to ensure not only the safety of children from traffic accidents but also to ensure their protection from nearby traffic pollutants and various hazardous materials.
This study used logistic regression between six air pollutants (average of seven schools' air pollutant concentration) and the allergy disease status of all students of all schools. Thus, there is an ecological fallacy. In other words, this study has some limits as cross-section research in that the measurement of allergy levels involved a subjective point of view and air pollutant concentrations were measured at particular schools. However, we confirm that Table 4, 5, and 6 satisfy the Hosmer-Lemeshow goodness of fit test (p>0.05).
Finally, this study has another limit: it leaves uncertain the relationship between air pollution concentration and allergy severity. From now on, we expect to remedy the limits since this study will use lag time as analysis of reason variable about the past.
 XML Download