

 PDF
PDF ePub
ePub Citation
 Print
Print


INTRODUCTION
The most common sources of metal pollution are mines, smelters, and atmospheric dispersion (1). In addition to polluting the environment, heavy metals are known to induce adverse health effects in people living in polluted areas. Previous studies have reported smelters in Mexico (23), the United States of America (4), and Chile (5), giving off fumes containing sufficient arsenic (As), lead (Pb), and cadmium (Cd) to make long-term health management necessary for nearby residents.
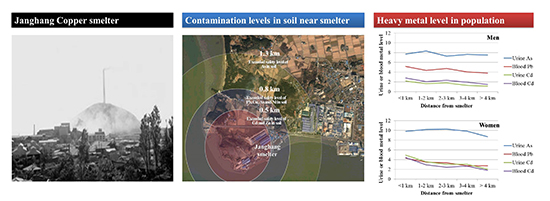
Metallic elements such as As, Cd, Pb, manganese (Mn), and mercury (Hg) that occur together with copper (Cu) in copper ore are released during refinement in the form of vapor and particulate matter (6). The Janghang Copper Refinery was established in 1936 in the town of Janghang in Seocheon County, Chungnam Province, Republic of Korea, and smelted Cu, Pb, and tin (Sn) until 1989. While it was operational, pollutants produced from the smelting process contaminated the soil and water surrounding the refinery. A detailed soil investigation by the Chungnam Province Institute of Health and Environmental Research found that the concentration of zinc (Zn) and Cd exceeded safety thresholds within a 500-m radius of the refinery, while those of Pb, Cu, As, and nickel (Ni) exceeded safety thresholds within an 800-m radius. Crops harvested near the smelter were also polluted by heavy metals. According to a study published in 2011, the safety limit for Pb residue in crops was exceeded in 4 out of 10 areas around the smelter (7). In some areas, the Cd concentration in rice was higher than the human tolerance limit, forcing complete destruction of the harvested crop and banning of cultivation in those areas. However, no previous study has evaluated levels of exposure to toxic metals in residents of the area around the smelter.
This study was conducted to determine exposure to toxic metals and resulting health effects in people living near the smelter and to test if the smelter is a major source of high toxic metal exposure in the residents near Janghang smelter.
MATERIALS AND METHODS
Participants
The study participants included people aged 30 years or older who had been living within 4 km of the Janghang Copper Refinery (exposed group) and people with similar ages and lifestyles living in a rural area of Seocheon County located approximately 15 km from the refinery (control group). Individuals were given information about the purpose of this study, and those who wished to participate provided written consent. Face-to-face interviews were conducted by experienced interviewers using a structured questionnaire that included demographic questions, as well as questions on history of smoking, alcohol consumption, and work history. Of 985 prospective participants (exposed group 572, control group 413), 185 people had worked in jobs exposing them to heavy metals, such as refinery or mining work. Participants were divided into four exposed groups based on their place of residence from the smelter: E1 group for < 1 km, E2 for 1–2 km, E3 for 2–3 km, and E4 for 3–4 km from the smelter, respectively. The control group included subjects who lived over 15 km away from the smelter. Participants gave fasting blood and urine samples in the morning, and samples were stored at -80°C until the day of analysis.
Determination of toxic metal levels in biological samples
We quantified the concentrations of Pb and Cd in blood and those of urinary As and Cd. Pb in blood was determined using a polarized Zeeman atomic absorption spectrophotometer (Model Z-2700, Hitachi, Tokyo, Japan). Determination of Cd in blood and urine was performed with a flameless atomic absorption spectrophotometer (Model Z-8270, Hitachi) equipped with a Zeeman graphite furnace. Briefly, blood or urine was added to nitric acid and diluted with diammonium hydrogen phosphate and 1% Triton X-100, followed by vigorous mixing. The detection limits were 0.059 µg/dL for blood Pb, 0.02 µg/L for blood Cd, and 0.01 µg/L for urinary Cd.
Total As concentration in urine was analyzed using an atomic absorption spectrometer (Model 5100, PerkinElmer, Waltham, MA, USA) coupled with a hydride generation system (FIAS-400, PerkinElmer). Briefly, each urine sample was mixed with hydrochloric acid (HCl), ascorbic acid, and potassium iodide in a ratio of 2:2:1:1; the mixture was then incubated for 1 hour, followed by dilution with 10% HCl. Reducing agents were 0.2% sodium borohydride and 0.5% sodium hydroxide; the mobile phase was 3% HCl, and argon (Ar) was used as the carrier gas. The detection limit of this method was 0.2 µg/L.
For samples with concentrations of an element below the limit of detection, we recorded the concentration as the limit of detection divided by the square root of 2 (8).
Determination of N-acetyl-β-d-glucosaminidase activity
The activity of N-acetyl-β-d-glucosaminidase (NAG) was measured using a reaction in which sodium m-cresolsulfonephthaleinyl N-acetyl-β-d-glucosaminide was hydrolyzed to N-acetyl-β-d-glucosaminide and m-cresolsulfonephthalein by NAG. Quantitative analysis of NAG activity was performed using a commercial kit (Shionogi, Osaka, Japan) following the manufacturer’s protocol. In brief, a synthetic substrate solution (1 mL) was incubated at 37°C for 5 minutes. The supernatant of the urine samples (50 mL), obtained by centrifugation, was mixed with a warm synthetic substrate solution, and the mixture was then incubated in a 37°C water bath for 15 minutes. The stopping solution (2 mL) was then added and mixed thoroughly.
The absorbance of the samples and NAG standard solution were measured at wavelengths of 580 nm, using a spectrophotometer. Urinary NAG activity, measured in U/L, was normalized to urine creatinine levels to obtain U/g creatinine.
Determination of bone mineral density
Measurement of bone mineral density (BMD) was performed with an ultrasound bone densitometer (Osteopro; BMtech, Seongnam, Korea) on the right calcaneus. The coefficient of variation, a marker of the precision of measurement, was below 1%. The apparatus was calibrated every day for quality assurance. A single experienced operator conducted all measurements. For statistical analysis, we used Z-score, which is the comparison to the age-matched normal distribution of calcaneal bone mineral distribution.
Statistical analyses
Statistical analyses were performed using Statistical Package for the Social Sciences (SPSS) version 21.0 (IBM, Armonk, NY, USA). All data on heavy metal levels were transformed to a log-normal distribution, as distribution was skewed. Differences in demographic factors among groups were compared using the chi-square test. Statistical comparisons of means were performed using analysis of variance (ANOVA) with Duncan as a post-hoc analysis, and multiple linear regression analysis was applied to test relationships between variables. Statistical significance was set at P < 0.05.
RESULTS
The mean age of participants in exposed subgroups and the control group are shown in Table 1. The mean age of subjects in the E4 group was significantly lower than those of the other groups (ANOVA with Duncan analysis; P < 0.001). The mean duration of residence at the present living site in E3 and E4 groups were significantly shorter than in other groups (P = 0.002). There was no difference in gender and smoking or drinking status among groups (Table 1). Correlation coefficients between metals showed wide range from 0.066 to 0.539, although all cases were statistically significant (urinary As vs. blood Pb, blood Cd and urinary Cd: 0.109, 0.066, and 0.539, respectively; blood Pb vs. blood Cd and urinary Cd: 0.278 and 0.169, respectively; blood Cd vs. urinary Cd: 0.488) (data not shown).
Table 1
Characteristics of 985 subjects of this study
*Different group by Duncan analysis followed by ANOVA, E4 group vs. other groups; †Different group by Duncan analysis followed by ANOVA, E3 and E4 groups vs. other groups; ‡
P by chi-square test for trend; §Defined as smoking > 20 pack-years for lifetime; ‖Different group by Duncan analysis followed by ANOVA, E1 group vs. E2 and E3 groups vs. E4 group vs. control group; ¶Different group by Duncan analysis followed by ANOVA, E1 group vs. E2, E3 and E4 groups vs. control group; **Different group by Duncan analysis followed by ANOVA, E1 vs. E2 and E3 vs. E4 and control group.
![]()
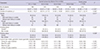
Fig. 1 and 2 show blood and urinary concentrations of toxic metals, which were adjusted for duration of residence, smoking status, and alcohol consumption to account for confounders, according to occupational history in the smelter and gender.
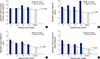 | Fig. 1Duration of residence, smoking status, and alcohol consumption adjusted geometric means of urinary arsenics (A), blood lead (B), blood cadmium (C) and urinary cadmium (D) according to distance of residence from Janghang smelter in men. Trend lines indicate linear decrease among subjects without a working history in the smelter.
|
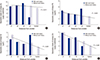 | Fig. 2Duration of residence, smoking status, and alcohol consumption adjusted geometric means of urinary arsenics (A), blood lead (B), blood cadmium (C) and urinary cadmium (D) according to distance of residence from Janghang smelter in women. Trend lines indicate linear decrease among subjects without a working history in the smelter.
|
In men, the mean urinary As concentration was similar in all groups, including the control group, regardless of a working history in the smelter or mines. There was no correlation of urinary As according to subgroup. A similar trend was found in women except E3 and E4 groups have only one person respectively.
For men with a history of working in the smelter, the mean blood Pb concentration was highest in the E4 group and the other groups had similar levels. For men without a working history in the smelter, E1 group had the highest blood Pb concentration, followed by E3, E2 and E4 group, respectively. The control group had the lowest level of blood Pb concentration. A similar trend was shown in female subjects, although it was higher in men than in women in all groups. The blood Pb concentration showed a significant inverse association with residential distance from the smelter in subjects without a working history in both sexes (P < 0.001 in both sexes).
The mean blood Cd concentration was highest in E1 group, with a working history in men among all groups, and was the lowest in the control group. Subjects with a working history showed higher blood Cd concentrations than those without a working history in every group. The blood Cd concentration also showed a significant decrease with residential distance from the smelter in subjects without a working history in both sexes. In women, although blood Cd concentration was not higher in subjects with a working history, there was a correlation of blood Cd with residential distance in subjects without working history (P < 0.001). In all groups, the level of Cd was higher in women than in men. A similar trend was shown in women, but there was no difference of blood Cd concentration according to working history in women. The urinary Cd levels showed similar trends with blood Cd levels in both sexes.
We performed multiple linear regression analysis to find determinants for As, Pb, and Cd levels. In the model, age, sex, smoking and drinking status, working history in the smelter, and residential distance from the smelter were included as independent factors. Age, sex and the distance from the smelter were significant factors to urinary As levels (Table 2). In the model used for blood Pb, age, sex, drinking status, working history, and distance from the smelter were significant factors (Table 2). For blood Cd, age, sex, and residential distance from the smelter were significant factors in the model used. For urinary Cd, age, sex, working history in the smelter and residential distance from the smelter were significant factors (Table 3).
Table 2
General linear models for urinary As and blood Pb in study subjects

![]()
Table 3
General linear models for blood and urinary Cd in study subjects

![]()
Table 4 shows the average level of urinary NAG and Z-score for BMD in exposed and control groups. Age adjusted levels of urinary NAG were 5.61 ± 0.30 U/g creatinine in exposed groups, and 4.54 ± 0.35 U/g creatinine in the control group. There was a statistically significant difference between the exposed and control groups (P = 0.019). However, the Z-score was -0.06 ± 1.09 in exposed groups, and -0.01 ± 1.23 in the control group, and therefore, there was no difference between groups (P = 0.508).
Table 4
Geometric means and geometric standard deviation of urinary NAG activity and Z-score in calcaneal BMD by groups

| Markers | Exposed group | Control group | P* |
|---|---|---|---|
| Urinary NAG level, U/g creatinine† | 5.61 ± 0.30 | 4.54 ± 0.35 | 0.019 |
| Z-score in BMD | -0.06 ± 1.09 | -0.01 ± 1.23 | 0.508 |
*P by Student’s t-test; †Adjusted with age. NAG, N-acetyl-β-d-glucosaminidase; BMD, bone mineral density.
![]()
Tables 5 and 6 demonstrate determinant factors to influence the level of urinary NAG and Z-score for BMD. In a multiple linear regression model, age and urinary Cd levels were risk factors for increased urinary NAG levels in exposed groups; however, it was not a risk factor in the control group. In the model for the Z-score in calcaneal BMD, the urinary Cd level was significant in the control group only.
Table 5
General linear models for urinary NAG activity by groups

![]()
Table 6
General linear models for Z-score in calcaneal bone mineral density by groups

![]()
DISCUSSION
Smelters are known to be a major source of metal contamination, but there are limited cases in Korea. This study was conducted to assess if people who had been living near the Janghang Copper smelter were exposed to high levels of toxic metals, and if their health was impaired by the smelter. We compared the level of several toxic metals and markers of their effect between people living within 4 km of the smelter (exposed group) and people living over 15 km from the smelter (control group). To evaluate health effects by environmental exposure to toxic metals, we stratified individuals with occupational history in smelters or mines and with residential distance from the smelter. Among the exposed groups, E4 group had a significantly lower mean age, and E3 and E4 groups had a significantly lower mean duration of residence than the control group. Therefore, in this study we used adjusted mean of toxic metal levels with duration of residence in comparison between groups. Smoking and drinking can also result in toxic metal exposure; however, there was no difference between groups in smoking or drinking status.
In the present study, we analyzed total As in urine and showed that urinary As in individuals with a working history in the smelter showed higher value than in those without a working history. The concentration of urinary As had a geometric mean of 9.13 µg/g creatinine (8.39 µg/L) in the exposed groups of this study. Even when the study subjects were residents living near the smelter, the levels of As in the present study were lower than those reported in other heavily contaminated areas, such as Bangladesh, 20.77 μg/L (9); China, 28.30 μg/L (10); Taiwan 20.71 μg/g creatinine (11), but higher than that of the general population in Korea, 7.10 μg/L (12). Although urinary As did not show a decrease according to the distance from the smelter using univariate analysis, which may be due to the element’s short metabolic half-life, multiple linear regression models showed that urinary As levels were significantly inversely associated with the distance from the smelter. This evidence suggests that this smelter might be a major source of As exposure to the population living nearby. Arsenic is a known human carcinogen. In a study of workers in a US copper smelter, there was a positive correlation between exposure to As and kidney and bone cancer (13). Therefore, it is necessary to continuously monitor the health status, including cancer development, of residents living near this smelter.
Blood Pb levels in exposed individuals ranged from 2.74 to 8.57 µg/dL according to sex, distance from the smelter, and working history. These levels were lower than those in children living near a copper-smelter in San Luis, Potosi, Mexico (10.6–14.8 µg/dL according to age) (14). The copper smelter in San Luis was still in operation at the time of the survey, while the Janghang smelter was shut down approximately 13 years prior to the present study. The difference in blood Pb levels between the two smelters might be attributed, in part, to these facts. However, the levels of blood Pb in the present study were higher than those in the Korean general population, 2.61 µg/dL by Korea National Health and Nutrition Examination Survey (KNHANES) III, 2005 (15). In the control participants of this study, the blood Pb level was 3.09 µg/dL. This was also higher than in the Korean general population, possibly because they were older, on average, than the Korean general population. In individuals without a working history at the smelter, blood Pb levels were decreased with increasing distance from the smelter. Additionally, in the multiple linear regression model used, distance from the smelter was a determinant factor of blood Pb levels. This is also evidence to suggest that the Janghang copper smelter was a major contamination source of Pb, as well as As, in the population living near the smelter.
In this study, blood Cd levels in exposed individuals ranged from 1.95 to 4.43 µg/L, according to sex, distance from the smelter, and working history. These levels were higher than those in the Korean general population (1.53 µg/L; KNHANES III, 2005) (15) and were similar with those of retired copper smelter workers in Canada (16). Residents living within 1 km of the smelter (E1 group) showed particularly high blood Cd levels (2.99 µg/L in men and 3.95 µg/L in women). Blood Cd levels decreased with distance from the smelter.
The same trend was observed for urinary Cd levels. In men without a working history in the smelter, urinary Cd levels ranged from 1.26 to 2.15 µg/g creatinine in overall exposed participants, levels higher than that in the control group (1.11 µg/g creatinine). In exposed female residents without a working history in the smelter, urinary Cd, which ranged from 3.05 to 4.93 µg/g creatinine, was higher than in the control group (2.06 µg/g creatinine). These results are in agreement with those of some other studies (217). Soto-Jiménez and Flegal (2) have reported that children living near a smelter complex in Mexico showed higher Cd levels in hair than children in control areas. In a Russian case-control study, schoolchildren living near a copper smelter were reported to have a higher prevalence of incipient renal damage by Cd and Pb exposure than control children (17).
Cadmium measured in whole blood and urine reflects long-term exposure levels to Cd (12). In subjects without an occupational history of working in the smelter, levels of Cd in blood and urine showed a decreasing trend with distance from the smelter, and these results suggest that the people living near the smelter were subjected to significant Cd exposure from contaminated soil, water, and crops at least until cultivation was banned in the area in 2007. Also, it is possible that exposure to these metals has continued even after the cultivation ban via inhalation from contaminated soil near the smelter.
Chronic Cd exposure can give rise to renal tubular dysfunction and bone damage (1819). We measured urinary NAG concentration as a marker of renal tubular dysfunction and BMD for bone damage. In the present study, age adjusted geometric mean of urinary NAG activity was significantly higher in exposed groups than in the control group (P = 0.019). This result is consistent with previous reports that urinary NAG level is a good indicator of Cd-induced renal damage (19). Level of Z-score for BMD showed no significant difference between the exposed and control groups, and in the general linear model used, urinary Cd level was a determinant factor for decreasing Z-scores in the control group only. In this study, we measured mineral density of calcaneus bone with a portable device, which is less precise when compared to dual-energy x-ray absorptiometry (DEXA). In order to accurately assess bone damage caused by Cd exposure, it is necessary to use a precise measurement such as DEXA.
We showed overall exposure levels to several toxic metals in residents living near an abandoned copper smelter in Korea. Although our data cannot clearly link particular health effects of exposure to toxic metals from the smelter, they do show that residents living near this smelter were subject to high degrees of multiple toxic metal exposures.
Although the Janghang Copper Refinery was shut down several decades ago, people living near it are still being exposed to heavy metals. Therefore, people who live near a site contaminated with toxic metals should be advised to make efforts to reduce exposure to environmental contaminants in order to minimize potential health effects and to pay close attention to any health problems possibly related to toxic metal exposure. Fortunately, after this survey was finished, authorities of Chungnam Province and Seocheon County initiated a program to monitor toxic metal exposure and its health effects, which could lead to minimization of further exposure to hazardous metals in this population.
 XML Download