

 PDF
PDF ePub
ePub Citation
 Print
Print


INTRODUCTION
Red cell distribution width (RDW), a measure of variability of red blood cell size, has emerged as a risk predictor in various cardiovascular diseases with increased mortality and morbidity.1234 RDW was a strong predictor for mortality and recurrence of stroke in patients with myocardial infarction, heart failure and stroke. Also, higher RDW values were associated with increased mortality in general population.5
Recently, the role of RDW values was examined in patients with atrial fibrillation (AF) and the general population. Higher RDW values were associated with increased risk of paroxysmal AF development in a population-based cohort.6 Furthermore, elevated RDW values were an independent predictor for long-term adverse clinical outcomes in patients with AF.78 Elevated RDW values were associated with mortality and stroke in patients with AF. Stroke in patients with AF confers increased mortality, morbidity, poor neurologic outcomes and increased medical complications.
Nevertheless, the underlying mechanism between higher RDW values and poor prognoses in patients with AF has been poorly understood. The role of RDW values was limited to the prediction of clinical outcomes in patients with AF. We hypothesized that RDW values might predict the intensity of anticoagulation, resulting in higher adverse events in patients with AF taking warfarin.
MATERIALS AND METHODS
1. Study population
We analyzed 657 patients (69.4±9.8 years old, 428 males) who were diagnosed AF on an electrocardiogram or Holter recording from January 2011 to July 2013. The inclusion criteria were as follows: ≥18 year-old, CHA2DS2-VASc score ≥1, complete measurement of baseline complete blood count (CBC), and warfarin medication as an antithrombotic treatment. The exclusion criteria included patients with valvular heart disease (mitral stenosis with more than moderate severity), prosthetic valves, medication history of other kinds of oral anticoagulants (dabigatran, rivaroxaban, apixaban), concomitant infection, a definitive diagnosis of a hematologic disease, moderate to severe anemia (hemoglobin level <10 g/dL) and a history of blood transfusion within the previous 3 months. The patients were followed for 2 years or until a defined end-point, whichever occurred first. The study was approved by the ethics committee at Chonnam National University Hospital, Gwangju, South Korea (CNUH-2017-053), where informed consent was exempted from enrolled patients because of the retrospective study protocol.
2. Definition
Stroke was defined as a new focal neurologic defect with proof from brain images. Stroke was classified into two categories, ischemic or hemorrhagic, according to etiology. Major bleeding was defined according to the International Society on Thrombosis and Haemostasis (ISTH) criteria, as clinically overt bleeding accompanied by a decrease in the haemoglobin level 2 g/dL or transfusion of at least 2 units of packed red cells, occurring at a critical site, or resulting in death. Myocardial infarction (MI) was diagnosed by the presence of characteristic clinical presentation, serial changes on electrocardiogram suggesting infarction, and increased cardiac enzymes. The primary end-point was defined as the composite event of stroke/systemic embolism and major bleeding. The secondary end-point was defined as the composite of stroke/systemic embolism, major bleeding and death.
The degree of anticoagulation was measured by the international normalized ratio (INR). The intensity of anticoagulation was calculated as the mean time in therapeutic range (TTR) by a modified Rosendaal method of linear interpolation between each pair of measured INR values.9 The TTR was calculated as the portion of days with INR values between 2 and 3. The median frequency of INR measurement was 12 (10–14) times with 49.7 days interval. Optimal anticoagulation was defined as TTR ≥60%.10
3. Statistical analysis
For continuous variables, differences between groups were evaluated using an unpaired t-test or Kruskal-Wallis H test. For discrete variables, differences were expressed as counts and percentages, and were analyzed using a chi-square test (or Fisher's exact) between groups as appropriate.
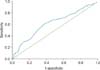
The relationship of baseline RDW with clinical outcomes was analyzed using dichotomous or categorical variables as quartiles: <13.1, 13.1–13.5, 13.6–14.2 and ≥14.3%. T best cut-off value for RDW as a dichotomous variable was 13.6%, determined by the Receiver Operating Curve for the prediction of the primary end-point (area under the curve 0.62, 95% confidence interval [CI] 0.56–0.59, p<0.001, Fig. 1). The relationship between TTR and RDW or clinical outcomes was analyzed using dichotomous or categorical variables: <30, 30–39.9, 40–49.9, 50–59.9, ≥60%. A dichotomous value of TTR was defined as 60% according to optimal intensity of anticoagulation.
Multivariate logistic regression and Cox proportional hazards regression analysis were used to determine independent effects of RDW on the optimal intensity of anticoagulation, and clinical outcomes. All variables considered potentially relevant were entered into the multivariate models: age, sex, hypertension, diabetes mellitus, history of myocardial infarction, heart failure, and stroke or transient ischemic attack (TIA), CHA2DS2-VASc score, and serum level of hemoglobin, creatinine clearance and high-sensitivity C - reactive protein (hs-CRP). We constructed Kaplan-Meier curves for the primary and secondary end-points and the differences among the groups were assessed by the log-rank test.
All statistical analyses were performed using SPSS 18.0 (Statistical Package for the Social Sciences, SPSS-PC Inc, Chicago, Illinois). All analyses were 2-tailed, with a clinical significance defined as values of p<0.05.
RESULTS
1. Clinical characteristics according to red cell distribution width
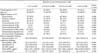
The median and interquartile range of the RDW was 13.6 (13.1–14.3) %. The CHA2DS2-VASc score increased along with the increase of RDW quartiles (2.6±1.6 vs. 2.8±1.6 vs. 2.9±1.7 vs.3.1±1.6, p=0.008). Patients in the highest quartile of RDW were oldest and had more frequent histories of heart failure, high serum levels of N-terminal pro-B-type natriuretic peptide (NT-proBNP), hs-CRP and low haemoglobin, haematocrit, creatinine clearance (Table 1).
2. Clinical outcomes according to red cell distribution width
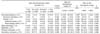
Incidences of thromboembolism and stroke were increased stepwise as RDW quartiles increased with marginal statistical significance. Major bleeding was also increased stepwise as RDW increased quartiles with marginal statistical significance. Mortality was significantly increased with increased RDW quartiles (0.7% vs. 0.6%, 3.3% vs. 5.9%, p=0.001). The primary end-point was significantly increased as RDW quartiles increased (8.1% vs. 7.7%, 11.5% vs. 15.4%, p=0.018). The secondary end-point was also significantly increased as RDW quartiles increased (8.1% vs. 7.7%, 12.6% vs. 18.3%, p=0.002)(Table 2).
3. Clinical outcomes according to red cell distribution width and time in therapeutic range as dichotomous groups
The mean value of INR was 2.2±0.4 and there was no difference between he patients with RDW ≥13.6% and patients with RDW <13.6% (2.2±0.4 vs. 2.2±0.3, p=0.829). However, the proportion of patients satisfying the mean INR of 2.0 to 3.0 was lower in patients with RDW ≥13.6% than patients with RDW <13.6% (61.8% vs. 66.9%, p=0.035).
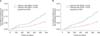
Patients with RDW ≥13.6% developed significantly higher events of thromboembolism (3.3% vs. 6.8%, p=0.037), stroke (3.0% vs. 6.5%, p=0.033), ischemic stroke (2.4% vs. 5.6%, p=0.035), major bleeding (4.8% vs. 9.0%, p=0.032) and mortality (0.6% vs. 5.0%, p=0.001). These resulted in the higher rates of the primary (7.5% vs. 14.3%, p=0.005, log-rank p=0.02, Fig. 2A) and secondary endpoints (7.5% vs. 16.5%, log-rank p<0.001, Fig. 2B) in patients with RDW ≥13.6% (Table 2).
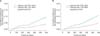
Patients with TTR ≥60% developed fewer events of thromboembolism, stroke, and ischemic stroke with marginal statistical significance. Major bleeding was significantly less common in patients with TTR ≥60% (4.5% vs. 8.3%, p=0.045). Mortality was not different between the 2 groups. The primary (5.2% vs. 11.4%, log-rank p=0.019, Fig. 3A) and secondary end-points (6.0% vs. 12.8%, log-rank p=0.015, Fig. 3B) were significantly lower in patients with TTR ≥60% (Table 2).
Clinical outcomes between the RDW dichotomous groups were assessed according to the achievement of TTR 60%. In patients with TTR <60%, Patients with RDW ≥13.6% developed significantly higher events of thromboembolism (3.6% vs. 7.5%, p=0.038), stroke (3.2% vs. 6.1%, p=0.043), ischemic stroke (2.8% vs. 6.4%, p=0.049), major bleeding (5.6% vs. 9.3%, p=0.074) and mortality (0.4% vs. 5.0%, p=0.001). These resulted in the higher rates of the primary (8.4% vs. 15.3%, p=0.014) and secondary end-points (8.4% vs. 17.4%, p=0.002) in patients with RDW ≥13.6%. In patients with TTR ≥60%, there were no differences in event rates of thromboembolism (2.4% vs. 2.4%, p=0.984), stroke (2.4% vs. 2.4%, p=0.984), ischemic stroke (1.2% vs. 0%, p=1.000), major bleeding (2.4% vs. 5.3%, p=0.198), mortality (1.2% vs. 4.9%, p=0.250), primary (4.8% vs. 7.3%, p=0.683) and secondary end-points (4.8% vs. 9.8%, p=0.437) between the patients with RDW ≥ 13.6% and <13.6%.
4. Relation between red cell distribution width and time in therapeutic range
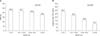
The mean value of TTR was significantly decreased along with the increased RDW quartiles (45.2±21.5% vs. 44.7±20.7% vs. 40.8±19.9% vs. 35.2±20.0%, p<0.001, Fig. 4A). Also, the proportion of patients satisfying TTR ≥60% was significantly decreased along with increase of RDW quartiles (28.7% vs. 23.1% vs. 15.8% vs. 10.7%, p <0.001, Fig. 4B). Conversely, the proportion of patients with RDW <13.6% significantly increased along with increase of TTR values (43.1% vs. 44.5% vs. 46.1% vs. 62.1% vs. 67.2%, p<0.001).
5. Independent impact of red cell distribution width on the intensity of anticoagulation and clinical outcomes
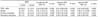
Univariate analysis demonstrated that RDW ≥13.6% was associated significantly with lower achievement of optimal anticoagulation (TTR ≥60%) and higher incidence of primary and secondary end-points. After a multivariate adjustment with the clinical characteristic variables, RDW ≥13.6% was independently associated with lower achievement of optimal anticoagulation (adjusted odds ratio [OR] 0.41, 95% CI 0.26–0.64, p<0.001). Also, it was independently associated with a higher risk of stroke (adjusted hazard ratio [HR] 2.41, 95% CI 1.11–5.24, p=0.027), the primary (adjusted HR 2.00, 95% CI 1.21–3.33, p=0.007) and secondary end-points (adjusted HR 2.36, 95% CI 1.45–3.86, p=0.001) (Table 3). Even after the multivariate adjustment with clinical and laboratory variables, an independent effect of RDW ≥13.6% persisted for the lower achievement of optimal anticoagulation (adjusted OR 0.43, 95% CI 0.23–0.82, p=0.009). Also, it was still independently associated with higher risk of stroke (adjusted HR 3.86, 95% CI 1.11–13.40, p=0.033), the primary (adjusted HR 1.88, 95% CI 1.12–3.16, p=0.016) and secondary end-points (adjusted HR 2.46, 95% CI 1.26–4.81, p=0.008)(Table 3).
DISCUSSION
AF is an important risk factor for thromboembolic stroke and mortality. Identification of high risk patients for thromboembolism is quite important in order to reduce individual and social medical burdens using the benefit of anticoagulation. The CHA2DS2-VASc scoring system is one of the most popular scoring systems to stratify thromboembolic risk in patients with AF.11 Recently, RDW values have emerged as a new predictor for the clinical outcomes in patients with AF.58121314 Due to their availability and inexpensiveness, RDW values are expected to have great clinical utility as a prognostic marker in patients with AF. Nonetheless, it is poorly understood why elevated RDW values are associated with poor clinical outcomes. In those terms, the present study added new clinical evidence that elevated RDW values' association with lower achievement of optimal anticoagulation intensity, which might result in an increased risk of adverse clinical events.
The present study re-confirmed the role of RDW values as prognostic markers, and evaluated them as predictive markers for anticoagulation control, which affects clinical outcomes. Patients with high RDW values had worse clinical outcomes including stroke, major bleeding, mortality, primary or secondary composite outcomes than patients with low RDW values. The CHA2DS2-VASc score was significantly higher in patients with high RDW values. Also, Patients with high RDW values were older, and had more frequent histories of heart failure. Consistent with the present study, Kurt et al reported that RDW values were significantly correlated with CHA2DS2-VASc scores in patients with AF.15 Also, previous studies demonstrated that RDW values were higher in patients with heart failure, stroke, diabetes and hypertension, and associated with increased risk of long-term adverse events among them.12161718 The relationship between high RDW values and poor baseline clinical characteristics might contribute to the increased risk of adverse clinical outcomes in patients with high RDW values.
In the present study, patients with high RDW values had significantly lower mean TTR, and higher RDW values were an independent predictor for poor anticoagulation control (TTR <60%), which might contribute to higher risk for adverse clinical outcomes. Endothelial dysfunction is one of the most important pathomechanisms connected to the increased risk of thromboembolism and poor clinical outcomes in patients with AF.19 RDW has been related to endothelial dysfunction in various clinical settings as well as AF.202122 Furthermore, RDW was associated with markers of impaired endothelial repair and vascular remodeling.20 Endothelial dysfunction associated with high RDW values might contribute to unstable anticoagulation activity. Endothelial cells have a central role in the regulation of coagulation by regulating the expression of binding sites for anticoagulant and procoagulant factors on the cell surface.232425 Endothelial dysfunction deregulates coordinated procoagulant and anticoagulant mechanisms leading to impaired action of anticoagulants on endothelium and expression of poor anticoagulation control. Dysregulation of anticoagulation activity by endothelial dysfunction could be a cause of unstable and fluctuating prothrombin time INR values, resulting in unstable anticoagulation intensity and poor achievement of good INR control.
In the present study, mean INR values were not different between the 2 groups, whereas the proportion of patients satisfying the mean of INR 2.0 to 3.0 was lower in patients with high RDW values. This means that although patients with high RDW values appeared to have similar mean INR values, they had high fluctuation of INR values ranging below 2.0 and above 3.0, resulting in an approximate mean INR of 2.0 to 3.0 but low TTR values. Low INR values less than 2.0 contribute to the increased risk of embolic stroke, whereas high INR values more than 3.0 contribute to the increased risk of major bleeding. Both low and high INR values lessen TTR value. In the present study, low TTR value was associated with an increased risk of thromboembolism, major bleeding, and high RDW value. These results might explain why low TTR values are associated with the increased risk of embolic stroke and major bleeding.
Inflammation also contributes to endothelial dysfunction in patients with AF. Inflammatory markers have been linked to endothelial activation and endothelial cell damage.192627 Serum levels of hs-CRP were higher in patients with high RDW values. Consequently, inflammatory status, represented as a high RDW value, may contribute to increased risk of adverse events via endothelial dysfunction associated with impaired action of anticoagulants.
Although detrimental potentials of high RDW values have been shown in various cardiovascular diseases, caution is needed for the interpretation of the role of RDW values. RDW values are influenced by numerous clinical situations. RDW values increase in anemia, acute blood loss, transfusion, active or chronic inflammatory state, and renal dysfunction.2829 Also, the distribution of RDW values is narrow, which limits clinical application. Therefore, high RDW values alone should not be regarded as a single risk factor for poor clinical outcomes in patients with AF. Rather, they might help to identify high risk patients with AF in the context of accompanied disease status. In the present study, serum levels of hemoglobin and creatinine clearance decreased, and that of hs-CRP increased in patients with high RDW values. Therefore, adjustments for those changes were included in the regression model. Nonetheless, the independent effect of RDW values persisted for the prediction of optimal anticoagulation, stroke and clinical outcomes. These strengthened the role of RDW level in diagnosis of patients with AF.
In conclusion, higher RDW values were associated with increased risk of stroke, mortality, and the composite clinical outcomes. Also, RDW was negatively associated with TTR and an independent predictor for the intensity of optimal anticoagulation in patients with AF. RDW, as an easy and cheap biomarker to analyze, might be a useful marker for the prediction of anticoagulation response and clinical outcomes in patients with AF.
1. Limitations
First, the present study was analyzed retrospectively. Although all patients were intended as enrollees during study period, the non-randomized nature of the retrospective analysis could have result in selection bias. Also, not all of the various clinical conditions that could affect RDW values could be included in the multivariate regression analysis, resulting in some remaining, potential confounders and biases. Second, the time interval between each INR check was relatively long. It might influence the accurate estimation of TTR. Third, a single measurement of RDW is not sufficient. Serial follow-up measurements of RDW might provide more information regarding the relationship between RDW and clinical outcomes in patients with AF. Fourth, the degree of optimal anticoagulation was defined as TTR ≥60%, which followed the Asian Pacific criteria. The mean TTR level was 41.2% and the number of patients with TTR ≥70% was limited, which is therefore lower than in other randomized trials regarding oral anticoagulants. Therefore, a large-scale, international trial is needed to clarify the relationship between optimal TTR levels, and RDW values. Fifth, iron stores status including iron, ferritin and vitamin B12 could not be assessed and adjusted due to the limited data associated with retrospective study design.
 XML Download