

 PDF
PDF ePub
ePub Citation
 Print
Print


INTRODUCTION
MATERIALS AND METHODS
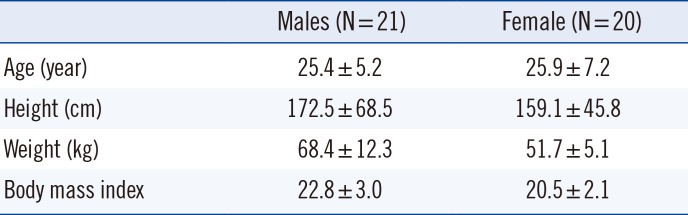
1. Subjects
2. Sample size calculation
3. Sample collection
4. Instruments and analytical methods
5. Statistical analysis
RESULTS
1. Changes in postprandial lipid concentrations
Table 2
Postprandial lipid changes in the 41 study subjects
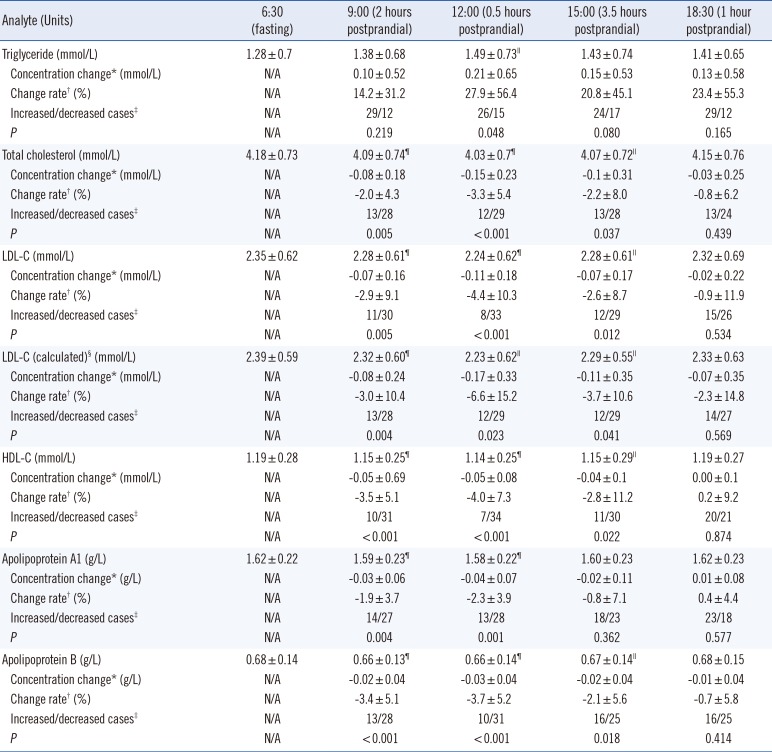
Data are presented as mean±standard deviation or number.
*Concentration change refers to the current postprandial lipid concentration minus the fasting concentration; †Change rate was calculated using the formula [(postprandial concentration minus fasting concentration)/fasting concentration]×100%; ‡Increased cases refer to subjects whose postprandial test results were higher than the fasting results, while decreased cases refer to subjects whose postprandial test results were lower than the fasting results; §LDL-C (calculated) was determined using the Friedewald equation: LDL-C=TC−HDL-C−TG/2.2; ∥P<0.05, ¶P<0.01, paired sample t-test.
Abbreviations: N/A, not available; LDL-C, low-density lipoprotein cholesterol; HDL-C, high-density lipoprotein cholesterol.
![]()
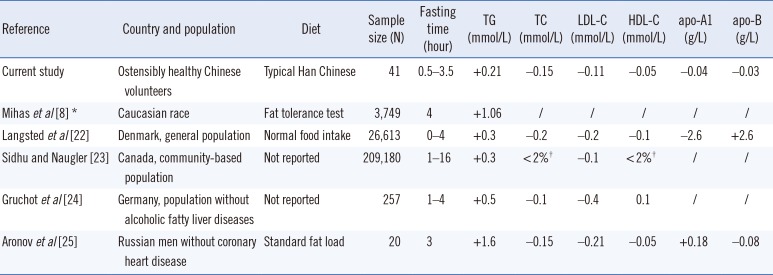
Table 3
Comparison between the maximum mean changes in fasting lipid and postprandial lipid concentrations identified in the current study and in previous studies
| Reference | Country and population | Diet | Sample size (N) | Fasting time (hour) | TG (mmol/L) | TC (mmol/L) | LDL-C (mmol/L) | HDL-C (mmol/L) | apo-A1 (g/L) | apo-B (g/L) |
|---|---|---|---|---|---|---|---|---|---|---|
| Current study | Ostensibly healthy Chinese volunteers | Typical Han Chinese | 41 | 0.5–3.5 | +0.21 | −0.15 | −0.11 | −0.05 | −0.04 | −0.03 |
| Mihas et al [8]* | Caucasian race | Fat tolerance test | 3,749 | 4 | +1.06 | / | / | / | / | / |
| Langsted et al [22] | Denmark, general population | Normal food intake | 26,613 | 0–4 | +0.3 | −0.2 | −0.2 | −0.1 | −2.6 | +2.6 |
| Sidhu and Naugler [23] | Canada, community-based population | Not reported | 209,180 | 1–16 | +0.3 | <2%† | −0.1 | <2%† | / | / |
| Gruchot et al [24] | Germany, population without alcoholic fatty liver diseases | Not reported | 257 | 1–4 | +0.5 | −0.1 | −0.4 | 0.1 | / | / |
| Aronov et al [25] | Russian men without coronary heart disease | Standard fat load | 20 | 3 | +1.6 | −0.15 | −0.21 | −0.05 | +0.18 | −0.08 |
![]()
2. Within-subject changes in lipid concentrations
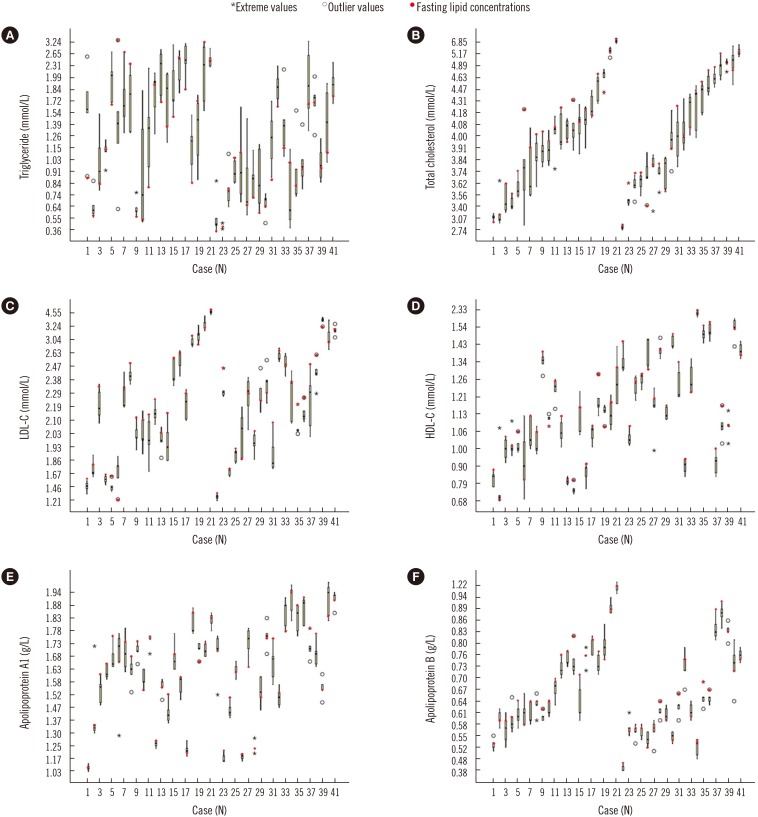 | Fig. 1Changes in lipid concentrations of the 41 subjects at the five time points. (A) daytime changes in triglyceride, (B) daytime changes in total cholesterol, (C) daytime changes in LDL-C, (D) daytime changes in HDL-C, (E) daytime changes in apolipoprotein A1, and (F) daytime changes in apolipoprotein B. Subjects 1 to 21 were males and subjects 22 to 41 were females; each of the box plots presents the maximum value, upper quartile, median, lower quartile, and minimum value.Abbreviations: LDL-C, low-density lipoprotein cholesterol; HDL-C, high-density lipoprotein cholesterol.
|
3. Daytime BV in lipid concentrations
Table 4
Within-subject and between-subject biological variation in lipids (%) across studies
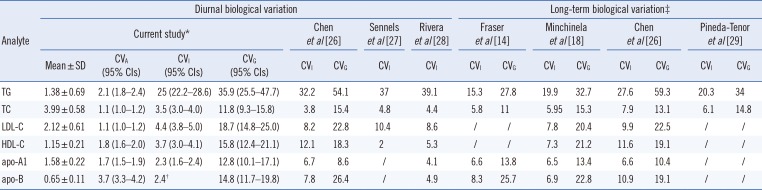
| Analyte | Diurnal biological variation | Long-term biological variation‡ | ||||||||||||||
|---|---|---|---|---|---|---|---|---|---|---|---|---|---|---|---|---|
| Current study* | Chen et al [26] | Sennels et al [27] | Rivera et al [28] | Fraser et al [14] | Minchinela et al [18] | Chen et al [26] | Pineda-Tenor et al [29] | |||||||||
| Mean±SD | CVA (95% CIs) | CVI (95% CIs) | CVG (95% CIs) | CVI | CVG | CVI | CVI | CVI | CVG | CVI | CVG | CVI | CVG | CVI | CVG | |
| TG | 1.38±0.69 | 2.1 (1.8–2.4) | 25 (22.2–28.6) | 35.9 (25.5–47.7) | 32.2 | 54.1 | 37 | 39.1 | 15.3 | 27.8 | 19.9 | 32.7 | 27.6 | 59.3 | 20.3 | 34 |
| TC | 3.99±0.58 | 1.1 (1.0–1.2) | 3.5 (3.0–4.0) | 11.8 (9.3–15.8) | 3.8 | 15.4 | 4.8 | 4.4 | 5.8 | 11 | 5.95 | 15.3 | 7.9 | 13.1 | 6.1 | 15 |
| LDL-C | 2.12±0.61 | 1.1 (1.0–1.2) | 4.4 (3.8–5.0) | 18.7 (14.8–25.0) | 8.2 | 22.8 | 10.4 | 8.6 | / | / | 7.8 | 20.4 | 9.9 | 22.5 | / | / |
| HDL-C | 1.15±0.21 | 1.8 (1.6–2.0) | 3.7 (3.0–4.1) | 15.8 (12.4–21.1) | 12.1 | 18.3 | 2 | 5.3 | / | / | 7.3 | 21.2 | 11.6 | 19.1 | / | / |
| apo-A1 | 1.58±0.22 | 1.7 (1.5–1.9) | 2.3 (1.6–2.4) | 12.8 (10.1–17.1) | 6.7 | 8.6 | / | 4.1 | 6.6 | 13.8 | 6.5 | 13.4 | 6.6 | 10.4 | / | / |
| apo-B | 0.65±0.11 | 3.7 (3.3–4.2) | 2.4† | 14.8 (11.7–19.8) | 7.8 | 26.4 | / | 4.9 | 8.3 | 25.7 | 6.9 | 22.8 | 10.9 | 19.1 | / | / |
*The calculation model for biological variation was based on Braga and Panteghini [13]. Five blood samples were collected from a total of 41 subjects, each sample was tested twice, and a total of 410 samples were acquired. All samples were tested on the same day; †CVI confidence intervals could not be calculated because the CVA was greater than the CVI for apo-B; ‡Fasting blood sample.
Abbreviations: 95% CIs, 95% confidence intervals; TG, triglyceride (mmol/L); TC, total cholesterol (mmol/L); LDL-C, low-density lipoprotein cholesterol (mmol/L); HDL-C, high-density lipoprotein cholesterol (mmol/L); apo-A1, apolipoprotein A1 (g/L); apo-B, apolipoprotein B (g/L); CVA, analytical coefficient of variation; CVI, within-subject biological variation; CVG, between-subject biological variation.
![]()
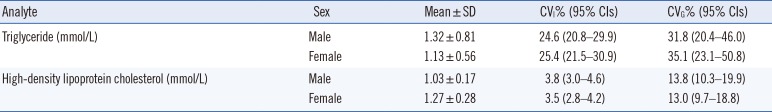
Table 5
The within-subject and between-subject daytime biological variation of lipid concentrations in male and female subjects
![]()
 XML Download