Journal List > Transl Clin Pharmacol > v.26(1) > 1094568

Chung, Oh, Lee, Jang, Lee, and Chung: A post hoc analysis of intra-subject coefficients of variation in pharmacokinetic measures to calculate optimal sample sizes for bioequivalence studies

Abstract

Because bioequivalence studies are performed using a crossover design, information on the intra-subject coefficient of variation (intra-CV) for pharmacokinetic measures is needed when determining the sample size. However, calculated intra-CVs based on bioequivalence results of identical generic drugs produce different estimates. In this study, we collected bioequivalence results using public resources from the Ministry of Food and Drug Safety (MFDS) and calculated the intra-CVs of various generics. For the generics with multiple bioequivalence results, pooled intra-CVs were calculated. The estimated intra-CVs of 142 bioequivalence studies were 14.7±8.2% for AUC and 21.7±8.8% for Cmax. Intra-CVs of Cmax were larger than those of area under the concentration-time curve (AUC) in 129 studies (90.8%). For the 26 generics with multiple bioequivalence results, the coefficients of variation of intra-CVs between identical generics (mean±sd (min ~ max)) were 38.0±24.4% (1.9 ~ 105.3%) for AUC and 27.9±18.2% (4.0 ~ 70.1%) for Cmax. These results suggest that substantial variation exists among the bioequivalence results of identical generics. In this study, we presented the intra-CVs of various generics with their pooled intra-CVs. The estimated intra-CVs calculated in this study will provide useful information for planning future bioequivalence studies. (This is republication of the article 'Transl Clin Pharmacol 2017;25:179-182' retracted from critical typographic errors. See the 'Retraction and Republication section of this issue for further information)

Introduction

One of the most important considerations in planning a bioequivalence study is the determination of the sample size and its associated power.[1234] Statistically, power represents the probability the null hypothesis will be rejected when the alternative hypothesis is true.[567] Since the null hypothesis in bioequivalence studies is that the substances are bioinequivalent, the power of a bioequivalence study is the probability of proving bioequivalence when the products are in fact bioequivalent.[578] Because finding the optimal sample size ensures adequate power, the sample size calculation is one of the most important steps in designing a bioequivalence study. Sample sizes that are too large increase the cost of the study and unnecessarily expose many subjects to the drug. In contrast, sample sizes that are too small increase the type 2 error and may result in study failure. According to the statistical guidelines of the U.S. FDA and EMA, 80% or 90% power is recommended for bioequivalence studies.[9]
The determination of the sample size requires information on the intra-subject coefficient of variation (intra-CV) of pharmacokinetic measures. However, the calculated intra-CVs of identical generics vary considerably among studies. For example, the reported intra-CVs of metformin's maximum concentration (Cmax) were 12.1% and 24.8% in two different bioequivalence studies.[10] These results suggested that choosing a sample size based on a single bioequivalence result can be insufficient to achieve adequate power for planning a trial.
The Ministry of Food and Drug Safety (MFDS) of Korea has released the results of bioequivalence studies to the public since January 2014.[11] These data include information for power and sample size calculations in bioequivalence studies (i.e., 90% confidence intervals for the area under the concentration-time curve (AUC) and Cmax, and sample sizes). These data also show that there has been considerable variability in the sample sizes for bioequivalence studies on the same generic drugs.
To aid in designing bioequivalence studies, this study aimed to investigate appropriate sample sizes by analyzing the intra-CV of AUC and Cmax from 142 bioequivalence results of 58 generic drugs obtained from public resources provided by the MFDS of Korea.

Methods

Study data

The data for the analysis were obtained from the public bioequivalence results database on the Ministry of Food and Drug Safety's (MFDS) homepage (http://www.mfds.go.kr/).[11] A total of 183 bioequivalence study results published from Jan 2015 to Nov 2015 were considered for analysis. Among 183 bioequivalence results, 41 results from fixed-dose combination-drugs were excluded to avoid statistical complications. The 142 analyzed bioequivalence studies were performed with a standard two period, two sequence crossover design involving fasting, healthy male volunteers.

Statistical analysis

Using the PowerTOST package (ver. 1.2-08) in the R statistical program (ver. 3.1.3), the intra-CV, post-hoc power and appropriate sample size needed for bioequivalence studies to attain more than 80% and 90% power were calculated with the equations below:[2,8,12,13,14,15]. For sample size calculation, the larger of the two intra-CVs from AUC or Cmax was used.
Point estimate (PE) based on a confidence interval (CI)=CIlow*CIhightcp-26-6-e001.jpg
Margin of error on the log scale (ΔCL) = LN(PE)LN(CLlow)
Mean squared error (MSE)=2*CLΔ1n1+1n2*t12α, n1+n222tcp-26-6-e002.jpg
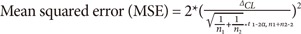
(t: t-values of the student t distribution; α: probability of type 1 error; n1 and n2: sample sizes of each group)
Intra-CV (%)=100*eMSE1tcp-26-6-e003.jpg
Sample size (N)2*LN1+CV2*Z1β2+Z1α2Ln1.252tcp-26-6-e004.jpg
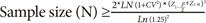
(α: probability of type 1 error; β: probability of type 2 error; CV = Intra-CV)
For generics with multiple bioequivalence results, pooled CVs weighted by sample size were calculated using the equations below, and these were used for calculating the optimal sample size:[4,14]
Pooled CV=elnIntra-CV2+1df/df1tcp-26-6-e005.jpg
Confidence limit of pooled intra-CV=elnIntra-CV2+1df/χ2α, df1tcp-26-6-e006.jpg
(df: degrees of freedom;χ2α, dftcp-26-6-i002.jpg : critical value of chi square estimates)

Results

Basic characteristics of bioequivalence studies analyzed

In total, 142 bioequivalence study results from 58 generics were evaluated in this study. Fifty-five generics were enteral formulations (i.e., 4 extended release formulations and 51 immediate release formulations), and 3 generics were topical formulations.

Intra-coefficients of variation for pharmacokinetic measures and sample size

The intra-CV of Cmax was larger than that of AUC in 129 studies (90.8%), and this was consistent with previous reports that considered Cmax the cornerstone for bioequivalence approval.[16] The estimated intra-CV (mean ± sd (min ~ max)) for Cmax was 21.7 ± 8.8% (5.4 ~ 54.0%), and that for AUC was 14.7 ± 8.2% (3.2 ~ 56.4%) (Table 1).
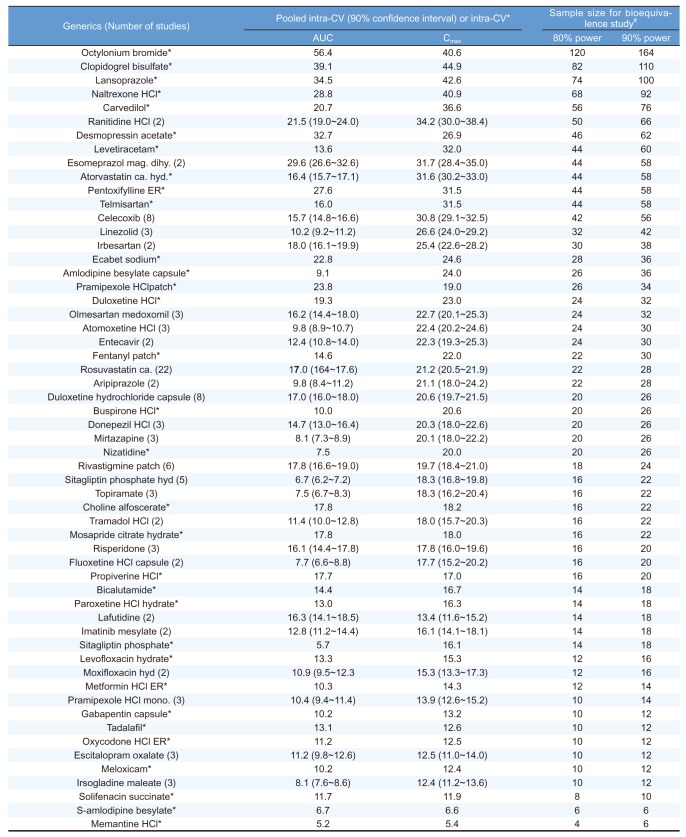
The average total sample size (mean±sd) to obtain greater than 80% power was 26±20. In 44 out of 58 of the generics evaluated, the optimal sample sizes were larger than the minimal sample size for bioequivalence studies requested by the MFDS (n=12). For 14 (24.1%) generics, the estimated intra-CV of AUC and/or Cmax was larger than 30%, the threshold for classifying a drug as ‘Highly Variable Drugs’. The estimated sample sizes of these 14 generics with estimated intra-CVs larger than 30% were 58.3±22.8 (min=42, max=120), far larger than the average estimated sample sizes of the 45 generics with intra-CVs of less than 30% (16.8±6.5, min=4, max=32). For the 26 generics with multiple bioequivalence results, substantial variations between the products of identical generics were found. The coefficient of variation (%) in intra-CV estimates between the products of identical generics ranged from 4.0% to 70.1% with respect to Cmax and 1.9% to 105.3% for AUC.

Discussion

In the present study, we calculated the intra-CVs of various generics and evaluated the extent of inter-study variability. Large variations were observed for the estimated intra-CVs of pharmacokinetic measures between the study results of identical generics. Intra-CV is probably affected by drug’s intrinsic factors such as absolute oral bioavailability and acidity.[17] However, extrinsic factors can substantially contribute to the variation in Intra-CV of same substance. The reason could be variability in drug concentration analysis, hospital site, protocol deviation, and manufacturing. Our results suggest that pooling of intra-CVs from multiple bioequivalence results will produce more reliable estimates of intra-CVs for designing bioequivalence studies. In this study, we present the pooled CV and its upper 80% confidence limit for 26 generics with multiple bioequivalence results (Table 1). The estimated intra-CV values and the information on inter-study variability will provide useful information for future planning of bioequivalence studies for the generics analyzed. To validate our results, we compared our data to other ethnic groups in 3 highly replicated generic drugs. Intra-CVs of Cmax were 21.2% for rosuvastatin in Indonesian,[18] 29.0% for celecoxib in Taiwan[19] and 20.2% for duloxetine in Thai subjects.[20] All of them were quite similar to our results.
Our study has some limitations regarding the estimation of intra-CVs for reference drugs because we only analyzed 2×2 crossover studies. To estimate true intra-CVs of reference drugs, 2×3 or 2×4 replicative designs that allow replicative administration of reference products are needed.[21] In addition, all of the generic drugs we analyzed were successfully bioequivalent with their reference drugs, which may lead to biased results. However, our study results can be interpreted as reasonable approximations for the values of the true intra-CVs because we calculated pooled CVs from multiple studies.
In conclusion, we estimated the intra-CVs of various generics and the optimal sample sizes for bioequivalence studies. Our study results will be useful for planning future bioequivalence studies.

Acknowledgements

This study was supported by grant no. 12-2013-026 from the SNUBH Research Fund.

Notes

Reviewer: This article was reviewed by peer experts who are not TCP editors.

Conflicts of interests: -Authors: None of the authors have any conflicts of interest to declare.

-Reviewers: Nothing to declare

-Editors: Nothing to declare

References

1. Chow SC. Bioavailability and bioequivalence in drug development. Wiley Interdiscip Rev Comput Stat. 2014; 6:304–312. PMID: 25215170.
crossref
2. Sanchez MP, Ocana J, Carrasco JL. The effect of variability and carryover on average bioequivalence assessment: a simulation study. Pharm Stat. 2011; 10:135–142. PMID: 22432131.
3. Shen M, Russek-Cohen E, Slud EV. Letter to the editor by the authors of Exact Calculation of Power and Sample Size in Bioequivalence Studies Using Two One-sided Tests. Pharm Stat. 2015; 14:272. DOI: 10.1002/pst.1677. PMID: 25807931.
4. Ahmed S. A pooling methodology for coefficient of variation. Sankhya Ser B. 1995; 57:57–75.
5. Phillips KF. Power of the two one-sided tests procedure in bioequivalence. J Pharmacokinet Biopharm. 1990; 18:137–144. PMID: 2348380.
crossref
6. Chow SC, Wang H. On sample size calculation in bioequivalence trials. J Pharmacokinet Pharmacodyn. 2001; 28:155–169. PMID: 11381568.
7. Worley JW, Morrell JA, Duewer DL, Peterfreund LA. Alternate indexes of variation for the analysis of experimental data. Anal Chem. 1984; 56:462–466.
crossref
8. Labes D. Implementation details of the power calculations via simulations for scaled ABE in-package PowerTOST. Accessed 20 October 2017. https://cran.r-project.org/web/packages/PowerTOST/PowerTOST.pdf.
9. Chen ML, Shah V, Patnaik R, Adams W, Hussain A, Conner D, et al. Bioavailability and bioequivalence: an FDA regulatory overview. Pharm Res. 2001; 18:1645–1650. PMID: 11785681.
10. Yuen KH, Wong JW, Yap SP, Billa N. Estimated coefficient of variation values for sample size planning in bioequivalence studies. Int J Clin Pharmacol Ther. 2001; 39:37–40. PMID: 11204936.
crossref
11. MFDS Information on Drug Safety. Accessed 25 October 2017. http://www.mfds.go.kr/index.do?mid=1176&cd=191.
12. Diletti E, Hauschke D, Steinijans VW. Sample size determination for bioequivalence assessment by means of confidence intervals. Int J Clin Pharmacol Ther Toxicol. 1991; 29:1–8. PMID: 2004861.
13. Diletti E, Hauschke D, Steinijans VW. Sample size determination for bioequivalence assessment by means of confidence intervals. Int J Clin Pharmacol Ther Toxicol. 1992; 30(Suppl 1):S51–S58. PMID: 1601532.
14. Labes D. Package ‘PowerTOST’. Accessed 20 October 2017. https://cran.r-project.org/web/packages/PowerTOST/PowerTOST.pdf.
15. Midha KK, McKay G. Bioequivalence; its history, practice, and future. AAPS J. 2009; 11:664–670. DOI: 10.1208/s12248-009-9142-z. PMID: 19806461.
crossref
16. Ramirez E, Laosa O, Guerra P, Duque B, Mosquera B, Borobia AM, et al. Acceptability and characteristics of 124 human bioequivalence studies with active substances classified according to the Biopharmaceutic Classification System. Br J Clin Pharmacol. 2010; 70:694–702. DOI: 10.1111/j.1365-2125.2010.03757.x. PMID: 21039763.
crossref
17. Sato M, Narukawa M. Factors affecting intrasubject variability of PK exposure: absolute oral bioavailability and acidic nature of drugs. Int J Clin Pharmacol Ther. 2015; 53:955–962. DOI: 10.5414/CP202399. PMID: 26365336.
crossref
18. Harahap Y, Prasaja B, Azmi F, Lusthom W, Sinandang T, Felicia V, et al. Bioequivalence study of two rosuvastatin tablet formulations in healthy Indonesian subjects. Int J Clin Pharmacol Ther. 2016; 54:212–216. DOI: 10.5414/CP202345. PMID: 26073355.
crossref
19. Ju SY, Chen YC, Tzeng HK, Chen SW, Guo GT, Juan CH, et al. Bioequivalence Evaluation of Two Formulations of Celecoxib 200 mg Capsules in Healthy volunteers by using a validated LC/MS/MS method. Int J Bioanal Methods Bioequival Stud. 2015; 2:34–40.
20. Techatanawat I, Bhuket PRN, Teerawonganan P, Yoosakul E, Khaowroongrueng V, Paisarnsinsool W, et al. Bioequivalence study of duloxetine hydrochloride 60 mg ec capsules in the fasting and fed states in healthy Thai male volunteers. J Health Res. 2015; 29:165–169.
21. Davit BM, Chen ML, Conner DP, Haidar SH, Kim S, Lee CH, et al. Implementation of a reference-scaled average bioequivalence approach for highly variablegeneric drug products by the US Food and Drug Administration. AAPS J. 2012; 14:915–924. PMID: 22972221.
Table 1

Weighted mean of intra-subject coefficient of variation (pooled intra-CV) and sample size for bioequivalence studies of 58 generics

tcp-26-6-i001
Generics (Number of studies) Pooled intra-CV (90% confidence interval) or intra-CV* Sample size for bioequivalence study#
AUC Cmax 80% power 90% power
Octylonium bromide* 56.4 40.6 120 164
Clopidogrel bisulfate* 39.1 44.9 82 110
Lansoprazole* 34.5 42.6 74 100
Naltrexone HCl* 28.8 40.9 68 92
Carvedilol* 20.7 36.6 56 76
Ranitidine HCl (2) 21.5 (19.0~24.0) 34.2 (30.0~38.4) 50 66
Desmopressin acetate* 32.7 26.9 46 62
Levetiracetam* 13.6 32.0 44 60
Esomeprazol mag. dihy. (2) 29.6 (26.6~32.6) 31.7 (28.4~35.0) 44 58
Atorvastatin ca. hyd.* 16.4 (15.7~17.1) 31.6 (30.2~33.0) 44 58
Pentoxifylline ER* 27.6 31.5 44 58
Telmisartan* 16.0 31.5 44 58
Celecoxib (8) 15.7 (14.8~16.6) 30.8 (29.1~32.5) 42 56
Linezolid (3) 10.2 (9.2~11.2) 26.6 (24.0~29.2) 32 42
Irbesartan (2) 18.0 (16.1~19.9) 25.4 (22.6~28.2) 30 38
Ecabet sodium* 22.8 24.6 28 36
Amlodipine besylate capsule* 9.1 24.0 26 36
Pramipexole HClpatch* 23.8 19.0 26 34
Duloxetine HCl* 19.3 23.0 24 32
Olmesartan medoxomil (3) 16.2 (14.4~18.0) 22.7 (20.1~25.3) 24 32
Atomoxetine HCl (3) 9.8 (8.9~10.7) 22.4 (20.2~24.6) 24 30
Entecavir (2) 12.4 (10.8~14.0) 22.3 (19.3~25.3) 24 30
Fentanyl patch* 14.6 22.0 22 30
Rosuvastatin ca. (22) 17.0 (164~17.6) 21.2 (20.5~21.9) 22 28
Aripiprazole (2) 9.8 (8.4~11.2) 21.1 (18.0~24.2) 22 28
Duloxetine hydrochloride capsule (8) 17.0 (16.0~18.0) 20.6 (19.7~21.5) 20 26
Buspirone HCl* 10.0 20.6 20 26
Donepezil HCl (3) 14.7 (13.0~16.4) 20.3 (18.0~22.6) 20 26
Mirtazapine (3) 8.1 (7.3~8.9) 20.1 (18.0~22.2) 20 26
Nizatidine* 7.5 20.0 20 26
Rivastigmine patch (6) 17.8 (16.6~19.0) 19.7 (18.4~21.0) 18 24
Sitagliptin phosphate hyd (5) 6.7 (6.2~7.2) 18.3 (16.8~19.8) 16 22
Topiramate (3) 7.5 (6.7~8.3) 18.3 (16.2~20.4) 16 22
Choline alfoscerate* 17.8 18.2 16 22
Tramadol HCl (2) 11.4 (10.0~12.8) 18.0 (15.7~20.3) 16 22
Mosapride citrate hydrate* 17.8 18.0 16 22
Risperidone (3) 16.1 (14.4~17.8) 17.8 (16.0~19.6) 16 20
Fluoxetine HCl capsule (2) 7.7 (6.6~8.8) 17.7 (15.2~20.2) 16 20
Propiverine HCl* 17.7 17.0 16 20
Bicalutamide* 14.4 16.7 14 18
Paroxetine HCl hydrate* 13.0 16.3 14 18
Lafutidine (2) 16.3 (14.1~18.5) 13.4 (11.6~15.2) 14 18
Imatinib mesylate (2) 12.8 (11.2~14.4) 16.1 (14.1~18.1) 14 18
Sitagliptin phosphate* 5.7 16.1 14 18
Levofloxacin hydrate* 13.3 15.3 12 16
Moxifloxacin hyd (2) 10.9 (9.5~12.3) 15.3 (13.3~17.3) 12 16
Metformin HCl ER* 10.3 14.3 12 14
Pramipexole HCl mono. (3) 10.4 (9.4~11.4) 13.9 (12.6~15.2) 10 14
Gabapentin capsule* 10.2 13.2 10 12
Tadalafil* 13.1 12.6 10 12
Oxycodone HCl ER* 11.2 12.5 10 12
Escitalopram oxalate (3) 11.2 (9.8~12.6) 12.5 (11.0~14.0) 10 12
Meloxicam* 10.2 12.4 10 12
Irsogladine maleate (3) 8.1 (7.6~8.6) 12.4 (11.2~13.6) 10 12
Solifenacin succinate* 11.7 11.9 8 10
S-amlodipine besylate* 6.7 6.6 6 6
Memantine HCl* 5.2 5.4 4 6

ER, Extended release; mag, magnesium; dihy, dihydrate; hyd, hydrate; ca., calcium; HCl, hydrochloride; mono, monohydrate. Sample sizes for bioequivalence studies of various generics were calculated based on the higher of the intra-CVs (i.e., either from AUC or Cmax). *When the number of studies is 1. # Total sample size for 2×2 cross-over bioequivalence study.

TOOLS
Similar articles