

 PDF
PDF ePub
ePub Citation
 Print
Print


Introduction
Metformin, an oral antihyperglycemic agent, is widely used as the first-line pharmacotherapy for type 2 diabetes mellitus (T2DM), particularly in people who are overweight. In the United States, metformin was approved in 1995. Since then, either alone or as a combination, metformin has been considered useful and relatively safe.[1] Currently, numerous metformin IR and modified-release products are marketed worldwide as a treatment for T2DM.[2] Development of a fixed-dose combination (FDC) has increased, aimed at the increasing number of patients with chronic disease. Despite its widespread use, population pharmacokinetic (PK) modeling of metformin is not well developed.
After oral administration, metformin has a prolonged (6~10 h) and incomplete absorption limited to the small intestine. The bioavailability (F) is 55 ± 16%, showing high variability between individuals.[34] The peak plasma concentration of metformin occurs approximately 3 h after administration, with a large volume of distribution (63~276 L), which indicates the considerable uptake from the tissue.[5] Metformin is not bound to plasma protein and its elimination half-life is 1.7~4.5 h, primarily eliminated by renal excretion (> 99%).[46] Change of formulation can affect the PK profile of metformin especially during the absorption process.
This study sought to evaluate the effect of formulation on PK parameters by developing a population PK model of metformin in Koreans and using this model to assess bioequivalence.
Go to : 
Methods
Overall Study Design and Ethical Considerations
A phase I, open-label, randomized, single-dose, 2-way crossover, comparative PK study of a single agent and FDC of metformin was conducted at Seoul St. Mary's Hospital. This study complied with the Declaration of Helsinki, the Good Clinical Practice Guidelines of the International Conference on Harmonization, and local laws and regulations. The protocol was approved by the institutional review board of Seoul St. Mary's Hospital (KC14MDSF0913).
Eligibility Criteria
Korean male volunteers aged between 19 and 55 years who were healthy based on their medical history, detailed physical examination, laboratory test results, and lifestyle including alcohol intake and smoking were recruited. Volunteers were excluded if they had any history of allergic reaction to metformin or any disease history that could affect the status of their health. Volunteers who were expected to have a different PK profile from the normal group were also excluded. Moreover, volunteers who could not abstain from drinking alcohol, smoking, or taking any other medication during the period of the clinical trial were excluded.
Study Procedures
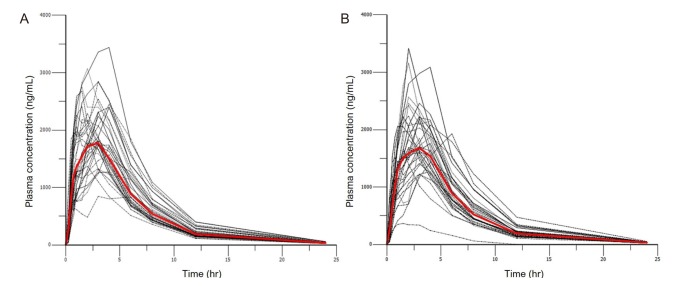
Participants who were considered eligible after a screening test were randomized into two sequence groups and received either a test or reference formulation with 150 mL of water after 10 h of fasting during each period. To control conditions, subjects were hospitalized one day before each administration and were discharged after the 24 h post-dose sampling. There was a 1-week wash-out period between administrations. To assess PK, blood sampling was performed at 0 (predose), 0.25, 0.5, 0.75, 1, 1.5, 2, 3, 4, 6, 8, 12, and 24 h after administration. Venous blood (8 mL) was collected into sodium heparin tubes and 1 mL of normal saline was flushed into the line to prevent clotting. The collected samples were centrifuged (3,000 rpm, 10 min, 4℃) within 1 h to obtain plasma. Plasma (1.2 mL) from each sample was transferred to microcentrifuge tubes and stored frozen at −70℃ until the assay. Plasma concentration of metformin was assayed by liquid chromatography followed by tandem mass spectrometry (LC-MS/MS). The observed time-concentration profile is shown in Figure 1.
Population PK Model Development
Nonlinear mixed-effect modeling was conducted for the population PK analysis. A first-order conditional estimation method with interaction (FOCE-I) was used whenever applicable. The adequacy of the model was evaluated using previous reported parameter values, changes of the objective function value (OFV), visual inspection of various diagnostic plots (goodness-of-fit plot), precision of parameter estimates, and model stability. The significance of improvement of the model was evaluated using a likelihood-ratio test. When a parameter was added with a significance level of 0.05, and if the OFV decreased more than 3.84, it was considered significant. To compare non-nested models, the Akaike Information Criteria (AIC) were used. NONMEM (version 7.3, Icon Development Solutions, Ellicott City, MD, USA) was used for population PK analysis. R (version 3.2.2, R Foundation for Statistical Computing, Vienna, Austria) was used for data preparation, graphical analysis, model diagnostics, and statistical summaries.
Based on literature values, a two-compartment model with first-order absorption was used initially. However, further absorption models (e.g. Dual and Weibull-type absorption) were evaluated to describe multiple peaks of individual data. Each parameter was assumed to follow a log-normal distribution and described as: where Pi is the individual parameter for i-th individual, PTV is the typical value of the model parameter for the population, and ŋi is the interindividual random effect following a normal distribution with a mean of 0 and variance of ω2 accounting for i-th individual's deviation from the typical value PTV. Proportional and combined error models were used to test the residual error. When the correlation between the random variables was significant, the OMEGA BLOCK option was used to reflect the relationship.
Covariate analysis was conducted after using the base structural model including age, weight, height, serum creatinine level, creatinine clearance, and formulation. The effect of formulation on parameters was described as: where θref is the value of the parameter when a single agent was administered (formulation = 0) and θtest is the value of the parameter when FDC was administered (formulation = 1).
Continuous covariates were centered on their median value. To assess the significance in this step, covariates were forward selected using likelihood-ratio tests (based on OFV values) and a backward elimination process was used on the resulting model. However, covariates that were significant in the selection process could be excluded from the final model if they were not physiologically plausible.
Model Evaluation
Visual predictive checks (VPCs) of the graphical evaluation and bootstrap analysis were conducted for nonparametric evaluation. A simulated concentration of 300 datasets using the final model were collected and grouped by formulation. The 5th and 95th percentiles of the simulated concentration were calculated at each time point and observed concentrations were overlaid by group to evaluate the accuracy of final model. Wings for NONMEM (version 741, wfn.sourceforge.net/) were used for nonparametric bootstrap analysis of the stability of the final model. We generated 1,000 bootstrap replicates of the original dataset, and median values and 95% confidence intervals of parameters from the 1,000 datasets were calculated to compare with the final parameters.
Go to :
Results
Dataset
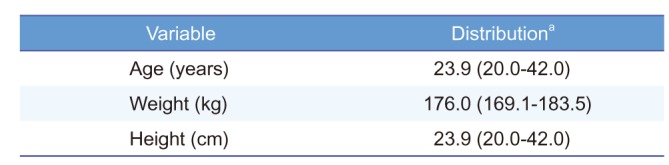
The demographic characteristics of the participants (n = 36) are summarized in Table 1. Mean ± standard deviation (SD) of age was 23.9 ± 5.0 years. Mean height and weight were 176.0 ± 3.5 cm and 70.9 ± 7.9 cm, respectively. There was no significant difference in collected demographic characteristics between the sequence groups.
Population Pharmacokinetic Analysis
From the exploratory analysis, metformin PK had multiple peaks and a biexponential elimination phase. The structural model included two-compartment models with first-order elimination kinetics. To describe the multiple peaks in many participants, the following methods were used to evaluate the absorption process: Weibull-type absorption followed by zero-order absorption with a lag time, Weibull-type absorption followed by first-order absorption with a lag time, first-order absorption followed by first-order absorption with a lag time, and first-order absorption followed by zero-order absorption with a lag time. The final structural model was selected based on AIC value (Table 2).
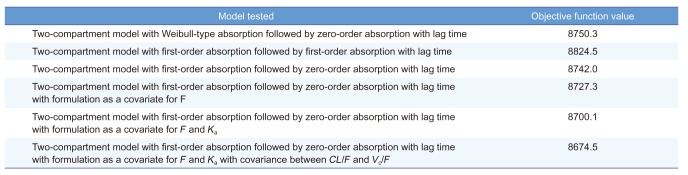
Table 2
PK model development process
![]()
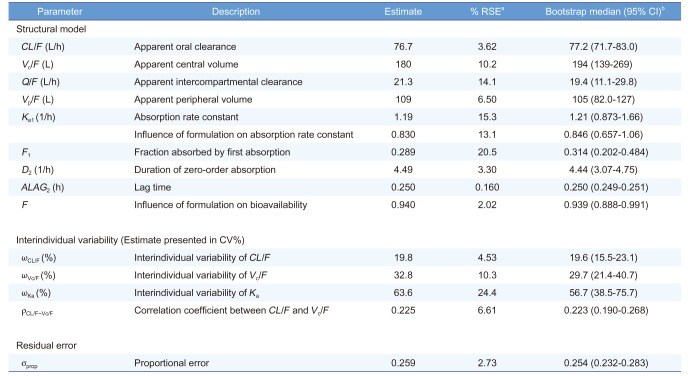
Among the other models, metformin PK was best described by the 2-compartment PK model with first-order absorption followed by zero-order absorption with a lag time and first-order elimination (Fig. 2). The parameters of the final structural model including the apparent clearance (CL/F), apparent volume of central compartment (Vc/F), apparent intercompartmental clearance (Q/F), apparent volume of peripheral compartment (Vp/F), rate constant of first-order absorption (Ka), duration of dosing for zero-order absorption (D2), lag time of zero-order absorption (ALAG2), fraction of the dose absorbed by the first-order absorption(F1), and relative bioavailability (F) were estimated and are shown in Table 3. Interindividual variability of CL/F, Vc/F, and Ka was incorporated into the structural model and the covariance between CL/F and Vc, was also incorporated in the base model. Both variabilities estimated are shown in Table 3.
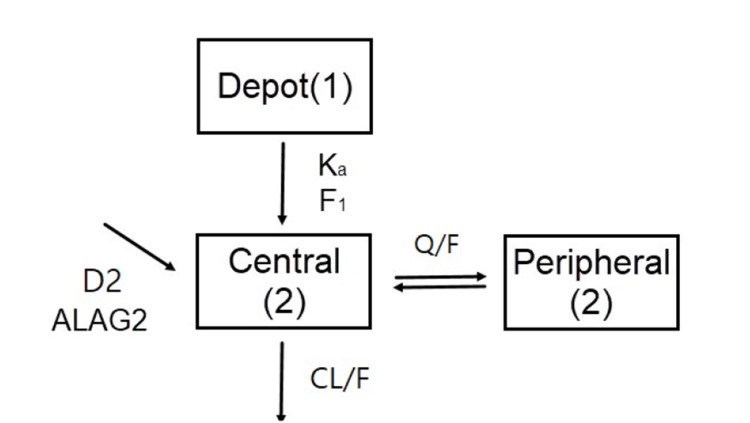 | Figure 2Metformin PK model. Ka, first-order absorption rate constant; F1, fraction of the dose absorbed through first-order absorption; D2, duration of zero-order absorption; ALAG2, lag time of zero-order absorption; CL/F, apparent clearance; Q/F, apparent intercompartmental clearance.
|
Table 3
Summary of final population PK parameter estimates
![]()
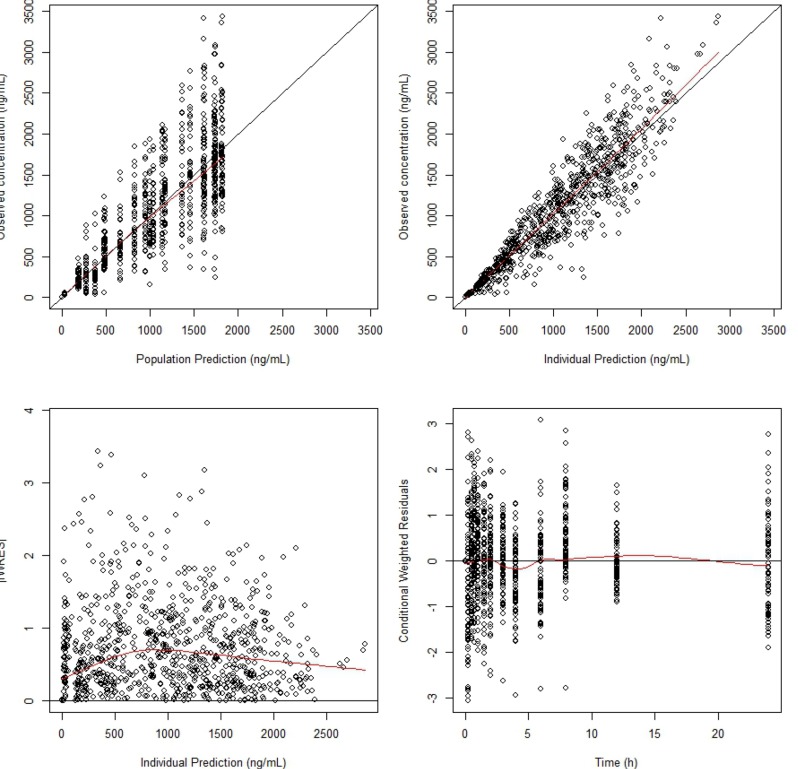
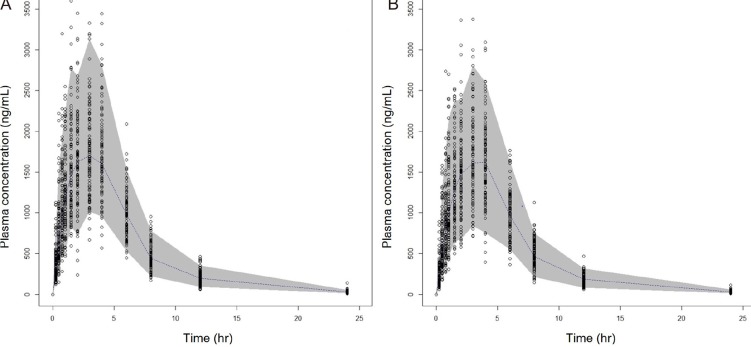
The goodness-of-fit plots of the final PK model are presented in Figure 3. The figure shows that there was no specific trend in the plots of CWRES versus the PRED or time, and good agreement between the observed data and IPRED. The mean population parameter estimates from the final model were close to median values of the parameter estimates and their 95% confidence interval (CIs) from bootstrapping, showing the robustness of final model (Table 3). The VPC result grouped by formulation is presented in Figure 4, showing the predictive performance is adequate.
Covariate Analysis and Formulation Difference
From the covariate analysis, covariates including age, weight, height, and creatinine clearance did not show any significant effect on any of PK parameters. Formulation had a significant effect (p < 0.01) on relative bioavailability (F) and absorption rate constant (Ka). Influence of formulation on F was 0.94 and influence of formulation on Ka was 0.83 (Table 2).
Go to :
Discussion
The aim of the present study was to compare the effect of two different formulations (FDC and the corresponding single product) on PK parameters and to evaluate the relative bioavailability of these formulations using mixed-effect modeling analysis. The population PK of metformin is best described by a two-compartment, first-order elimination model with first-order absorption followed by zero-order absorption. Besides the PK parameters of the absorption phase, the values of PK parameters were consistent with values from literature.[5] In the present study, multiple peaks were observed during the absorption phase of metformin, which is not consistent with previous PK analysis of metformin. However, the combined absorption model has better fit to the data than the single absorption model.
There are several possible mechanisms for the multiple peaks in the absorption part of the concentration profile. When the drugs follow a solubility-limited absorption pathway or have physicochemical properties such as low lipophilicity, multiple peaks may result from delayed absorption. Physiological factors such as enterohepatic recycling, gastric emptying, intestinal transit time, site-specific absorption, and gastroduodenal reflux can also result in multiple peaks in the absorption phase.[6] Metformin has low solubility and lipophilicity, and prolonged and incomplete absorption, which appears only limited to the small intestine with high interindividual variability of F.[7] Moreover, metformin induces gastroduodenal reflux, especially when an individual is fasting or has gastritis, which passes about 20% of the amount of drug that has been absorbed in the stomach onto the duodenum.[8] We consider that these features of metformin could have caused the multiple peaks observed occasionally. Although the two-process absorption model showed improved results over the single absorption model, the multiple peaks were not well captured by the model, because each individual underwent two observation periods with different concentration profiles at each period, especially during the absorption phase.
The formulation was shown to have significant effect on the F (ΔOFV ≈ 15) and Ka (ΔOFV ≈ 27). The influence of formulation on F was 0.94, and the influence of formulation on Ka was 0.83. This influence shows that there is a significant difference in the extent and rate of absorption between the different formulations. However, the difference was within 20%, which is within the conventional range of bioequivalence criteria. F was assumed as relative bioavailability between the two formulations from the population PK modeling and was comparatively consistent with the geometric mean ratio of AUClast (point estimates = 0.9136) from the NCA analysis (data not shown). The effect of formulation on absorption rate can be assumed by the change of Ka. However, comparing Ka from the population PK modeling and Cmax was not appropriate because a combined absorption model was used. The interindividual variability of other PK parameters (D2, ALAG2), which can show the rate of absorption, was not estimated. Although metformin is excreted mostly by the renal pathway, which can be affected by creatinine clearance, none of the covariates including creatinine clearance was shown to have significant effect on any of the PK parameters. We used specific criteria to recruit healthy participants with narrow range of weight, height, age, and serum creatinine level into the present study. We assumed that covariates did not have any significant effect on any of the PK parameters because of the narrow range of covariates between subjects.
The PK profile of the disposition phase was consistent with values from the literature.[5] However, in the present study, multiple peaks during the absorption phase were found, which implies a possible diversity of absorption PK profile depending on the formulation and population. Unlike conventional bioequivalence analysis, a population PK model can reflect the difference of formulation on specific parameters and reflected simulation can be performed.
Go to :
 XML Download