

 PDF
PDF ePub
ePub Citation
 Print
Print


Introduction
Methods
Study subjects
Study design
Blood sample collection
Plasma concentration of rosuvastatin, ezetimibe and total ezetimibe
Pharmacokinetic data analysis
Safety and tolerability assessment
Statistical analysis
Results
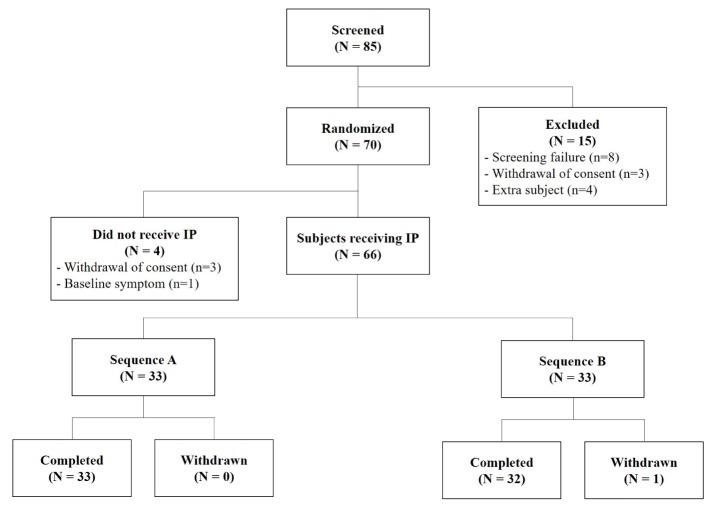
Subject Disposition and Baseline Characteristics
Pharmacokinetics
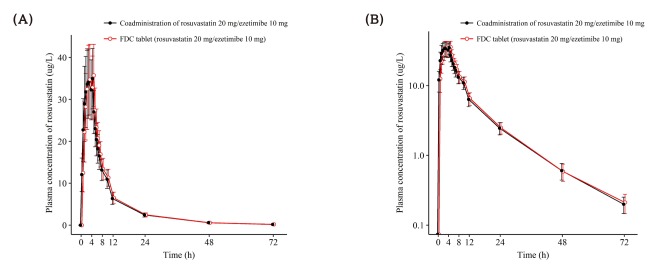 | Figure 2Mean ± SD plasma concentration-time profiles of rosuvastatin after a single oral administration of fixed dose combination tablet (rosuvastatin 20 mg / ezetimibe 10 mg) or coadministration of rosuvastatin 20 mg and ezetimibe 10 mg. FDC = fixed dose combination. (A) linear scale (B) semi-log scale.
|
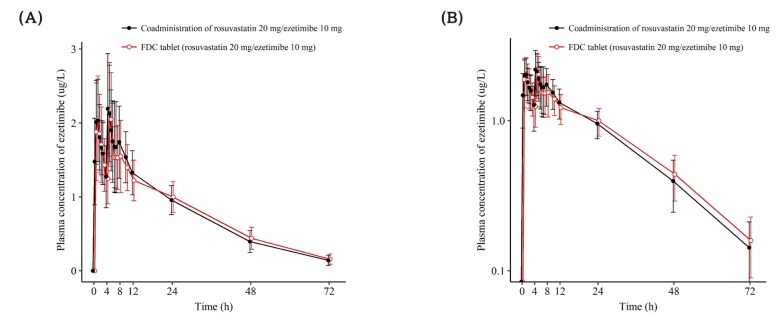 | Figure 3Mean ± SD plasma concentration-time profiles of ezetimibe after a single oral administration of fixed dose combination tablet (rosuvastatin 20 mg / ezetimibe 10 mg) or coadministration of rosuvastatin 20 mg and ezetimibe 10 mg. FDC = fixed dose combination. (A) linear scale (B) semi-log scale.
|
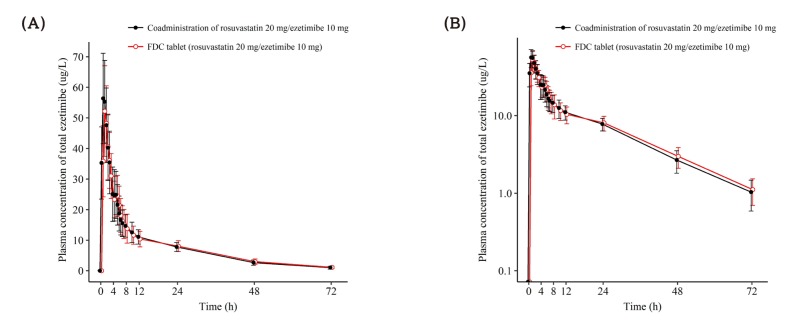 | Figure 4Mean ± SD plasma concentration-time profiles of total ezetimibe after a single oral administration of fixed dose combination tablet (rosuvastatin 20 mg / ezetimibe 10 mg) or coadministration of rosuvastatin 20 mg and ezetimibe 10 mg. FDC = fixed dose combination. (A) linear scale (B) semi-log scale.
|
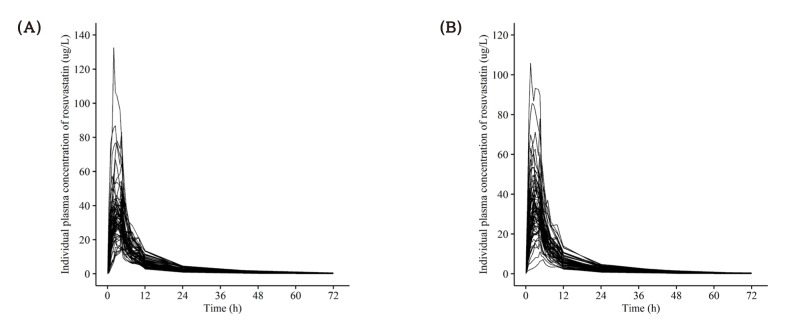 | Figure 5Individual concentration-time profile of rosuvastatin after a single oral administration of (A) fixed dose combination tablet (rosuvastatin 20 mg / ezetimibe 10 mg) and (B) coadministration of rosuvastatin 20 mg and ezetimibe 10 mg.
|
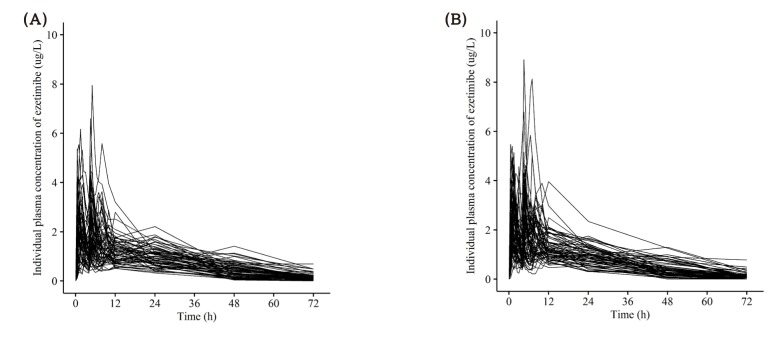 | Figure 6Individual concentration-time profile of ezetimibe after a single oral administration of (A) fixed dose combination tablet (rosuvastatin 20 mg / ezetimibe 10 mg) and (B) coadministration of rosuvastatin 20 mg and ezetimibe 10 mg.
|
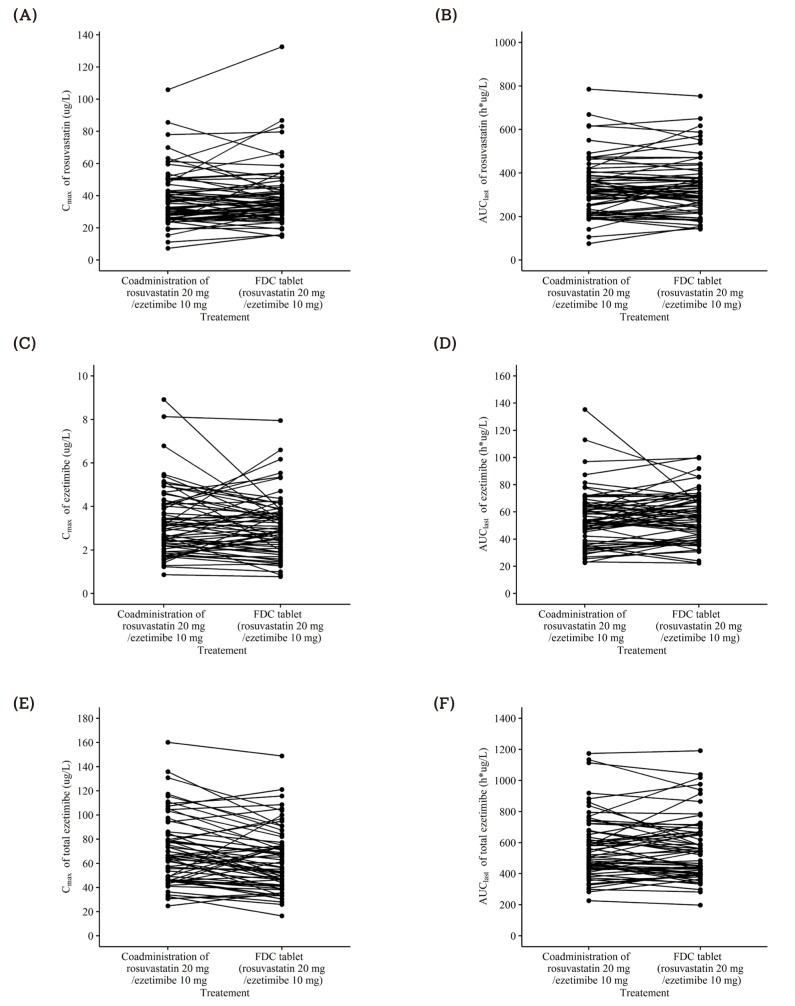 | Figure 7Individual (A) Cmax and (B) AUClast of rosuvastatin, (C) Cmax and (D) AUClast of ezetimibe, (E) Cmax and (F) AUClast of total ezetimibe after a single oral administration of fixed dose combination tablet (rosuvastatin 20 mg / ezetimibe 10 mg) or coadministration of rosuvastatin 20 mg and ezetimibe 10 mg. FDC = fixed dose combination.
|
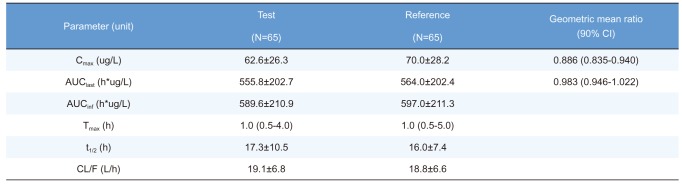
Table 1
Summary of pharmacokinetic parameters of rosuvastatin after a single oral administration of fixed-dose combination tablet (rosuvastatin 20 mg / ezetimibe 10 mg) or individual tablets (rosuvastatin 20 mg + ezetimibe 10 mg)
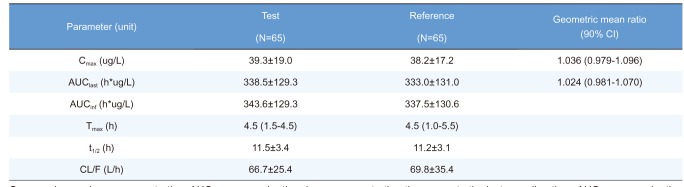
Cmax, maximum plasma concentration; AUClast, area under the plasma concentration-time curve to the last sampling time; AUCinf, area under the plasma concentration time-curve to infinity; tmax, time to Cmax; t1/2, elimination half-life; CL/F = apparent clearance.
Pharmacokinetic parameters are expressed as mean ± SD except for Tmax, which is expressed as median (range).
![]()
Table 2
Summary of pharmacokinetic parameters of ezetimibe after a single oral administration of fixed-dose combination tablet (rosuvastatin 20 mg / ezetimibe 10 mg) or individual tablets (rosuvastatin 20 mg + ezetimibe 10 mg)

Cmax, maximum plasma concentration; AUClast, area under the plasma concentration-time curve to the last sampling time; AUCinf, area under the plasma concentration time-curve to infinity; tmax, time to Cmax; t1/2, elimination half-life; CL/F, apparent clearance.
Pharmacokinetic parameters are expressed as mean ± SD except for Tmax, which is expressed as median (range).
*n=63, the elimination rate constant of two subjects cannot be calculated.
![]()
Table 3
Summary of pharmacokinetic parameters of total ezetimibe after a single oral administration of fixed-dose combination tablet (rosuvastatin 20 mg / ezetimibe 10 mg) or individual tablets (rosuvastatin 20 mg + ezetimibe 10 mg)
Cmax, maximum plasma concentration; AUClast, area under the plasma concentration-time curve to the last sampling time; AUCinf, area under the plasma concentration time-curve to infinity; tmax, time to Cmax; t1/2, elimination half-life; CL/F, apparent clearance.
Pharmacokinetic parameters are expressed as mean ± SD except for Tmax, which is expressed as median (range).
![]()
 XML Download