Journal List > J Nutr Health > v.49(6) > 1094488

Bae: Evaluation of dietary intake in Korean adults according to energy intake from eating-out: Based on 2013~2014 Korea National Health and Nutrition Examination Survey

Abstract

Purpose

The objective of the present study was to evaluate nutrient and food group intakes in Korean adults according to energy intake from eating-out.

Methods

This study was a cross-sectional study based on the 2013~2014 Korea National Health and Nutritional Examination Survey, and study subjects were 5,186 males (2,151) and females (3,035) aged 19~64 years. Energy intake from eating-out was analyzed using the 24-hour dietary recall method, and groups were classified by quartile according to energy intake from eating-out.

Results

Subjects who had more energy intake from eating-out tended to be younger, highly educated, have a higher income, and have higher alcohol consumption. Total energy intake and fat intake density of the highest quartile group of energy intake from eating-out were higher than those of the other groups. However, fiber, vitamin B1, calcium, phosphorus, potassium, and iron intake density levels were significantly lower in the highest quartile group of energy intake from eating-out. The highest quartile group of energy intake from eating-out consumed significantly more meat and beverages compared to the other groups. In addition, regarding diet quality (Index of nutritional quality), significantly lower vitamin B1, calcium, phosphorus, and iron levels were observed in the highest quartile group of energy intake from eating-out compared to those in the other groups.

Conclusion

In conclusion, in Korean adults, consumption of eating-out decreased dietary quality, including vitamin B1, calcium, phosphorus, and iron levels. Further studies are needed to confirm these findings.

Figures and Tables

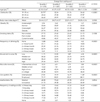
Table 1

General characteristics by categories of energy from eating-out among male adults
jnh-49-482-i001

1) Data represent mean ± SE. 2) %

Body mass index variable has been age-adjusted.

*p < 0.05 Significance between Quartile 4 and Quartile 3 at α = 0.05 by Tukey-Kramer method

#p < 0.05 Significance between Quartile 4 and Quartile 2 at α = 0.05 by Tukey-Kramer method

p < 0.05 Significance between Quartile 4 and Quartile 1 at α = 0.05 by Tukey-Kramer method

Table 2

General characteristics by categories of eating-out among female adults

jnh-49-482-i002

1) Data represent mean ± SE. 2) %

Body mass index variable has been age-adjusted.

*p < 0.05 Significance between Quartile 4 and Quartile 3 at α = 0.05 by Tukey-Kramer method

#p < 0.05 Significance between Quartile 4 and Quartile 2 at α = 0.05 by Tukey-Kramer method

p < 0.05 Significance between Quartile 4 and Quartile 1 at α = 0.05 by Tukey-Kramer method

Table 3

Energy and nutrient intakes per 1,000 kcal by categories of energy from eating-out among male adults

jnh-49-482-i003

1) Data represent mean ± SE. 2) Distribution of the subjects 3) Hyper nutrition: energy intake ≥ 125% EER and fat intake > acceptable macronutrient distribution ranges (AMDR) 4) %

All variables have been age-adjusted.

*p < 0.05 Significance between Quartile 4 and Quartile 3 at α = 0.05 by Tukey-Kramer method

#p < 0.05 Significance between Quartile 4 and Quartile 2 at α = 0.05 by Tukey-Kramer method

p < 0.05 Significance between Quartile 4 and Quartile 1 at α = 0.05 by Tukey-Kramer method

Table 4

Energy and nutrient intakes per 1,000 kcal by categories of energy from eating-out among female adults

jnh-49-482-i004

1) Data represent mean ± SE. 2) Distribution of the subjects 3) Hyper nutrition: energy intake ≥ 125% EER and fat intake > acceptable macronutrient distribution ranges (AMDR) 4) %

All variables have been age-adjusted.

*p < 0.05 Significance between Quartile 4 and Quartile 3 at α = 0.05 by Tukey-Kramer method

#p < 0.05 Significance between Quartile 4 and Quartile 2 at α = 0.05 by Tukey-Kramer method

p < 0.05 Significance between Quartile 4 and Quartile 1 at α = 0.05 by Tukey-Kramer method

Table 5

Eating-out food intakes percentage from each food group by categories of energy from eating-out among male adults

jnh-49-482-i005

1) Data represent mean ± SE.

All variables have been age-adjusted.

*p < 0.05 Significance between Quartile 4 and Quartile 3 at α = 0.05 by Tukey-Kramer method

#p < 0.05 Significance between Quartile 4 and Quartile 2 at α = 0.05 by Tukey-Kramer method

p < 0.05 Significance between Quartile 4 and Quartile 1 at α = 0.05 by Tukey-Kramer method

Table 6

Eating-out food intakes percentage from each food group by categories of energy from eating-out among female adults

jnh-49-482-i006

1) Data represent mean ± SE.

All variables have been age-adjusted.

*p < 0.05 Significance between Quartile 4 and Quartile 3 at α = 0.05 by Tukey-Kramer method

#p < 0.05 Significance between Quartile 4 and Quartile 2 at α = 0.05 by Tukey-Kramer method

p < 0.05 Significance between Quartile 4 and Quartile 1 at α = 0.05 by Tukey-Kramer method

Table 7

Index of Nutritional Quality (INQ) by categories of energy from eating-out among male adults

jnh-49-482-i007

1) Data represent mean ± SE.

All variables have been age-adjusted.

*p < 0.05 Significance between Quartile 4 and Quartile 3 at α = 0.05 by Tukey-Kramer method

#p < 0.05 Significance between Quartile 4 and Quartile 2 at α = 0.05 by Tukey-Kramer method

p < 0.05 Significance between Quartile 4 and Quartile 1 at α = 0.05 by Tukey-Kramer method

Table 8

Index of Nutritional Quality (INQ) by categories of energy from eating-out among female adults

jnh-49-482-i008

1) Data represent mean ± SE.

All variables have been age-adjusted.

*p < 0.05 Significance between Quartile 4 and Quartile 3 at α = 0.05 by Tukey-Kramer method

#p < 0.05 Significance between Quartile 4 and Quartile 2 at α = 0.05 by Tukey-Kramer method

p < 0.05 Significance between Quartile 4 and Quartile 1 at α = 0.05 by Tukey-Kramer method

Notes

This work was supported by Shinhan University Research Fund, 2016.

References

1. Han KS, Seo KM, Park HN, Hong SY. Issues of Korean restaurant industry by content analysis of food yearly statistics. J Korean Soc Food Cult. 2004; 19(3):313–325.
2. Lee SL. The effect of household demographic trend on food expenditure pattern. J Consum Cult. 2014; 17(3):85–104.
3. Ministry of Health and Welfare. Korea Centers for Disease Control and Prevention. Korea Health Statistics 2014: Korea National Health and Nutrition Examination Survey (KNHANES VI-2). Cheongju: Korea Centers for Disease Control and Prevention;2015.
4. Kant AK, Graubard BI. Eating out in America, 1987-2000: trends and nutritional correlates. Prev Med. 2004; 38(2):243–249.
crossref
5. Guthrie JF, Lin BH, Frazao E. Role of food prepared away from home in the American diet, 1977-78 versus 1994-96: changes and consequences. J Nutr Educ Behav. 2002; 34(3):140–150.
crossref
6. Clemens LH, Slawson DL, Klesges RC. The effect of eating out on quality of diet in premenopausal women. J Am Diet Assoc. 1999; 99(4):442–444.
7. Lachat C, Nago E, Verstraeten R, Roberfroid D, Van Camp J, Kolsteren P. Eating out of home and its association with dietary intake: a systematic review of the evidence. Obes Rev. 2012; 13(4):329–346.
crossref
8. Chung YS, Yang IS, Ham S. Customer' perceptions of motivators, barriers, and expansion of menu labeling in restaurants. J Korean Soc Food Cult. 2015; 30(2):190–196.
crossref
9. Yoo JN, Jeong HS. Consumer awareness of nutrition labelling in restaurants according to level of health consciousness. Korean J Food Nutr. 2011; 24(3):282–290.
crossref
10. Lee CH, Oh ST. Changes in dining out consumption behaviors by sociodemographic characteristics of people over 50 years and elderly in Korea: analysis of data from the Korea National Health and Nutrition Examination Surveys of 2001 and 2011. J East Asian Soc Diet Life. 2014; 24(3):301–314.
crossref
11. Oh HJ, Yoon J, Jeong HS. Influence of SNS usage characteristics on consumers' dine-out motivation, restaurant satisfaction, and quality of life. Korean J Food Nutr. 2014; 27(6):1182–1192.
crossref
12. Kwon YS, Ju SY. Trends in nutrient intakes and consumption while eating-out among Korean adults based on Korea National Health and Nutrition Examination Survey (1998-2012) data. Nutr Res Pract. 2014; 8(6):670–678.
crossref
13. Koo S, Park K. Dietary behaviors and lifestyle characteristics related to frequent eating out among Korean adults. J Korean Soc Food Sci Nutr. 2014; 42(5):705–712.
crossref
14. Kwon YS, Park YH, Choe JS, Yang YK. Investigation of variations in energy, macronutrients and sodium intake based on the places meals are provided: using the Korea National Health and Nutrition Examination Survey (KNHANES, 1998-2009). Nutr Res Pract. 2014; 8(1):81–93.
crossref
15. Bak H, Kim HS. A study of association dining-out, nutritional intakes and health risk factors among Korean women using the data of Korean National Health and Nutrition Examination Survey (KNHANES). Korean J Culinary Res. 2015; 21(5):139–146.
16. Chung SJ, Kang SH, Song SM, Ryu SH, Yoon J. Nutritional quality of Korean adults' consumption of lunch prepared at home, commercial places, and institutions: analysis of the data from the 2001 National Health and Nutrition Survey. Korean J Nutr. 2006; 39(8):841–849.
17. Hansen RG. An index of food quality. Nutr Rev. 1973; 31(1):1–7.
crossref
18. Ministry of Health and Welfare (KR). The Korean Nutrition Society. Dietary reference intakes for Koreans 2015. Sejong: Ministry of Health and Welfare;2016.
19. Lee JW. Effects of frequent eating-out and breakfast skipping on body mass index and nutrients intake of working male adults: analysis of 2001 Korea National Health and Nutrition Survey data. Korean J Community Nutr. 2009; 14(6):789–797.
20. Vandevijvere S, Lachat C, Kolsteren P, Van Oyen H. Eating out of home in Belgium: current situation and policy implications. Br J Nutr. 2009; 102(6):921–928.
crossref
21. Bes-Rastrollo M, Basterra-Gortari FJ, Sánchez-Villegas A, Marti A, Martínez JA, Martínez-González MA. A prospective study of eating away-from-home meals and weight gain in a Mediterranean population: the SUN (Seguimiento Universidad de Navarra) cohort. Public Health Nutr. 2010; 13(9):1356–1363.
crossref
22. Adams J, Goffe L, Brown T, Lake AA, Summerbell C, White M, Wrieden W, Adamson AJ. Frequency and socio-demographic correlates of eating meals out and take-away meals at home: cross-sectional analysis of the UK national diet and nutrition survey, waves 1-4 (2008-12). Int J Behav Nutr Phys Act. 2015; 12(1):51.
crossref
23. Lee WJ, Kim HC, Oh SM, Choi DP, Cho J, Suh I. Factors associated with a low-sodium diet: the Fourth Korean National Health and Nutrition Examination Survey. Epidemiol Health. 2013; 35:e2013005.
crossref
24. Méjean C, Macouillard P, Castetbon K, Kesse-Guyot E, Hercberg S. Socio-economic, demographic, lifestyle and health characteristics associated with consumption of fatty-sweetened and fatty-salted foods in middle-aged French adults. Br J Nutr. 2011; 105(5):776–786.
crossref
25. Lampuré A, Schlich P, Deglaire A, Castetbon K, Péneau S, Hercberg S, Méjean C. Sociodemographic, psychological, and lifestyle characteristics are associated with a liking for salty and sweet tastes in French adults. J Nutr. 2015; 145(3):587–594.
crossref
26. Kim MG, Kim KY, Nam HM, Hong NS, Lee YM. The relationship between lifestyle and sodium intake in Korean middle-aged workers. J Korea Acad Ind Coop Soc. 2014; 15(5):2923–2929.
crossref
27. Choi KH, Park MS, Kim JA, Lim JA. Associations between excessive sodium intake and smoking and alcohol intake among Korean men: KNHANES V. Int J Environ Res Public Health. 2015; 12(12):15540–15549.
crossref
28. Sorenson AW, Wyse BW, Wittwer AJ, Hansen RG. An index of nutritional quality for a balanced diet. New help for an old problem. J Am Diet Assoc. 1976; 68(3):236–242.
29. Binkley JK, Eales J, Jekanowski M. The relation between dietary change and rising US obesity. Int J Obes Relat Metab Disord. 2000; 24(8):1032–1039.
crossref
30. Orfanos P, Naska A, Trichopoulos D, Slimani N, Ferrari P, van Bakel M, Deharveng G, Overvad K, Tjønneland A, Halkjaer J, Santucci de Magistris M, Tumino R, Pala V, Sacerdote C, Masala G, Skeie G, Engeset D, Lund E, Jakszyn P, Barricarte A, Chirlaque MD, Martinez-Garcia C, Amiano P, Quirós JR, Bingham S, Welch A, Spencer EA, Key TJ, Rohrmann S, Linseisen J, Ray J, Boeing H, Peeters PH, Bueno-de-Mesquita HB, Ocke M, Johansson I, Johansson G, Berglund G, Manjer J, Boutron-Ruault MC, Touvier M, Clavel-Chapelon F, Trichopoulou A. Eating out of home and its correlates in 10 European countries. The European Prospective Investigation into Cancer and Nutrition (EPIC) study. Public Health Nutr. 2007; 10(12):1515–1525.
crossref
TOOLS
Similar articles