

 PDF
PDF ePub
ePub Citation
 Print
Print


INTRODUCTION
Mesenchymal stem cells (MSCs) are multipotent cells that can expanded ex vivo and induced in vitro or in vivo to terminally differentiate into multiple lineage cells that include osteocytes, chondrocytes, and adipocytes [12]. Stem cells located in bone marrow, around blood vessels, fat, skin, tooth, and other niches are crucial in tissue repair [13]. MSCs from different tissues are distinct biologically [4]. For example, MSCs derived from bone marrow show a higher potential for osteogenic differentiation, while MSCs of synovial origin show a greater tendency toward chondrogenic differentiation [56]. The recent use of autologous or allogenic stem cells has been suggested as an alternative therapeutic approach for treatment of diseases, and represents a promising resource for different tissue engineering and cell-based therapies [7].
Bone marrow is a hypoxic environment in which the oxygen tension ranges from 1 to 7%. Thus, MSCs should be cultured under hypoxic and normoxic conditions and the findings compared to determine the effects of bone marrow niche of MSCs [8]. However, it is not easy to simulate the in vivo hypoxic environment in culture. This information is important given the burgeoning interest in regenerative medicine for tissue ischemia events like cardiac arrest and transplantation failure [9]. Several studies have addressed the effects of hypoxia on MSCs. The findings have been equivocal [101112]. Some reports demonstrated that human bone marrow-derived MSCs cultured under hypoxia showed a diminished capacity to differentiate into adipocytes and osteocytes, supporting the notion that low oxygen tension promotes an undifferentiated state [1314]. But, other reports demonstrated that MSCs expanded under reduced oxygen tension and were primed for chondrogenic differentiation [1516]. In addition, hypoxic conditions promote chondrogenic differentiation and enhance cartilage protein synthesis through the upregulation of Sox9, type II collagen, and aggrecan [1617]. Moreover, a recent report demonstrated that hypoxic culture conditions promote chondrogenic, osteogenic, and adipogenic differentiation, and that hypoxic cells show an increased bone repairing ability in vivo [2]. The oxygen concentration in culture is a crucial factor that can significantly influence the proliferation and differentiation potentials of MSCs [1819]. The role of hypoxia in the differentiation of MSCs remains unclear.
CoCl2 reportedly induces molecular responses similar to low-oxygen conditions in mammalian systems [20]. The lack of oxygen can create a potentially lethal environment and limits cellular respiration and growth. Alternatively, lack of oxygen can enhance the production of the specific extracellular matrix components and increase angiogenesis through the hypoxia-inducible factor (HIF)-1 pathway [21]. Under normoxic conditions, enzymes including prolyl hydroxylase (PHD) and HIF prolyl hydroxylase (HPH) mediate ubiquitin protease pathway, and degrade HIF-1α simultaneously. However, cobalt (Co) in CoCl2 replaces iron (Fe) in PHDs as a chelating agent and makes them unable to combine with HIF-1α for degradation. Thus, transcriptionally stabilized HIF-1α complexes are accumulated, which can activate HIF-1α signaling. Therefore, CoCl2 has been widely used as a hypoxia-mimicking agent in vivo [22] and in vitro [23]. However, the precise role of CoCl2 in the regulation of MSCs remains unclear.
The aim of this study was to elucidate the potential role of CoCl2 by examining the effects of CoCl2 exposure on lineage differentiation of C3H/10T1/2 cells including osteogenic, chondrogenic and adipogenic capacity, and to understand the possible molecular mechanisms of CoCl2 during in vitro culture.
Go to : 
METHODS
Cell culture
Murine C3H/10T1/2 MSCs were maintained in Dulbecco's modified Eagle's medium (DMEM; Gibco BRL, Grand Island, NY, USA) containing 10% fetal bovine serum (FBS; Gibco BRL) and 100 U/ml penicillin and 100 mg/ml streptomycin (Gibco BRL). The cells were incubated at 37℃ in an atmosphere containing 5% CO2. CoCl2 was purchased from Sigma-Aldrich (St Louis, MO, USA) dissolved in DMEM containing 2% FBS immediately before use.
Cell viability assay
The 3-(4,5-dimethylthiazol-2-yl)-2,5-diphenyltetrazolium bromide (MTT)-based EZ-Cytox assay (Daeil Lab Service, Seoul, South Korea) was used to measure cell viability. C3H/10T1/2 cells were seeded in 96-well culture plates at a density of 0.5×10⁴ cells/100 ml in each well and pre-incubated in growth medium for 24 h at 37℃ and 5% CO2. The culture medium was changed to fresh DMEM containing 2% FBS and 1% antibiotics, and treated with 0.1~5 mM CoCl2. After 24 h, each well was washed twice with phosphate buffered saline (PBS), and 0.5 ml of medium and 50 µl of a 5 mg/ml PBS solution of MTT (Invitrogen, Carlsbad, CA, USA) was added. After 3-h incubation, the MTT-containing medium was removed and 250 µl dimethylsulfoxide (DMSO; Invitrogen) was added. The absorbance of the reaction solution was measured at 570 nm using a Microplate ELISA Autoreader (BIO-Tek Instruments, Winooski, VT, USA). The reported value represents the average of three independent experiments.
Reverse transcriptase-polymerase chain reaction (RT-PCR) and real-time quantitative RT-PCR (qRT-PCR)
Total cellular RNA was prepared using TRIzol reagent (Invitrogen) according to the manufacturer's instructions. Complementary DNA (cDNA) was synthesized with 5 µg RNA using an AccPower RT PreMix kit (Bioneer, Daejeon, Korea) at 45℃ for 60 min, and then at 95℃ for 5 min. After cDNA synthesis, primers were added and PCR was performed in a SuperCycler™ apparatus (Kyratec, Queensland, Australia) using 30 cycles of 94℃ for 5 min, 94℃ for 30 sec, 60℃ for 30 sec and 72℃ for 30 sec, followed by 72℃ for 5 min. Preliminary experiments were performed to determine the optimum number of PCR cycles. PCR products were analyzed by 1.5% agarose gel electrophoresis and visualized with SYBR® Green nucleic acid gel stain (Invitrogen). Primer sequences used are shown in Table 1. qRT-PCR was performed using cDNA and specific primers as the template in a 20 µl reaction mixture containing 2×QuantiMix SYBR (PKT, Seoul, Korea). Analysis was carried out using the software supplied with the one-step, real-time PCR System machine (Applied Biosystems, Franklin Lakes, NJ, USA), with each expression calculated relative to mouse β-actin (delta CT) and controls (delta delta CT) using the fluorescence threshold for the amplification reaction and the comparative CT method.
Western blot analysis
C3H/10T1/2 cells were plated at a density of 2×10⁶ cells in 60-mm culture dishes with DMEM containing 10% FBS and 1% antibiotics. After 24 h, the medium was changed to DMEM supplemented with 2% FBS and 1% antibiotics, and exposed to 0.1 mM CoCl2. At the indicated times, medium was removed and adherent cells were washed twice with PBS, homogenized in lysis buffer (Cell Signaling Technology, Beverly, MA, USA), and centrifuged at 13,000 rpm for 10 min at 4℃. Protein quantification was performed with BCA protein assay (Bio-Rad, Hercules, CA, USA). Total protein was resolved by 10% sodium dodecyl sulfate polyacrylamide gel electrophoresis (SDS-PAGE) and the resolved proteins were electrophoretically transferred to a polyvinylidene difluoride (PVDF) membrane. After blocking in Tris-buffered saline containing 5% skim milk and 0.1% Tween-20 (TBS-T), the membrane was incubated with a specific primary antibody to HIF-1α (diluted 1:1000; R&D Systems, Minneapolis, MN, USA) or actin (diluted 1:5000; Sigma-Aldrich) diluted 1:1,000 in 5% bovine serum albumin or skim milk in TBS-T by gentle agitation overnight at 4℃. After washing with TBS-T, each blot was incubated with anti-mouse secondary antibody (1:5,000 dilution; Cell Signaling Technology) at room temperature for 1 h. The membrane was then washed with TBS-T (3×10 min). The antigen-antibody complexes were visualized with West-ZOL® (plus) (iNtRON Biotechnology, Sungnam, Korea) detection reagent using a LAS-4000 mini imager (Fuji Film, Tokyo, Japan).
Osteogenic induction
C3H/10T1/2 cells were plated at a density of 2×10⁵ cells/plate in 35-mm culture dishes with DMEM containing 10% FBS and 1% antibiotics. After 24 h, the cells were cultured with 0.1 mM CoCl2 for 24 or 48 h, and the medium was replaced with an osteogenic medium comprised of DMEM with 10% FBS, 5 mM β-glycerophosphate (β-GP), 50 µg/ml L-ascorbic acid 2-phosphate, 200 µg/ml bone morhogenic protein 2 (BMP2; Cowellmedi, Seoul, Korea) in the presence or absence of 0.1 mM CoCl2. The osteogenic medium was replaced every 3 days. After 18 days of osteogenic differentiation, cells were washed with PBS, fixed with 70% ethanol, and treated with 40 mM Alizarin red S solution (Sigma-Aldrich) for 10 min to stain the calcium deposits. The stained cultures were photographed, and the Alizarin red S was extracted using 10% (w/v) cetylpyridinium chloride (CPC; Sigma-Aldrich) in 10 mM sodium phosphate (pH 7.0). To quantify Alizarin red S staining results, the optical density (OD) was measured spectrophotometrically at 570 nm using an ELISA reader (BIO Tek Instruments).
Chondrogenic induction
C3H/10T1/2 cells were incubated at 2×10⁵ cells/plate and allowed to adhere overnight. The cells were cultured in DMEM containing 2% FBS in the presence of 0.1 mM CoCl2 for 24 or 48 h. Cells were harvested by centrifugation in a 15 ml polypropylene tube, and the pellets were cultured in a chondrogenic medium (Gibco BRL) for 3, 7, 10, and 14 days. The chondrogenic medium was replaced every 3 days. Alcian blue staining was used to detect chondrocyte nodule formation after 14 days of culture. Cells in micromass culture were rinsed with PBS and fixed in 10% formaldehyde in PBS for 20 min. Cultures were washed with water three times and stained in 1% Alcian blue (Sigma-Aldrich) with 3% glacial acetic acid for 24 h. Cultures were de-stained in 70% ethanol two times and stored in water for image capture.
Adipogenic induction
Cells were seeded on 24-well plates at 2×10⁴ cells/well and exposed to 0.1 mM CoCl2 for 24 or 48 h. To induce adipogenic differentiation, C3H/10T1/2 cells were incubated in 0.05 mM indomethacin, 0.1 µM dexamethasone, and 5 µg insulin (Sigma-Aldrich) for 5 days. Cells were stained with 60% saturated oil red O solution (Sigma-Aldrich) for 20 min, washed with PBS, and fixed in 4% formalin in PBS for 30 min. The formalin was removed and the fixed cells were washed twice with PBS. To quantify the degree of lipid accumulation, cells were incubated with isopropanol to extract lipid and the oil red O staining intensity was quantified at 570 nm using an ELISA reader (BIO Tek Instruments).
Statistical analysis
Statistical analysis was performed using a two-tailed t-test with GraphPad Prism 4.0 for Windows (GraphPad Software, San Diego, CA, USA). A p-value<0.05 indicated statistical significance. All values are expressed as the mean±standard deviation obtained from three independent experiments.
Go to :
RESULTS
Time- and dose-dependent viability kinetics of CoCl2 treated C3H/10T1/2 cells
To examine the effect of CoCl2 on viability of C3H/10T1/2 cells, the MTT-based assay was performed after incubation with 0.1~5 mM CoCl2 for 2 days. CoCl2 did not affect the viability of MSC cells concentrations <0.25 mM (Fig. 1A), while viability decreased in a dose-dependent manner at 0.5, 1, and 5 mM CoCl2. The time-dependent effect of CoCl2 on cell viability was ascertained 24, 48, 72, and 96 h after adding CoCl2. CoCl2 concentrations of 0.1 and 0.25 mM were not cytotoxic (Fig. 1B). Therefore, 0.1 mM CoCl2 was used for experiments.
 | Fig. 1Effects of CoCl2 on cell viability of C3H/10T1/2 cells.C3H/10T1/2 cells were cultured in the 2% serum medium in the presence of different CoCl2 concentrations for 48 h (A) and in the presence of 0.1 or 0.25 mM CoCl2 for a designated time (B). Cell viability was determined by the MTT assay. Each value is the mean±SD of triplicate independent experiments. *p<0.05, as compared to control.
|
CoCl2 increases expressions of HIF-1α and VEGF
The transition metal cobalt mimics hypoxia by stabilizing HIF-1α, a marker of hypoxia [24]. To confirm CoCl2-mediated hypoxia, mRNA expression of HIF-1α and VEGF were evaluated by RT-PCR after CoCl2 treatment for 6, 12, 24, and 48 h. Expression of HIF-1α mRNA was significantly increased at 24 h compared to the control (Fig. 2A). qRT-PCR revealed that the gradual increase of HIF-1α mRNA in CoCl2 treated samples (Fig. 2B). To investigate the protein level change of HIF-1α by CoCl2 treatment, Western blot was carried out. Protein levels of HIF-1α were significantly enhanced in a time-dependent manner (Fig. 2C). It could be concluded that CoCl2 successfully mimicked hypoxic condition in vitro in cultured C3H/10T1/2 cells.
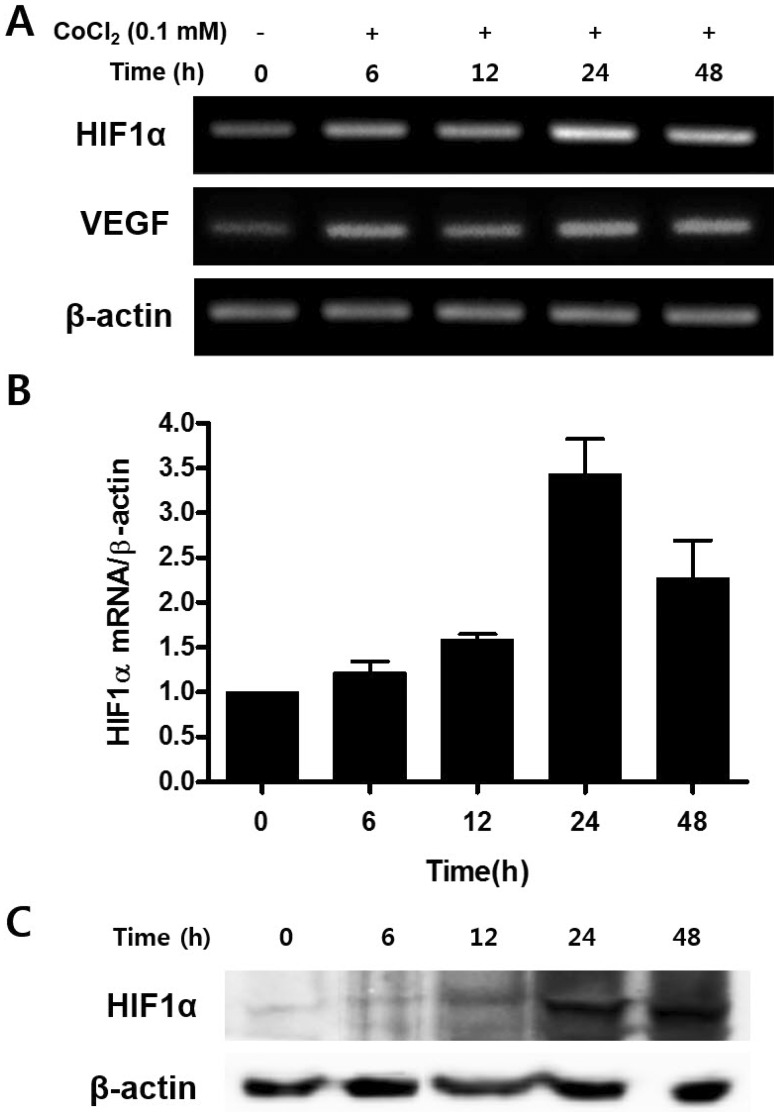 | Fig. 2Effect of CoCl2 in the expression of HIF-1α and VEGF mRNA.C3H/10T1/2 cells were seeded in 60-mm culture dishes at a density of 1×10⁵ cells and incubated in the growth medium containing 0.1 mM CoCl2 for 48 h. At the indicated times, total RNA and cell lysates were isolated and RT-PCR analysis (A), quantitative real time RT-PCR analysis (B), and Western blotting analysis (C) was done.
|
CoCl2 enhances osteogenic differentiation of C3H/10T1/2 cells
To determine whether CoCl2 treatment modulates osteoblastic differentiation, C3H/10T1/2 cells were pre-incubated with 0.1 mM CoCl2 for 0, 24, or 48 h, and mineralized nodule formation was assessed by Alizarin Red-S staining. CoCl2 significantly enhanced matrix mineralization, compared with control (Figs. 3A and 3B). RT-PCR revealed the significant up-regulation of the expression of osteogenic markers type I collagen (Col I), alkaline phosphatase (ALP), and Runt-related transcription factor 2 (Runx2) in CoCl2 treated group compared with control. Expressions of osteocalcin (OCN) and osteopontin (OPN) mRNA were slightly affected by treatment of CoCl2 (Fig. 3C). To assess the effect of CoCl2 during osteoblast differentiation, qRT-PCR analysis was carried out to assess the gene expression of the osteogenic markers OCN, OPN, ALP, Runx2, and Col I. In pre-incubation with CoCl2 for 24 h, OCN mRNA expression was increased about 2- and 1.5-fold in CoCl2 treatment cells after 7 and 10 days, respectively. Also, the mRNA expression of OPN increased about 3.9-fold and ALP increased about 9-fold in the treatment group after 10 days at 24 h of CoCl2 incubation sample. However, the expression level of Runx2 and Col I mRNA had no statistically significant variation (Fig. 3D). These results indicate that treatment of CoCl2 partially enhances osteogenic differentiation and matrix mineralization on C3H/10T1/2 cells.
 | Fig. 3Effects of treatment of CoCl2 on osteogenic differentiation.(A) C3H/10T1/2 cells were pre-incubated with 0.1 mM CoCl2 for 0 h, 24 h or 48 h. After incubation, the cells were replaced with osteogenic medium and cultured for 18 days, prior to staining with Alizarin red S. (B) Results from (A) were quantified by spectrophotometry. (C) C3H/10T1/2 cells were preincubated with 0.1 mM CoCl2 for 0 h, 24 h, or 48 h. After incubation, cells were cultured with osteogenic medium for 3 days. Total cellular RNA was extracted, and gene expression of osteogenic markers was detected by semi-quantitative RT-PCR. Expression of actin was examined in the same sample as a control for the amount of present reverse-transcribed cDNA. (D) Effects of treatment of CoCl2 during osteoblast differentiation. C3H/10T1/2 cells were pre-incubated with 0.1 mM CoCl2 for 0 h, 24 h, or 48 h. After incubation, the cells were cells were replaced with an osteogenic medium and cultured for 10 days. At indicated times, total cellular RNA was extracted and gene expression of osteogenic markers was assessed by qRT-PCR. Values shown are normalized to β-actin levels. The data represent the mean±S.D. from triplicate independent experiments (*p<0.05).
|
CoCl2 enhances chondrogenic differentiation of C3H/10T1/2 cells
To examine effects of hypoxia on chondrogenesis in vitro, C3H/10T1/2 cells were pre-incubated with 0.1 mM CoCl2 for 0, 24, or 48 h. After incubation, the cells were shifted to chondrogenic medium and cultured for 14 days. CoCl2 treatment was associated with increased Alcian blue staining compared to control (Fig. 4A). Gene expression of chondrocyte-specific markers was evaluated by RT-PCR. The SRY-box containing gene 9 (sox9), a key transcription factor for chondrocyte differentiation, was slightly increased at 24 h of CoCl2 incubation. The mRNA level of Aggrecan and type II collagen (Col 2A1), the downstream targets of Sox9, were significantly up-regulated in CoCl2 treated cells at 48 h of CoCl2 incubation (Fig. 4B). To assess the quantitative change of mRNA expression after CoCl2 treatment during chondrocyte differentiation, qRT-PCR analysis for the gene expression of the chondrogenic markers aggrecan, Sox9, and Col 2A1 was performed. Aggrecan and Sox9 mRNA level was significantly increased about 27-fold and 4-fold at 3 days after 48 h of CoCl2 treatment, respectively. Col2A1 mRNA level was also increased at 3 days after 24 or 48 h of CoCl2 treatment (Fig. 4C). These results indicated that treatment of CoCl2 partially enhances chondrogenic differentiation on C3H/10T1/2 cells.
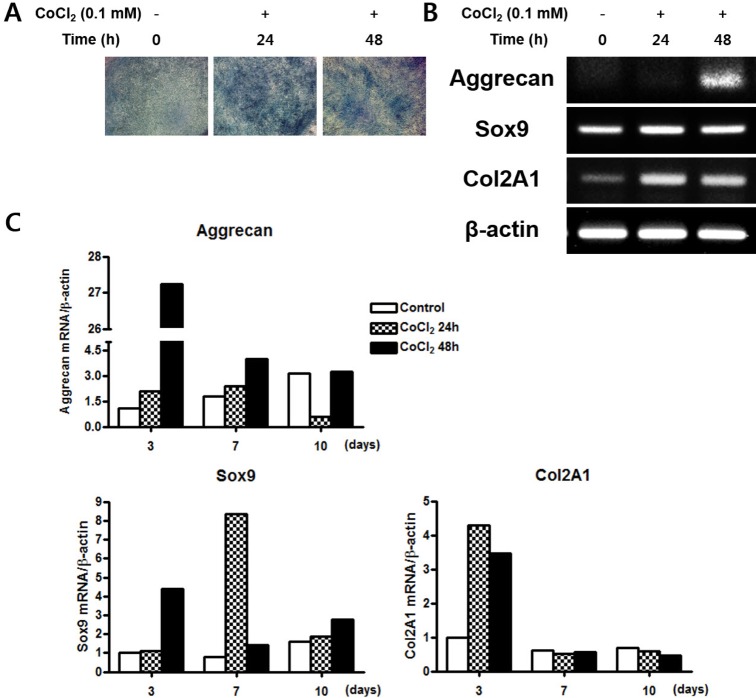 | Fig. 4Effects of treatment of CoCl2 on the chondrogenic differentiation.(A) C3H/10T1/2 cells were pre-incubated with 0.1 mM CoCl2 for 0 h, 24 h, or 48 h. After incubation, the cells shifted to a chondrogenic medium and cultured for 14 days. The cells were then stained with Alcian blue. (B) C3H/10T1/2 cells were pre-incubated with 0.1 mM CoCl2 for 0 h, 24 h, or 48 h. After incubation, the cells were shifted to a chondrogenic medium and cultured for 3 days. Total cellular RNA was extracted and gene expression of the chondrogenic markers aggrecan, sox9, and Col 2A1 was assessed by semi- quantitative RT-PCR. Expression of actin was examined in the same sample as a control for the amount of present reverse-transcribed cDNA. (C) Effects of treatment of CoCl2 during chondrocyte differentiation. C3H/ 10T1/2 cells were pre-incubated with 0.1 mM CoCl2 for 0 h, 24 h, or 48 h. After incubation, the cells were replaced with chondrogenic medium and cultured for 10 days. At indicated times, total cellular RNA was extracted and gene expression of the chondrogenic makers aggrecan, sox9, and Col 2A1 was assessed by qRT-PCR. Values shown are normalized to β-actin levels.
|
CoCl2 suppresses adipogenic differentiation of C3H/10T1/2 cells
To examine the effect of hypoxia on adipogenesis in vitro, C3H/10T1/2 cells were pre-treated with 0.1 mM CoCl2 for 0, 24, or 48 h. After 5 days incubation, lipid droplet was assessed by oil red O staining. Both of CoCl2 treated group significantly inhibited proliferation of cell and lipid formation compare to the control group (Fig. 5A and 5B). To determine whether hypoxic environment regulate the adipogenic differentiation, gene expression of adipocyte-specific markers was evaluated by RTPCR. The peroxisome proliferator-activated receptor γ (PPARγ), a key transcription factor for adipogenesis, was significantly decreased in both CoCl2 treatment groups. Moreover, the mRNA expression level of the downstream of PPARγ, adipocyte protein 2 (aP2) and CCAAT/enhancer binding protein alpha (C/EBPα), were also strongly down-regulated in treatment of CoCl2 group compared with the control (Fig. 5C). To assess the quantitative change of mRNA expression after CoCl2 treatment during adipogenic differentiation, qRT-PCR analysis was performed for adipogenic markers including PPARγ, aP2, and C/EBPα. The expression level of PPARγ mRNA was decreased in CoCl2 treatment group than control through all time points. Also, mRNA expression level of aP2 and C/EBPα were substantially decreased in CoCl2 treatment group at 5 days than control group, which markedly increased (Fig. 5D). These results indicate that treatment of CoCl2 partially suppresses adipogenic differentiation on C3H/10T1/2 cells.
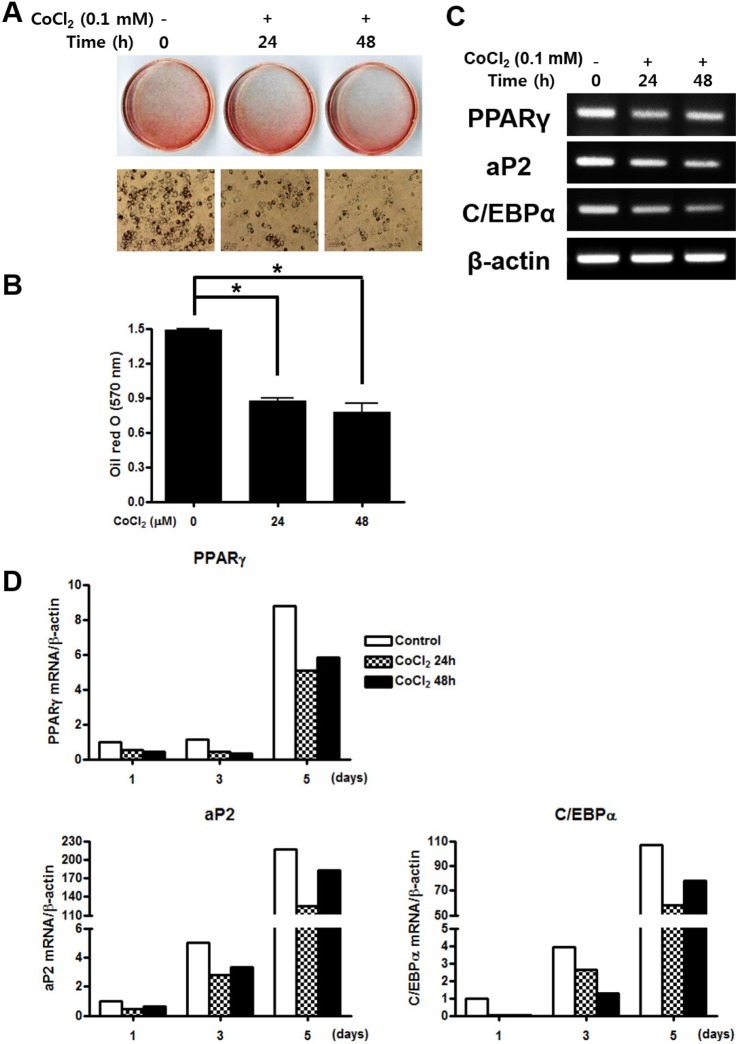 | Fig. 5Effects of treatment of CoCl2 on the adipogenic differentiation.(A) C3H/10T1/2 cells were pre-incubated with 0.1 mM CoCl2 for 0 h, 24 h, or 48 h. After incubation, the cells were cultured with adipogenic medium for 5 days then stained with Oil red s. (B) The degree of lipid accumulation as quantified by spectrophotometry. (C) Total cellular RNA was extracted and gene expression of the adipogenic markers PPARγ, aP2, and C/EBPα was assessed by semi-quantitative RT-PCR. Expression of actin was examined in the same sample as a control for the amount of present reverse-transcribed cDNA. (D) Effects of treatment of CoCl2 during adipocyte differentiation. C3H/10T1/2 cells were preincubated with 0.1 mM CoCl2 for 0 h, 24 h, or 48 h. After incubation, the cells were cells were replaced with adipogenic medium and cultured for 10 days. At indicated times, total cellular RNA was extracted and gene expression of the adipogenic makers PPARγ, aP2, and C/EBPα was analyzed by qRT-PCR. Values shown are normalized to β-actin levels. The data represent the mean±S.D. from triplicate independent experiments (*p<0.05).
|
Go to :
DISCUSSION
MSCs residing in the bone marrow are associated with hematopoietic stem cell functions and maintenance, and give rise to mesenchymal cell lineages including osteoblasts, chondrocytes, and adipocytes to maintain bone structures [25]. Their applicability to multiple therapeutic situations has also been investigated [926272829]. Additionally, the therapeutic potential of stem cells may be realized using tissue engineering approaches of developing biological tissue substitutes, and be useful at the time of implantation through in vitro cultivation [26]. Previous studies have shown that oxygen concentration can influence of differentiation on many types of stem cells [3031]. The present study investigated the differentiation potential of murine mesenchymal C3H/10T1/2 cells by hypoxia-mimetic CoCl2 towards osteogenic, chondrogenic and adipogenic lineage commitment.
Hypoxia induces the expression of HIF-1α [3032]. HIF-1α is the regulated part of the transcription factor heterodimer HIF-1 α/β, which complexes inside cells with another endogenous form of HIF [9]. Together these molecules enter the nucleus via an atypical hydrophobic and phosphorylation-dependent domain [8]. In the nucleus, these molecules act as transcription factors regulating gene expression. Under hypoxic conditions, HIF-1 binds to hypoxia response element in promoter regions, up-regulating certain genes involved in glucose metabolism, erythropoiesis, iron transport, control of vessel tone, and angiogenesis [33]. The major target gene for HIF-1α is vascular endothelial growth factor (VEGF); both molecules are critical regulators of angiogenic-osteogenic coupling [3435].
In this study, to confirm the hypoxia condition by CoCl2 treatment, expression of HIF-1α and VEGF mRNA and protein were evaluated by RT-PCR and Western blot. Treatment of CoCl2 led to increased HIF-1α and VEGF mRNA expression in C3H/10T1/2 cells. In addition, HIF-1α protein expression was increased in CoCl2 treated cells compared to the untreated control. Therefore, CoCl2 appears to be an effective chemical to examine for signaling pathways involved in oxygen sensing and is useful in hypoxia response in the regulation of differentiation of MSCs.
We induced osteogenic differentiation to assess the effects of temporary CoCl2 exposure on osteogenic capacity of MSCs. Pre-treatment of CoCl2 for both 24 h and 48 h enhanced matrix mineralization and expression levels of osteogenic markers including OCN, OPN, ALP, Col I, and Runx2. Previous studies have demonstrated that the proportion of osteogenenic cells under hypoxic conditions is greater than under normoxic conditions in vitro and in vivo [36]. These results suggest that temporary exposure to CoCl2 may accelerate osteoblastic differentiation and matrix mineralization from MSCs.
To investigate the chondrogenic capacity of MSCs on temporary CoCl2 exposure, we induced chondrogenic differentiation. CoCl2 pre-treatment enhanced chondrogenesis by Alcian blue staining and increased the expression levels of chondrogenic markers including SOX9 and Col2A1. Chondrogenic differentiation of hMSCs is very distinct in hypoxia and normoxia [10]. Rat MSCs reportedly show enhanced chondrogenesis after 1 week of hypoxia [3738]. Thus, temporary exposure to CoCl2 may accelerate chondrogenic differentiation from MSCs.
The effect of temporary CoCl2 exposure on adipogenic differentiation was investigated. Pre-treatment of CoCl2 for both 24 h and 48 h suppressed adipogenesis by oil red O staining and decreased expression levels of the adipogenic markers including PPARγ, aP2, and C/EBPα. These results suggest that temporary exposure to CoCl2 may attenuate adipogenic differentiation. Recent study revealed that the number of MSCs markedly declines and their adipogenic differentiation potential is reduced under hypoxic condition [39]. Similarly, Phorbol 12-myristate 13-acetate (PMA), a protein kinase C (PKC) activator treatment, increased osteogenic differentiation and suppressed adipogenic differentiation in human adipose-tissue-derived stromal cells (hADSCs) [40]. In addition, adipogenesis in human MSCs cultured for 2 weeks under hypoxic (less than 2% O2) condition was significantly suppressed than normoxic (approximately 18% O2) condition [14]. On the other hands, some study reported that cell proliferation and adipogenic differentiation of mouse MSCs are triggered in hypoxia [5]. These discrepancies suggest that the cell type and hypoxic culture conditions can influence the outcomes of adipogenic differentiation.
There are two ways that can explain how CoCl2 affects the mechanisms of MSCs differentiation. First, CoCl2 plays a role as a hypoxia-mimicking agent which triggers p38 MAPK pathway and affects the differentiation of MSCs [41]. Second, an unknown pharmacological reaction of CoCl2 might affect the MSCs differentiation. Though, these have not yet been clearly identified. Moreover, many studies demonstrated that variety of results can be obtained depending on the hypoxia inducing conditions.
Taken together, these results support the ability of MSCs to differentiate into osteoblasts, chondrocytes, and adipocytes in response to CoCl2, might act through in part, HIF-1α expression. Treatment of CoCl2 enhanced differentiation to osteoblasts and chondrocytes and suppressed differentiation to adipocytes. In this study, on the other hand, we analyzed the effects of CoCl2 on the MSCs differentiation by controlling the concentration and the duration of CoCl2 treatment. This study can become a meaningful reference for subsequent studies, for which proves that the MSCs differentiation can be adjusted and predicted more easily. However, potential differences between CoCl2 treatment and hypoxia incubation in differentiation of MSCs require further studies to determine the molecular mechanism of hypoxia in MSCs lineage commitment.
Go to :
 XML Download