

 PDF
PDF Citation
 Print
Print


INTRODUCTION
Uterine carcinosarcoma (UCS), also known as uterine malignant mixed Müllerian tumor, is a biphasic uterine malignancy comprising epithelial and mesenchymal elements. It has recently been categorized as a high-grade endometrial cancer, and most UCSs may arise from a monoclonal cell undergoing epithelial-to-mesenchymal metaplastic transformation [123]. While UCS is extremely rare, having an incidence rate of 2/100,000 females and comprising <5% of all uterine malignancies, it behaves more aggressively and is associated with poorer outcomes than high-grade endometrioid endometrial cancer [4567]. Approximately 60% of all patients with UCS present with extrauterine disease; further, 33%–55% of UCSs recur within 2 years of diagnosis, and the estimated 5-year survival rate is 20%–35% [489].
In a few retrospective studies, prognostic factors associated with recurrence and mortality rates of UCS are inconsistent and include cancer antigen 125 (CA-125) level, performance status, the International Federation of Gynecology and Obstetrics (FIGO) stage, myometrial invasion, lymphovascular space invasion, adnexal and serosal involvement, peritoneal cytology, pelvic lymphadenectomy, adjuvant therapy, and presence of a residual tumor of >1 cm [681011]. However, most of these prognostic factors can be assessed only by extensive surgical procedures. Preoperative noninvasive imaging modalities that can be used to identify high-risk patients with UCS would be useful for planning appropriate therapeutic strategies and predicting prognosis before surgery while avoiding comprehensive surgical procedures, particularly in patients with severe comorbidities or at high risks of postoperative complications. Further, such modalities would contribute to improved outcomes in patients with UCS [121314].
Among the currently available preoperative diagnostic tools, 18F-fluorodeoxyglucose (18F-FDG) positron emission tomography (PET)/computed tomography (CT) enables identification of an abnormal biological activity of cancer tissue based on 18F-FDG uptake. The maximum standardized uptake value (SUVmax) measured by 18F-FDG PET/CT, reflecting tumor aggressiveness, may be a predictor of poor prognosis in numerous malignancies [12]. Although primary UCS exhibits increased 18F-FDG uptake, similar to that exhibited in other endometrial cancers, the relationship between metabolic parameters measured by 18F-FDG PET/CT and oncological outcomes has rarely been studied [1516]. Our primary aim was to evaluate the prognostic value of metabolic parameters measured by 18F-FDG PET/CT in predicting the oncological outcomes of patients with UCSs.
MATERIALS AND METHODS
1. Patient population
Eighty-five patients were newly diagnosed with UCS at Asan Medical Center between September 2006 and May 2015, and 60 patients underwent preoperative 18F-FDG PET/CT and surgical staging. Among them, 5 patients who showed no residual tumor in a hysterectomy specimen after endometrial biopsy (n=3) or immeasurable SUVmax on 18F-FDG PET/CT (n=1), or who underwent incomplete surgical procedure (n=1) were excluded, and the data of 55 patients were analyzed retrospectively. No patient received neoadjuvant chemotherapy or preoperative radiotherapy or had other malignancies or underlying diseases that could affect survival. The present study overlapped in subjects (52/55) from our prior publication [17]. Demographic and clinicopathological characteristics and survival data were obtained from the patients' medical records and surgical pathology report. This study protocol was approved by the Institutional Review Board of Asan Medical Center, Seoul, Korea; the need for obtaining informed consent was waived.
2. PET/CT scanning procedures
According to hospital's management strategy, 18F-FDG PET/CT has been recommended for preoperative evaluation of UCS. Therefore, 18F-FDG PET/CT was performed in most patients except those who refused the recommendation. Patients were instructed to avoid strenuous exercise for 24 hours before 18F-FDG PET/CT to minimize radiotracer uptake by the muscle. They were also instructed to fast for at least 6 hours prior to 18F-FDG injection. Venous blood glucose levels were controlled to stay <150 mg/dL. Following injection with 370–555 MBq (10–15 mCi) of 18F-FDG, patients were allowed to rest in the sitting or supine position for 60 minutes prior to scanning. Thereafter, they were positioned in the scanner with their arms above their heads. Skull base-to-mid thigh PET/CT scans from both the upper thighs to the head were performed using the Discovery STE, Discovery PET/CT 710, Discovery PET/CT 690, and Discovery PET/CT 690 Elite (GE Healthcare, Waukesha, WI, USA) and Biograph TruePoint 16 and Biograph TruePoint 40 (Siemens Healthcare, Erlangen, Germany) scanners. The devices combined multislice CTs with PET scans, and CT data were used for attenuation correction. Totally, 5–6 bed positions with 2–3 minutes per position were acquired. Calibration of each scanner against dose calibrators and well counters was routinely performed. The measured SUV in the phantom background was within the acceptable range of 90%–110%.
3. Imaging interpretation
SUV was calculated using the formula; SUV=concentration of radioactivity in volume of interest (VOI) (MBq/mL)×lean body weight/injected radioactivity (g/MBq). Metabolic parameters including SUVmax, metabolic tumor volume (MTV), and total lesion glycolysis (TLG) were measured by a board certified nuclear medicine physician with 14 years of PET experience who was blinded to patient information. Implanted software packages were used to measure metabolic parameters (Advantage Workstation, GE Healthcare, or TrueD, Siemens Healthcare). Primary tumor boundaries were delineated using SUV thresholds of 2.5 and 3.0 [1819]. VOIs were drawn to include the entire UCS. MTV2.5 and MTV3.0 were defined as the sum of voxel volumes with SUV of ≥2.5 and ≥3.0 within a given VOI, respectively. TLG2.5 and TLG3.0 were calculated as MTV2.5 and MTV3.0 multiplied by the average SUV of voxels, respectively. In patients where the tumor had no hypermetabolic activity above the SUV threshold within the uterus, MTV and TLG of the primary tumor were considered as zero. All VOIs were checked slice by slice on transaxial and coronal planes to check whether the physiologic uptake of bowel and ovary or urine activity included. When the physiologic uptakes were included, region of interest (ROI) were manually drawn slice by slice and MTV were calculated again within the predefined sum of ROIs.
4. Surgical staging and subsequent treatment
Endometrial biopsy with cervical dilatation and endometrial curettage was performed to identify endometrial pathology prior to surgical staging. After preoperative evaluation including 18F-FDG PET/CT, patients underwent surgery for FIGO staging. Surgical procedures included simple or radical hysterectomy, bilateral salpingo-oophorectomy, omentectomy, pelvic and/or para-aortic lymph node (LN) dissection, exploration of the peritoneal cavity, peritoneal washing cytology, resection of other involved organs, and biopsy of any suspicious areas through laparotomy or laparoscopy. All surgical specimens were examined by experienced pathologists. Patients received adjuvant therapy depending on their FIGO stage, histopathology, and preference and at the treating physician's discretion. Routine surveillance was subsequently performed by a gynecological oncologist according to our institution's protocol.
5. Statistical analysis
Progression-free survival (PFS) was the time from surgical staging to the first instance of any clinical or imaging finding suggestive of disease progression or death from any cause. Overall survival (OS) was the time between surgical staging and death or the most recent follow-up. The clinicopathological features and metabolic parameters of 18F-FDG PET/CT were used as variables. Time-dependent receiver operating characteristic (ROC) curves were generated to determine optimal cutoff values of metabolic parameters using the Maxstat package, a maximal χ2 method in R (version 3.2.2; R development Core Team, Vienna, Austria, http://www.R-project.org). Univariate Cox proportional hazards model was used to evaluate both continuous and categorical variables, and estimated hazard ratios (HRs) and 95% confidence intervals (CIs) were calculated. Multivariate Cox proportional hazards model with backward elimination method was used to assess the potential independent effects of prognostic factors for PFS or OS. Student's t-test or Mann-Whitney U test was used to compare means or mean ranks of metabolic parameters between groups. Kaplan-Meier and log-rank tests were used for survival analyses. A 2-sided p-value of <0.05 was considered statistically significant for all analyses. Statistical analyses were performed using SPSS 21.0 software for Windows (IBM, Armonk, NY, USA).
RESULTS
1. Patient characteristics and treatment outcomes
Among 55 patients, 44 patients (80.0%) had UCS in both endometrial biopsy and hysterectomy specimens, and the rest showed different histologic findings in endometrial biopsy specimens. The median age at diagnosis was 60 (range, 40–77) years. The percentage of patients with FIGO stage I, II, III, and IV disease was 36.4% (20/55), 7.3% (4/55), 40.0% (22/55), and 16.4% (9/55), respectively. The median preoperative CA-125 level was 25 (2.5–825) U/mL, and the median maximum uterine tumor diameter was 6.0 (1.0–18.0) cm. Heterologous UCS, deep myometrial invasion (≥50%), lymphovascular space invasion, cervical stromal invasion, adnexal invasion, and malignant peritoneal cytology were found in 43.6% (24/55), 54.5% (30/55), 45.5% (25/55), 41.8% (23/55), 27.3% (15/55), and 29.1% (16/55) of the patients. The median SUVmax, MTV2.5, and TLG2.5 of the primary UCS were 8.8 (2.1–26.7), 43.8 (0–923.0) mL, and 191.6 (0–3,050.2) g, respectively. SUVmax of ≤2.5 and ≤3.0 were detected in 1 and 3 patients, respectively, whose corresponding MTV and TLG values were zero. The median interval between 18F-FDG PET/CT and surgical staging was 7 (1–25) days. Pelvic or para-aortic LN metastasis was confirmed in 43.6% (24/55) of the patients. Adjuvant therapy was performed in 83.6% (46/55) of the patients and included adjuvant chemotherapy (63.6%, 35/55), radiotherapy (3.6%, 2/55), and concurrent chemoradiation (16.4%, 9/55). During a median follow-up period of 29 (1.5–109.4) months, 47.3% (26/55) of the patients experienced disease progression and 43.6% (24/55) died from UCS. The median and mean PFS were 16.5 (0.5–109.4) and 32.0±4.2 months, respectively. The median and mean OS were 25.6 (1.5–109.4) and 37.5±4.3 months, respectively. Other clinicopathological characteristics of the patients are listed in Table 1.
Table 1
Patients' characteristics (n=55)
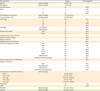
18F-FDG, 18F-fluorodeoxyglucose; BMI, body mass index; BSO, bilateral salpingo-oophorectomy; CA-125, cancer antigen 125; CT, computed tomography; FIGO, International Federation of Gynecology and Obstetrics; LAVH, laparoscopic-assisted vaginal hysterectomy; LN, lymph node; MTV, metabolic tumor volume; OS, overall survival; PALND, para-aortic lymph node dissection; PET, positron emission tomography; PFS, progression-free survival; PLND, pelvic lymph node dissection; RH, radical hysterectomy; SUVmax, maximum standardized uptake value; TAH, total abdominal hysterectomy; TLG, total lesion glycolysis.
*MTV2.5 and TLG2.5 were considered as zero in 1 patient with SUVmax of 2.11; †MTV3.0 and TLG3.0 were considered as zero in 3 patients with SUVmax of 2.11, 2.86, and 2.97, respectively.
![]()
2. Cutoff values of metabolic parameters as predictors of disease progression and death
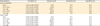
Using the time-dependent ROC curve for primary tumors, optimal cutoff values for predicting 3-year disease progression were 8.33 (area under the curve [AUC]=0.541; sensitivity, 75.4%; specificity, 49.5%), 63.92 mL (AUC=0.755; sensitivity, 66.2%; specificity, 85%), and 396.16 g (AUC=0.747; sensitivity, 64.4%; specificity, 83.5%) for SUVmax, MTV2.5, and TLG2.5, respectively. Optimal cutoff values for predicting the 3-year death were 8.33 (AUC=0.584; sensitivity, 77.7%; specificity, 51.2%), 63.92 mL (AUC=0.726; sensitivity, 62%; specificity, 81.2%), and 396.16 g (AUC=0.724; sensitivity, 61.7%; specificity, 81%) for SUVmax, MTV2.5, and TLG2.5, respectively (Table 2, Fig. 1). AUCs and optimal cutoff values of MTV3.0 and TLG3.0 were also calculated (Table 2, Supplementary Fig. 1).
Table 2
Primary lesion 18F-FDG PET/CT parameters for differentiation of progression or death at 3 years
18F-FDG, 18F-fluorodeoxyglucose; AUC, area under the curve; CI, confidence interval; CT, computed tomography; MTV, metabolic tumor volume; PET, positron emission tomography; SUVmax, maximum standardized uptake value; TLG, total lesion glycolysis.
![]()
 | Fig. 1Time-dependent ROC curve analyses for determination of the cutoff values of SUVmax, MTV2.5, and TLG2.5 for predicting 3-year progression (A) and death (B).
AUC, area under the curve; MTV, metabolic tumor volume; ROC, receiver operating characteristic; SUVmax, maximum standardized uptake value; TLG, total lesion glycolysis.
|
3. Prognostic factors and survival analyses
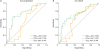
Table 3 summarizes the prognostic value of clinicopathological and metabolic parameters. Optimal cutoff values of tumor size for predicting 3-year disease progression and 3-year death were calculated as 5.5 cm (AUC=0.821; 95% CI=0.695–0.946; sensitivity, 87.3%; specificity, 72.6%) and 6.5 cm (AUC=0.784; 95% CI=0.647–0.920; sensitivity, 68.6%; specificity, 86.6%), respectively, and we used the mean value (6 cm) of them for the categorical data analysis. Among the clinicopathological variables, FIGO stage III–IV, tumor diameter of ≥6 cm, heterologous histology, deep myometrial invasion, cervical stromal invasion, adnexal invasion, and malignant peritoneal cytology were significant prognostic factors for both PFS and OS by univariate Cox proportional hazards analysis. The presence of pelvic or para-aortic LN metastasis was a significant prognostic factor for only PFS. The analysis of metabolic parameters as continuous variables determined that SUVmax (p=0.873), MTV2.5 (p=0.070), and TLG2.5 (p=0.087) were not significant prognostic predictors of PFS. MTV2.5 (p=0.008) and TLG2.5 (p=0.016) were significant prognostic predictors of OS, whereas SUVmax (p=0.913) was not. Using the abovementioned optimal cutoff values of SUVmax, MTV2.5, and TLG2.5 HRs for progression were 1.930 (95% CI=0.793–4.701; p=0.148), 3.264 mL (95% CI=1.466–7.268; p=0.004), and 2.692 g (95% CI=1.224–5.924; p=0.014), respectively. HRs for death using the same cutoff values for SUVmax, MTV2.5, and TLG2.5 were 1.979 (95% CI=0.774–5.060; p=0.154), 2.764 mL (95% CI=1.217–6.274; p=0.015), and 2.721 g (95% CI=1.198–6.182; p=0.017), respectively. HRs using the cutoff values for MTV3.0 and TLG3.0 were also shown in Table 3.
Table 3
Univariate and multivariate analyses of prognostic factors for PFS and OS in patients with UCS
CA-125, cancer antigen 125; CI, confidence interval; FIGO, International Federation of Gynecology and Obstetrics; HR, hazard ratio; MTV, metabolic tumor volume; OS, overall survival; PALN, para-aortic lymph node; PFS, progression-free survival; PLN, pelvic lymph node; SUVmax, maximum standardized uptake value; TLG, total lesion glycolysis; UCS, uterine carcinosarcoma.
*Because the optimal cutoff values of tumor size for predicting progression and death at 3 years were different as 5.5 cm and 6.5 cm, we used the mean value of them; †TLG was not incorporated in multivariate analysis because of the strong correlation between MTV2.5 and TLG2.5 (Spearman r=0.987, p<0.001), and MTV3.0 and TLG3.0 (Spearman r=0.982, p<0.001), respectively.
![]()
By multivariate Cox proportional hazard analysis, malignant peritoneal cytology (HR=6.039; 95% CI=2.497–14.605; p<0.001) and heterologous histology (HR=4.363; 95% CI=1.712–11.121; p=0.002) were independent prognostic factors for PFS, whereas malignant peritoneal cytology (HR=3.054; 95% CI=1.184–7.874; p=0.021) and tumor diameter of ≥6 cm (HR=3.288; 95% CI=1.057–10.226; p=0.040) were independent prognostic factors for OS.
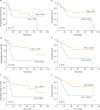
Using the cutoff values to compare low vs. high SUVmax, MTV2.5, and TLG2.5 estimated 3-year PFS rates in patients were 70.8% vs. 46.4% (p=0.141), 76.8% vs. 25.3% (p=0.002), and 73.4% vs. 27.5% (p=0.011), respectively. Similarly, the 3-year OS rates in patients with low vs. high SUVmax, MTV2.5, and TLG2.5 were 71.4% vs. 45.6% (p=0.147), 71.0% vs. 31.3% (p=0.011), and 70.9% vs. 31.7% (p=0.013), respectively. Kaplan-Meier survival plots showed differences in PFS and OS according to the cutoff value of SUVmax, MTV2.5, and TLG2.5 (Fig. 2), MTV3.0 and TLG3.0 (Supplementary Fig. 2).
4. Metabolic parameters of 18F-FDG PET/CT in relation to various clinicopathological parameters
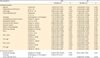
SUVmax was normally distributed; however, MTV and TLG values were not. Student's t-test showed that the mean SUVmax was not significantly different among all subgroups of clinicopathological parameters. Mann-Whitney U test determined that the mean ranks of both MTV2.5 and TLG2.5 were significantly different when patients were stratified according to the preoperative CA-125 level, FIGO stage, tumor diameter, histology, lymphovascular space invasion, myometrial invasion, and adnexal invasion but were not significantly different when they were stratified based on cervical stromal invasion, pelvic or para-aortic LN metastasis, or peritoneal cytology (Table 4).
Table 4
18F-FDG PET/CT parameters of primary UCS in relation to various clinicopathological features
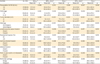
CA-125, cancer antigen 125; FIGO, International Federation of Gynecology and Obstetrics; LN, lymph node; MTV, metabolic tumor volume; SD, standard deviation; SUVmax, maximum standardized uptake value; TLG, total lesion glycolysis; UCS, uterine carcinosarcoma.
*Statistical significance test was done by Student's t-test; †Statistical significance test was done by Mann-Whitney U test.
![]()
DISCUSSION
This study suggests that MTV and TLG are more suitable as prognostic indicators than SUVmax in patients with UCS. Furthermore, they were well correlated with clinicopathological prognostic factors.
Most previously published studies investigating the prognostic role of 18F-FDG PET/CT in endometrial cancers included only a small percentage (0%–14.3%) of patients with UCS, and the most common histology was an endometrioid adenocarcinoma [14192021222324]. High SUVmax of primary endometrial cancer showed significantly worse disease-free survival (DFS) or OS rates than those with a low SUVmax [202122]. Moreover, SUVmax of primary endometrial cancer showed a significant correlation with clinicopathological prognostic factors [12202124]. In contrast, our study showed that SUVmax of primary UCS was not associated with PFS or OS and was not correlated with clinicopathological prognostic factors. As an indicator of the single maximum voxel value in a tumor, SUVmax may not represent the metabolic burden of the entire tumor, particularly in a nonhomogeneous tumor such as UCS. Moreover, SUVmax can also be confounded by noise and tumor volume [2526].
Compared to SUVmax, MTV, and TLG of primary endometrial cancer were reported as more accurate parameters for categorizing high- and low-risk groups and are better correlated with clinicopathological features [1427]. Our current study also showed that MTV and TLG were correlated with poor prognostic factors for UCS. Further, MTV and TLG of primary endometrial cancer were reported as independent prognostic factors for DFS or PFS [1923]. Total body MTV was also a significant prognostic factor for OS in patients with stage IVB endometrial cancer [28]. In contrast to SUVmax, volume-based parameters such as MTV and TLG represent metabolic activity of the entire tumor above a minimal threshold, which may reflect the overall tumor burden and behavior more accurately than SUVmax [29]. These might also partially explain the better correlation of these volume-based metabolic parameters with clinicopathological prognostic factors than SUVmax in the present study.
In a recent study analyzing a small number of UCS patients (n=28) during a median follow-up period of 18.6 months, cumulative TLG was the only independent risk factor for recurrence (HR=115.261; 95% CI=1.041–12,765.483; p=0.048) in patients with UCS, and PFS was significantly differed between high and low TLG groups (p=0.007, log-rank test) [16]. In contrast, MTV and TLG were not independent prognostic variables in present study though low MTV or TLG groups showed significantly prolonged survival compared to high groups (Fig. 2, Supplementary Fig. 2). We think that these discrepancies of results occurred by differences in variables used in statistics. Sum of all MTVs and cumulative TLG in a patient were analyzed as volumetric parameters in previous study [16], whereas MTV and TLG of primary uterine tumor were analyzed in present study. And 3 potential independent risk factors identified in this study were not incorporated as variables in multivariate analysis. Considering that peritoneal cytology, histology, and tumor diameter were independent prognostic factors, MTV and TLG could not entirely substitute for surgical staging. However, they may provide additional information for risk group stratification and survival prediction especially in patients who are not candidates for surgical staging, aiding in predicting patient outcomes, choosing the best treatment strategy.
There are currently several methods to delineate tumor volume in 18F-FDG PET/CT, including manual drawing and automatic and semiautomatic methods using an isocontour threshold based on a fixed SUVmax percentage, a specific SUV (e.g., 2.5 and 3.0), or a background-level threshold [2830]; however, there is currently no consensus on the best method [31]. In our study, we selected VOIs based on fixed arbitrary SUV thresholds of 2.5 and 3.0 which were commonly used for other malignancies [18193233]. Previous studies showed that the clinical value of MTV and TLG might not be affected by specific tumor delineation methods, despite their significant impact on the absolute value of PET parameters [313435]. Likewise, our results were not likely confounded by the chosen tumor delineation method. The HRs of MTV3.0 and TLG3.0 were similar to those of MTV2.5 and TLG2.5, respectively, in univariate analyses, and the results of multivariate analysis were not changed. However, further studies are needed to determine standard methods and adequate cutoff values of tumor volume measurement with external validation before the utilization of our findings in clinical practice.
Our study has several limitations. First, this was a retrospective, single-center study with a small number of patients and short follow-up periods. However, considering the extreme rarity of UCS and poor oncologic outcomes, our study could provide meaningful information. Second, various adjuvant treatment modalities in our cohort could have affected the oncological outcomes. If indicated, all patients were recommended to receive adjuvant therapy, according to international guidelines [36]. As a result, majority of the patients (83.6%, 46/55) received adjuvant therapy, except for 3 patients who refused treatment due to their personal preference or poor general condition. However, optimal therapy for UCS is still debated, and neither adjuvant radiotherapy nor chemotherapy was a significant prognostic factor for PFS or OS in prospective randomized trials [4]. Thus, any potential differences in adjuvant therapy were unlikely to impact our findings. Third, metabolic parameters of UCS are not completely separated from the physiologic uptake of endometrium [37] or post-biopsy change. In the present study, most study participants (94.5%, 52/55) were postmenopausal, and the median time interval between endometrial biopsy and 18F-FDG PET/CT was 14 (0–43) days. While we could exclude the premenopausal physiologic uptake in most cases, we still cannot determine the contribution of post-biopsy change. We checked the correlation between PET parameters and interval between biopsy and FDG PET/CT, and we could not find any correlation between them. Finally, during the 10-year span of this study, 6 different PET scanners were used, which might have affected the 18F-FDG PET/CT parameters. To minimize impact, the first priority was given to compatibility with previous scanners when scanner-specific parameters such as voxel size and acquisition time per bed were set. Further prospective studies with a larger number of patients and longer follow-up periods are required to confirm our findings.
In conclusion, MTV and TLG of primary UCS were significant prognostic factors for predicting PFS and OS in univariate analysis and that they were correlated with clinicopathological prognostic factors. In contrast, SUVmax was neither associated with PFS and OS nor correlated with clinicopathological features. MTV and TLG determined by 18F-FDG PET/CT may help in stratifying high-risk patients and predicting prognosis especially in patients who are not candidates for primary surgery.
 XML Download