

 PDF
PDF ePub
ePub Citation
 Print
Print


INTRODUCTION
Carpal tunnel syndrome (CTS) is the most common entrapment neuropathy,1 and a prevalence in the general adult population reportedly ranging from 2.7% to 5.8%.23 CTS is nearly ten times more common in women than in men.4 Although its etiology is unknown, it is commonly associated with certain conditions, including obesity, arthritis, hypothyroidism, diabetes mellitus, trauma, mass lesions, amyloidosis, and sarcoidosis.5 In addition, CTS is often associated with overuse-type injuries caused by repetitive motion.6 Nerve conduction studies and electromyography are the most significant diagnostic methods and can be used to quantify and stratify disease severity.5
Metabolic syndrome, also known as dysmetabolic syndrome or syndrome X, is characterized by abdominal obesity, dyslipidemia, hyperglycemia, and hypertension.7 A variety of definitions have been developed for metabolic syndrome, the first of which was proposed by the World Health Organization in 1999 and then modified by the European Group for the Study of Insulin Resistance, also in 1999. The National Cholesterol Education Program of the USA introduced the Adult Treatment Panel (ATP) III definition in 2001.78 The components of the ATP III definition are easily and routinely measured in most clinical and research settings. The risk factors for CTS have been evaluated in several studies thus far, and recent research indicates that metabolic syndrome plays a role in CTS.910
The aim of the present study was to determine the association between metabolic syndrome and CTS. Furthermore, the severity of CTS was compared between patients with diabetes (and no concomitant metabolic syndrome) and patients with metabolic syndrome.
METHODS
All patients who were referred to our electrophysiology laboratory with sensory or motor complaints in the upper limbs between April 2013 and December 2013 were examined, resulting in the recruitment of 200 patients who had a clinically and electrophysiologically confirmed diagnosis of CTS to this study. The following exclusion criteria were applied: pregnancy, hypothyroidism, rheumatoid arthritis, corticosteroid or hormone-replacement treatment, previous wrist fracture, surgery for CTS, or EMG findings that indicated the presence of polyneuropathy, cervical radiculopathy, brachial plexopathy, or thoracic outlet syndrome. The recorded patients' demographic data, waist circumference, hypertension, fasting plasma glucose level, hypertriglyceridemia, and serum low-density lipoprotein cholesterol (LDL-C) and high-density lipoprotein cholesterol (HDL-C) levels were evaluated.
The patients were assessed for metabolic syndrome according to the ATP III definition criteria, which state that the presence of any three of the following five factors is sufficient for a diagnosis of metabolic syndrome:8 central obesity (waist circumference >102 cm in males and >88 cm in females), hypertriglyceridemia (triglycerides ≥150 mg/dL), low serum HDL-C (<40 mg/dL in males and <50 mg/dL in females), hypertension (blood pressure ≥130/85 mm Hg or taking antihypertensive medication), and fasting plasma glucose (≥100 mg/dL).
Electrophysiological studies were performed using the Nihon Kohden Neuropack 9400 system while the patients lay in a supine position. Motor and sensory nerve conduction studies were performed for the median and ulnar nerves of both upper extremities, with the skin kept at a temperature of ≥32℃. The minimal latencies of the F wave were recorded. The median nerve compound muscle action potential (CMAP) was recorded with the electrodes placed on the abductor pollicis brevis muscle and the stimulation point 7 cm from the electrodes. The electrodes were placed on the abductor digiti minimi muscle, and the stimulation point was 5 cm from the electrodes to record the ulnar nerve CMAP. Sensory nerve action potentials were obtained orthodromically and were performed from the palm and digit II for the median sensory nerve and digit V for the ulnar sensory nerve, with stimulation at the wrist. Electromyography and other neurophysiological studies were performed as required.
Nerve conduction studies are the most definite diagnostic test for CTS; it is positive on average in 95% of patients with clinically diagnosed CTS on the basis of their signs and symptoms. The most sensitive diagnostic test is sensory nerve conduction. A diagnosis of CTS has traditionally required the presence of one or more of the following criteria: 1) abnormal sensory nerve conduction velocity (NCV) in the finger-wrist segment, 2) abnormal sensory NCV in the palm-wrist segment, and 3) prolonged terminal latency. To increase the diagnostic yield in those patients in whom the conventional test results are normal, various methods of comparative analysis have been proposed.11 Stevens recommends using both the history/physical and electrodiagnostic findings when making a diagnosis of CTS. A scheme that was defined by Stevens12 for grading CTS severity based on electrophysiological findings was used in the present study.
The patients (all with clinically and electrophysiologically confirmed CTS) were stratified into the following four groups according to the presence of metabolic syndrome and/or diabetes: 1) metabolic syndrome only (MS+DM-), 2) diabetes mellitus only (MS-DM+), 3) metabolic syndrome and diabetes mellitus together (MS+DM+), and 4) neither metabolic syndrome nor diabetes (MS-DM-). The demographic characteristics, the severity of CTS, and the electrophysiological findings of the subjects were analyzed and compared among these four groups.
Statistical analysis
The Shapiro-Wilk test was used to test for normality; the results of this test indicated that parametric and nonparametric tests should be performed. The Mann-Whitney U test was used to compare the parameters of patients with and without metabolic syndrome. The following variables were compared between the patients subdivided into four groups according to the presence/absence of metabolic syndrome and/or diabetes (MS+DM-, MS-DM+, MS+DM+, and MS-DM-) using one-way analysis of variance: median nerve motor distal latency (MNMDL), median nerve motor amplitude (MNMA), median nerve motor conduction velocity (MNMCV), median nerve sensory onset latency (MNSOL), median nerve sensory amplitude (MNSA), and median nerve sensory conduction velocity (MNSCV). Post-hoc tests (Bonferroni) were used to establish differences between these groups. The homogeneity of the distributions of categories of group factors among categories of nominal variables was determined using chi-square or Fisher's exact tests. General descriptive statistics are summarized as mean±SD values for continuous variables. The threshold for statistical significance was set at p<0.05. Statistical Package for the Social Sciences (SPSS) 15.0 (SPSS for Windows, SPSS Inc., Chicago, IL, USA) was used for all of the statistical analyses.
RESULTS
Six hundred and twenty-two patients who had a prediagnosis of CTS were referred to our electrophysiology laboratory between April 2013 and December 2013. Of these, 200 patients with CTS were included in the study; 140 (70%) of the patients were female and 60 (30%) were male, and the entire cohort was aged 51.61±11.86 years. CTS was unilateral and bilateral in 59 (29.5%) and 141 (70.5%) of the patients, respectively. The patients had a body mass index (BMI) of 25.40± 2.24 kg/m2, with 78% having a BMI of >24.9 kg/m2. LDL-C, HDL-C, and triglyceride levels were recorded; high serum LDL-C and triglycerides, and low serum HDL-C were found in 71%, 22%, and 33% of the study population, respectively.
Comparison of CTS patients with and without metabolic syndrome
Ninety-six (48%) of the patients had metabolic syndrome and 104 (52%) did not, according to the ATP III definition. There was no significant difference between the patients with and without metabolic syndrome in age (53.8±11.5 years vs. 49.5±11.8 years, p=0.696) or gender (females/males: 71/25 vs. 69/35, p=0.241). Bilateral CTS was present in 84 (87.5%) of the 96 patients with metabolic syndrome and in 57 (54.8%) of the 104 patients without metabolic syndrome (p<0.001). The CTS was described as mild, moderate, and severe in 42, 87, and 12 hands, respectively, of those with metabolic syndrome, and in 61, 75, and 24 of those without metabolic syndrome. The proportion of patients who had severe CTS was higher in those with metabolic syndrome than in those without metabolic syndrome (p<0.001). The motor conduction potential was not obtained from one patient in the metabolic syndrome group.
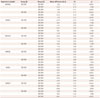
Comparison of the electrophysiological findings of the patients with and without metabolic syndrome revealed that MNMDL, MNMA, MNSOL, MNSA, and MNSCV were worse in the former than the latter. MNMCV did not differ between the two groups (Table 1).
Comparison of CTS patients grouped according to metabolic syndrome and diabetes status
Stratification of the patients according to the presence/absence of metabolic syndrome/diabetes yielded the following CTS patient distribution: MS+DM-, n=44; MS-DM+, n=20; MS+DM+, n=52; and MS-DM-, n=84. Comparison of the electrophysiological findings of these four patient groups revealed that MNMDL, MNSOL, MNSA, and MNSCV were worse in MS+DM- patients than in MS-DM+ and MS-DM- patients. MNMDL, MNSOL, MNSA, and MNSVC were worse in MS+DM+ patients than in MS-DM+ and MS-DM- patients, but did not differ between the MS+DM+ and MS+DM- groups. The electrophysiological findings in the four groups and the relationships between them are listed in Table 2 and 3.
The occurrence of abdominal obesity, hypertension, and dyslipidemia (high serum LDL-C, hypertriglyceridemia, and low serum HDL-C), factors that could affect the electrophysiological findings, were compared among the four groups (Table 4).
The waist circumferences in the MS+DM-, MS-DM+, MS+DM+, and MS-DM- groups were 96.25±6.75, 86.75±12.60, 93.84±8.66, and 87.53±7.33 cm, respectively. The mean waist circumference of the MS-DM+ group was lower than in the MS+DM- group (p<0.001) and MS+DM+ group (p=0.009).
Hypertension was found in 102 of the 200 patients. The frequencies of hypertension in the MS-DM+, MS+DM-, MS+DM+, and MS-DM- groups were 60.0%, 73.1%, 68.2%, and 26.2%, respectively. The frequency of hypertension was lower in the MS-DM- group than in the other three groups (p>0.05).
High serum LDL-C was observed in 40 (76.9%) of the MS+DM- patients, 15 (75.0%) of the MS-DM+ patients, 35 (79.5%) of the MS+DM+ patients, and 52 (61.9%) of the MS-DM- patients. This parameter did not differ significantly between the four groups (p>0.05).
Low serum HDL-C was found in 22 (42.3%) of the MS+DM- patients, 12 (60%) of the MS-DM+, 24 (54.5%) of the MS+DM+ patients, and 8 (9.5%) of the MS-DM- patients. The frequency of low serum HDL-C was significantly lower in the MS-DM- group than in the other three groups (p>0.05).
The numbers of patients in the MS+DM-, MS-DM+, MS+DM+, and MS-DM- groups with hypertriglyceridemia were 14 (26.9%), 7 (35.0%), 13 (29.5%), and 10 (11.9%), respectively. The frequency of hypertriglyceridemia was significantly lower in the MS-DM- group than in the other three groups (p>0.05).
DISCUSSION
Carpal tunnel syndrome is the most common entrapment neuropathy. Well-known risk factors for CTS are age, increased motor activity, female gender, pregnancy, diabetes mellitus, rheumatoid arthritis, and hypothyroidism.512 Metabolic syndrome and its components, such as hypercholesterolemia, high serum LDL-C, and obesity, have recently been defined as a risk factor for CTS.9101314 The present study analyzed the impact of diabetes and metabolic syndrome on the electrophysiological findings of CTS, and evaluated the association between metabolic syndrome and CTS.
Carpal tunnel syndrome is more common in female patients and frequently affects patients in the age range 40-60 years. One study involved 119 patients aged 46.32±12.18 years, of whom 85.7% were female.15 In a retrospective analysis of 92 patients with a mean age of 49 years, 95.65% were female.16 Lewańska and Walusiak-Skorupa17 reported on 300 patients with CTS aged 52.00±6.93 years, of whom 261 were female. Similar to these findings, 70% of the patients in the present study were female, and they were aged 51.61±11.86 years.
Diabetes mellitus, obesity, and hypercholesterolemia which are the components of metabolic syndrome, have been reported as risk factors for CTS.1317 Hypercholesterolemia-and especially high LDL-C-has been associated with fibrogenesis. In idiopathic CTS, the proliferation of intraneural connective tissue causes enlargement of the median nerve within the carpal tunnel. Nakamichi and Tachibana13 found that the cross-sectional nerve area and prevalence of CTS were correlated with serum LDL-C levels. In a study from Senegal, the prevalence rates of hypercholesterolemia and high serum LDL-C were 60.91% and 66.98%, respectively,18 and in the Balcova heart study from Turkey, the prevalence of hypercholesterolemia was 59.8% in women and 56.0% in men.19 Onder et al.10 found a correlation between serum LDL-C and the severity of CTS. In the present study, 71% of the patients had high serum LDL-C, which is higher than the proportion found in the Turkish population.
Peripheral neuropathies are more common in patients with diabetes. A meta-analysis of the risk factors for CTS that included longitudinal studies indicated that diabetes mellitus, being overweight or obese, and excessive alcohol consumption are risk factors for CTS.20 Perkins et al.21 reported that the prevalence of CTS was 2% in a reference population, 14% in diabetic patients without diabetic polyneuropathy, and 30% in those with diabetic polyneuropathy. In the Turkish Diabetes Epidemiology Study (TURDEP), the crude prevalence of diabetes was 7.2% in the Turkish population aged ≥20 years.22 The rate of diabetes in the present study, at 32%, is much higher than reported for TURDEP.
A retrospective study involving 720 patients found that the BMI was significantly higher in patients with CTS than in those without CTS.23 Hlebs et al.24 studied the independent risk factors for CTS using multiple logistic regression analysis, and identified wrist index, BMI, and the ratio of the hand length to body height as independent risk factors for CTS. In the patients of the present study, the overall BMI was 25.40±2.24 kg/m2, and 78% of the cohort had a BMI of >24.9 kg/m2; 57% of the Turkish population in TURDEP had a BMI of >24.9 kg/m2.22 The Turkey Nutrition and Health Survey examined the prevalence of obesity in Turkey again in 2010, and according to preliminary study reports, the prevalence of obesity was 30.3% (with using BMI), and 64.9% of the included population had a BMI of >24.9 kg/m2. The rates of being overweight and obese in the present study were higher than those described in previous studies.
The prevalence of metabolic syndrome among Turkish adults is reported to be between 36.6% and 51.8%,2526 and the rate of metabolic syndrome in patients with CTS has been found to be 75% and 54% in different studies.910 The rate of metabolic syndrome in the present study in patients with CTS was 48%, which is lower than in the previous studies. The difference in the rate of metabolic syndrome in the patients with CTS may be explained by the patients' residence size (urban or rural) and altitude (coastal or mountain). In agreement with the findings of Balci and Utku9 and Onder et al.,10 CTS was more severe in the patients with metabolic syndrome than in those without.
The electrophysiological findings of the patients were analyzed in the present study to determine the effect of metabolic syndrome (with and without diabetes) and diabetes on the severity of CTS by dividing the patients into groups according to the presence/absence of metabolic syndrome and/or diabetes (i.e., MS+DM-, MS-DM+, MS+DM+, and MS-DM-). CTS was found to be more severe in the MS+DM- group than in the MS-DM+ group. This suggestes that components of metabolic syndrome other than diabetes could have a greater influence on the severity of CTS.
Components of metabolic syndrome such as abdominal obesity, hypertension, and dyslipidemia were analyzed between four groups of patients. The results indicated that the waist circumference were larger in the MS+DM- group than in the MS-DM+ group, and that hypertension frequency and dyslipidemia did not differ significantly between these two groups. Therefore, it appears that abdominal obesity, which is a component of metabolic syndrome, may influence the severity of CTS. However, having more than one component of metabolic syndrome also appears to influence the severity of CTS.
In conclusion, CTS was found to be more severe in patients with metabolic syndrome than in those with diabetes in this study. Diabetes is a well-known risk factor for CTS, although other components of metabolic syndrome may have a greater effect on the severity of CTS. CTS should be considered in patients with metabolic syndrome, obesity, and dyslipidemia.


 XML Download