

 PDF
PDF ePub
ePub Citation
 Print
Print


Carpal tunnel syndrome (CTS) or compression neuropathy of the median nerve at the wrist is the most common form of peripheral entrapment neuropathy and it is particularly prevalent in middle-aged women. Although it can be caused by many diseases, more than 50% of cases are idiopathic (1, 2). The carpal tunnel is a region restricted by the flexor retinaculum ventrally and by the carpal bones dorsally. The median nerve is intimately related to the flexor retinaculum, lying just below this ligament, and courses ventral and parallel to the flexor tendons (3). Any restriction in this space leads to CTS. Early diagnosis is essential in preventing permanent nerve damage and functional sequela (4). Diagnosis of CTS is usually based on combination of clinical symptoms (burning pain, numbness, and nocturnal paresthesia in the distribution of the median nerve), and signs, such as Tinel sign (tapping over the median nerve producing dysesthesias) and Phalen sign (wrist flexion producing dysesthesias), and nerve conduction studies (electromyography, EMG) (2-4). Single signs and symptoms have been shown to have limited diagnostic accuracy, while electrodiagnostic methods are time-consuming and expensive (1). High resolution ultrasonography (HRUS) has emerged as a feasible, simple, relatively low-cost, rapid, accurate and noninvasive imaging method for evaluating the median nerve in the carpal tunnel (1-13). This method could detect the nerve compression characteristics, and the space-occupying lesions such as ganglia, neural tumors, and tenosynovitis (3, 4).
Doppler US has taken its place as a diagnostic tool in many studies. To our knowledge, there are no studies evaluating the median nerve in patients with CTS by power Doppler ultrasonography, although color Doppler US has been used to detect intraneural circulatory disturbance in patients with suspected CTS by some authors (14). In addition we thought that power Doppler US might be a useful tool in evaluating the severity degree of CTS. The present study was undertaken to determine the value of diagnostic gray scale and power Doppler US in patients with electrophysiologically confirmed CTS.
MATERIALS AND METHODS
We studied 42 patients with unilateral or bilateral CTS recruited from physical therapy at the rehabilitation department of our hospital and 33 healthy volunteers. The study protocol was approved by the university ethics committee of the Eskiçehir Osmangazi University Medical Faculty, and written and verbal consent was obtained from all patients and healthy volunteers. All the patients had the characteristic clinical symptoms for at least 1.5 months, and their electrodiagnostic tests were performed within 2 days before a US examination was done. Clinical diagnosis was confirmed by electromyogram. The diagnostic criteria of the electromyogram for CTS were a mean sensory conduction velocity less than 50 m/s or a motor distal latency greater than 4 msec or a difference of more than 0.4 msec between the median and ulnar sensory peak latencies. These criteria were used in our hospital as a standard method. Patients with a history of previous wrist surgery or with a bifid median nerve were excluded from the study. We examined the wrists of the patients with carpal tunnel syndrome, both unilateral or bilateral. To compose the control group data, we chose one wrist from each case (right or left) with no clinical signs or symptoms of CTS. All control subjects were screened to exclude systemic disorders (i.e., diabetes mellitus, connective tissue disorders, kidney or thyroid abnormalities, and wrist/hand trauma) that might result in neuropathy. One wrist was evaluated in each volunteer in the control group unless there was a bandage or cast that precluded US evaluation. Electrodiagnostic tests were not performed in the healthy volunteers.
All ultrasonography and power Doppler examinations were performed by the same radiologist who had 12 years of experience with the Toshiba SSA 770A scanner (Toshiba, Tokyo, Japan) and a 7.5 MHz linear array transducer with a 14-mm aperture size. The subjects were seated facing the examiner, and they extended their forearms on a flat surface in the supine position with their fingers were semiextended. The median nerve was examined axially and longitudinally along the carpal tunnel by gray-scale and power Doppler US. We avoided excess pressure of the transducer over the wrist to minimize sampling errors.
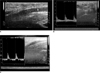
We took axial images of the median nerve at three levels: Level 1. located just proximal to the tunnel inlet where the nerves become more circular (CSAa), Level 2. located at the pisiform bone level where the nerves become small in anteroposterior diameter (CSAb), Level 3. Hamate bone level where the nerve size is reduced in the smaller in AP. A cross-sectional area of the median nerve was measured by means of direct tracing with electronic calipers around the margin of the nerves on sonograms at 1st and 2nd level . With the values obtained from these levels we determined the area differences by subtracting CSAa from CSAb. Additionally we calculated the percentage area increase for CSAb in relation to CSAa with the formula of CSAb-CSAa/CSAb*100. The 3rd level was used to calculate the flattening degree by calculating the ratio between the largest diameter and the diameter perpendicular to this finding. We did not determine the bowing degree of the carpal tunnel as the sensitivity and specificity of sonographic diagnosis were too low in some reports (15).
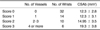
Power Doppler ultrasonography performed after grayscale ultrasonography to calculate the number of vessels in the median nerve along the carpal tunnel. Standardized machine settings (transmit power 500 mW/cm2, a low-pass wall filter, and medium persistence) were used and remained fixed throughout the study. These settings were chosen to maximize the sensitivity to low-velocity and low-volume blood flow. Power gain was optimized by reducing gain just enough to suppress the noise (usually 75-85% gain). The power Doppler color box was restricted to the area of interest. After visualization of power-flow signals (PFS), pulsed wave spectral Doppler imaging was performed using the lowest filter setting (125 Hz) and smallest scale available that would display the Doppler waveforms as large as possible without aliasing. A spectral Doppler tracing was obtained to confirm the power Doppler signals that represented true arterial or venous flow. The intensity of vascularity in the nerve was evaluated by counting the number of PFS, using the scores established in a modification of Klauser and Shio's method used in the quantification of vessels in the metacarpophalangeal joints of patients with rheumatoid arthritis (16, 17). Score 0: no PFS; score 1: 1 PFS; score 2: 2-3 PFS; score 3: 4 or more PFS. We counted the depicted vessels while the transducer was swept very slowly towards the inlet of the tunnel to the outlet. We calculated the CSAb for each score. The PI's of the vessels related to PFS were calculated automatically using a computer by tracking the velocity wave developed by spectral Doppler sonography according to the following formula:
PI = peak systolic velocity (PSV)-end diastolic velocity (EDV)/mean velocity (Vmean)
We determined the mean values, ranges, and standard deviations (SD) for age, CSAa and CSAb, the difference between CSAb and CSAa, the percentage of area increase of CSAb in relation to CSAa, the largest diameter, the diameter perpendicular to the largest diameter, the flattening ratio, and the number of vessels along the carpal tunnel. Data entry procedures and statistical analyses were performed using SPSS Version 11.0.0 for Windows (Chicago, IL). We used the Student t test for independent samples to compare the values of two groups. P values < 0.05 were accepted as statistically significant and the receiver operating characteristic (ROC) curves for the ultrasonographic measurements of median nerve were plotted to identify the optimal cut-off values.
RESULTS
The patient cohort consisted of 26 women ranging in age between 33-58 years (mean age, 45 ± 8 years), and 16 men ranging in age between 39-68 years (mean age, 49 ± 12 years). The carpal tunnel condition was bilateral in 22 cases, and unilateral in 18 cases (a total of 62 wrists). The control group consisted of 22 women with an age range of 23-58 years (mean age, 42 ± 12 years), and 11 men with an age range of 38-65 years (mean age, 46 ± 11 years) (33 wrists). The mean duration of clinical history was 1.7 ± 1.8 years (1.5 months-7 years).
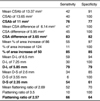
The mean values and statistical significance related to wrists with and without CTS indicated that mean CSAa for CTS was 7.24 ± 1.68 mm2, which was not significantly different compared to 7.21 ± 2.31 mm2 for the control group (p > 0.05); The mean CSAb in CTS was 13.37 ± 3.62 mm2 and was significantly different the control group, which was 9.4 ± 2.31 mm2 (p < 0.001) (Figs. 1, 2). The mean difference between CSAb and CSAa (CSAb-CSAa) in wrists with CTS was 6.14 ± 2.6 mm2, was significantly different compared to 2.24 ± 1.43 mm2 in the control group (p < 0.001). The area difference was found to be a useful tool in the evaluation of CTS, but was not discussed in this study. The mean largest diameter for CTS was 6.5 ± 1.3 mm, which was significantly different compared to 5.2 ± 8 mm for the control group (p < 0.001). The mean perpendicular diameter in CTS patients was 2.6 ± 1 mm, which was significantly different when compared to the control group, which had a mean perpendicular diameter of 2.24 ± 0.5 mm (p < 0.05). The mean flattening ratio in CTS patients was 2.7 ± 0.7, which was significantly different when compared with the mean flattening ratio in control group, which was 2.4 ± 0.5 (p < 0.05). For the statistical analyses, we randomly chose one wrist from patients with bilateral CTS for the percentage area increase in CSAb in relation to CSAa (analysis performed for 42 wrists with CTS). We found that the mean value was 86 ± 34% for CTS, which was significantly different compared to 33 ± 24% for the control group (p < 0.001) (Table 1). We thought that two wrists from the same body might bias the statistical analysis and our purpose was to find the optimal cut-off value for the percent area increase of CSAb. Consequently, we studied one wrist from each case.
None of the healthy volunteers' median nerves demonstrated detectable PFS by power Doppler US (Fig. 2A). The mean number of vessels in patients with CTS was 1.2 ± 1.2 (Fig. 3) (p < 0.0001). A total of 32 median nerves were present for score 0, compared to 14 for score 1, 10 in score 2, and 6 in score 3. The mean CSAbs related to these scores were as follows: score 0: 12.3 ± 2.8 mm2, score 1: 12.3 ± 3.1 mm2, score 2: 14.95 ± 3.5 mm2, score 3: 19.3 ± 3.8 mm2 (Table 2). We also determined that the PI values in vessels of the median nerve were 4.1 ± 1.
The sensitivities and specificities of the sonographic parameters for a certain level in the diagnosis of CTS were presented in Table 3 (mean values, SD's, optimal cut-off values obtained from ROC curve).
DISCUSSION
There are many studies evaluating the value of HRUS (18) in an effort of finding new additional sonographic parameters to characterize the median nerve in patients with CTS (14, 19-21). Buchberger et al. (5), who were the first to quantify the anatomic changes in CTS using sonography, showed that an increase in the proximal or middle CSA of median nerve to 10 mm2, a distal flattening ratio above 3, or a displacement of the flexor retinaculum above 4 mm are sonographic signs suggestive of CTS. A previous report indicated that among these three findings, diffuse localized swelling and increased flattening of the median nerve were the most common findings (5). Increased bowing of the flexor retinaculum was seen less frequently (2, 3, 15).
It is known that there is a sudden change in the diameter of the median nerve in the longitudinal view, especially at the entry of the tunnel in a case of CTS. Therefore, the measurement of the nerve diameter just before the tunnel inlet in addition to measurement at the carpal tunnel might contribute to sonographic diagnosis of CTS (7). For this diagnosis, we measured the CSA at two levels and obtained CSAa and CSAb values. The nerve CSA indicating CTS ranged from 9 mm2 to 15 mm2, and the sensitivity and specificity of nerve swelling ranged from 57% to 97%, and from 65% to 97%, respectively (4, 5, 7, 12, 13). Our study revealed that the mean CSAb is 13.37 mm2 in CTS, which was significantly greater than the mean control group's CSAb, which was 9.4 mm2 (p < 0.001) (4). Receiver-operating characteristic analysis of CSAb revealed a value of 11 mm2 as the threshold level, with 76% sensitivity, and 77% specificity. These data agree with the findings reported by Sarría et al. (2) and Mallouhi et al. (14). Measurement just before tunnel inlet (CSAa) was not a clinically important predictor with a mean value of 7.24 mm2 for CTS patients and 7.21 mm2 in healthy volunteers. However, area difference between CSAa and CSAb provided additional confirmatory criterion for the diagnosis of CTS. We found 83% sensitivity and 82% specificity for the cut-off value for an area difference of 3.65 mm2. Klauser et al. (4) reported 95% sensitivity and 100% specificity for an area difference of 2 mm2.
Area difference seems to be a good parameter for the detection of CTS. However, it was not discussed in this study. We tried to find out another parameter that could be helpful in demonstrating this abrupt increase in nerve area under the retinaculum of patients with CTS. Additionally, we thought that body mass index, hand physiognomies, and body structure might influence the median nerve thickness. Increased weight and BMI have been suggested as risk factors for prolonged median nerve distal latency (9). So, it might be valuable to study these parameters in combination. We also combined values related to same median nerve. We calculated percentage area increase of CSAb in relation to CSAa, which was 83% with 55% sensitivity and 97% specificity. When we applied the cutoff value of 50%, which was derived from the ROC analysis, the sensitivity and specificity increased to as much as 85% and 85%, respectively. We determined that a CSAb of 11 mm2 alone was not sensitive enough for diagnosing CTS. When we applied the criteria for CSAb as 11 mm2, or a percent area increase of 50%, or both, the sensitivity increased to 93%. We saw that this additional parameter was useful in confirming the diagnosis of CTS.
It has been reported that the flattening ratio was highly variable and thus poorly predictive (1, 8, 11). The mean flattening ratios for patients and the control group were 2.7 and 2.4, respectively (52% sensitivity and 70% specificity). According to the Buchberger criterion of 3, this finding indicated that the flattening ratios were low (5). The results of this study indicate that the inclusion of patients in the early phase of the disease probably led to such findings related to CTS. It has been reported that the role of nerve flattening varied among studies, with sensitivities of 38-65% (5).
It is still not known exactly whether neuropathy develops as a result of intermittent mechanic compression or as a result of vascular compromise due to a rise in intracanal pressure (22). Perhaps both are responsible for the progression of CTS. The median nerve is supplied by a surface epineural, interfascicular, and intrafascicular vascular plexuses and are linked to one another to form a free vascular network. Vascular compromise seems to occur in 3 stages: 1) venous congestion, 2) nerve edema, and 3) impairment of the venous-arterial blood supplies (14). Previous reports indicate that there was an increase in expression of the vascular endothelial growth factor in a synovial tissue biopsy, thus denoting a particular activity in disease progression, which might explain the hypervascularization of the median nerve in CTS (22). By using power Doppler US, we quantitatively studied the vascularization of the median nerve at the carpal tunnel.
Power Doppler US based on total integrated power of the Doppler spectrum is considered superior to CDUS in the demonstration of vascular flow as a result of high sensitivity to slow flow, no angle dependency, and no aliasing (23, 24). In addition to the above mentioned parameters, the present study was performed to show vascular structures related to the median nerve. Even though PFS was rather subjective to judge by an objective index, upon demonstration of the differences in the number of vessels in the median nerve of patients with CTS, we decided to quantify the vessels to see whether there was any diagnostic value for the number of vessels. In our study, visualization of vessels by power Doppler US was a very limited signal, not seen in the control group and only seen in patients with very large nerves. We detected vessels in only approximately 50% of patients. Comparison of findings related to healthy volunteers and patients' median nerves showed that the detection of vessels should alert the radiologist of CTS. The purpose of the quantification of vessels was to evaluate whether the number of vessel was confirmatory for the diagnosis of CTS. We saw that a simple mean value, which was 1.2 ± 1.2, was not such a valuable finding. So, we decided to score the number of vessels using the criteria established in a modification of Klauser and Shio' s method used for the quantification of vessels in the metacarpophalangeal joints of patients with rheumatoid arthritis (16, 17, 25). And, we then evaluated the mean CSAb for each score, which increased as the score increased (score 0: 12.3 ± 2.8 mm2, score 1: 12.3 ± 3.1 mm2, score 2: 14.95 ± 3.5 mm2, score 3: 19.3 ± 3.8 mm2). The mean CSAb was 14,32 mm2 in nerves with vessels, compared to 12.3 mm2 in patient's nerves with no vessels. El Miedany et al. (9) recommended US cut-off points that discriminate between different grades of CTS severity (10-13 mm2 for mild symptoms, 13-15 mm2 for moderate symptoms and >15 mm2 for severe patients in relation to EMG grades). Because increased vascularization was the characteristic of a nerve with larger CSAb, thus indicating a more severe degree of CTS, we thought that the quantification of vessels in the median nerve with CTS by power Doppler ultrasonography might contribute to this valuable finding by El Miedany et al. (19) Grading is important in the management of patients, especially when deciding to whether or not to perform surgery. The aim of this study was not to determine the correlation of USG and the power Doppler findings with the grade of CTS. False negative results are possible in this image-based study. However, all the results related to this study showed that the quantification of vessels was a valuable finding for grading the CTS. The correlation between CSAb and the score related to the number of vessels in the median nerve determined by Doppler US was the secondary gain of this study. We also evaluated the PI values of vessels in the median nerve and found a mean value of 4.1 ± 1. To our knowledge, power Doppler US performed on the median nerve in patients with CTS, as well as the PI values of median nerve vessels have not yet been studied. Only one report studying the color Doppler US in CTS exists, but it did not have diagnostic case-control design and did not provide any knowledge about the normal median nerve vascularization and the amount of vessel in the median nerve with CTS. It has been suggested that nerve hypervascularization and nerve swelling yielded the best detectability of CTS (14). In our study the best detectability was obtained from nerve swelling and percentage area increase of CSAa in relation to CSAb, with a sensitivity of 93%.
The limitation of this study is the absence of a 'gold standard' for the evaluation of severity degree for CTS. The number of patients in this study is another limitation. We included only patients diagnosed by EMG. It is known that having a typical clinical picture of CTS with negative electrophysiological studies does not preclude the diagnosis of CTS. Future studies with a larger number of patients is required to develop a better scoring system by Doppler ultrasonography to evaluate the grade of CTS in correlation of a 'gold standard' (for example, EMG results). In addition, bowing of the retinaculum, median nerve echogenicity, and mobility are the other diagnostic US parameters we did not evaluate.
In conclusion, the present study revealed a high degree of sensitivity and specificity level in the diagnosis of CTS when CSAb was combined with percentage area increase. In addition, we showed that power Doppler US was also useful when the number of vessels in median nerve was scored.


 XML Download