

 PDF
PDF ePub
ePub Citation
 Print
Print


INTRODUCTION
Contrast-induced nephropathy (CIN) is a common complication of primary percutaneous coronary intervention (pPCI) and is associated with high mortality and morbidity, long hospital stay, and increased cost of health care in patients with ST elevation myocardial infarction (STEMI).1)2)3) Several clinical and laboratory variables were found to be associated with CIN development, including the type and volume of contrast media, advanced age (>75), diabetes mellitus (DM), chronic congestive heart failure, baseline hemoglobin level, and decreased renal perfusion.4)5)6)
The Syntax Score (SS), which indicates the extent and complexity of coronary artery disease, has been studied in STEMI patients and was found to be associated with long-term mortality, major adverse cardiac events, and CIN development.7)8) As a combined risk scoring system, Syntax Score II (SSII), which is calculated from clinical and angiographic variables, is found to be a better predictor of mortality than SS in STEMI patients.9) The association between SSII and CIN after pPCI has not yet been clearly defined. In this study, we aimed to assess whether high SSII is associated with CIN development and hemodialysis requirement. Additionally, we compared SS to SSII in terms of assessing CIN risk in STEMI patients treated with pPCI.
METHODS
Study population
A total of 1,508 patients with STEMI who underwent pPCI in Kars Kafkas University and Erzurum Ataturk University, Turkey, from June 2011 to June 2016, were retrospectively enrolled in this study. No patients were censored. STEMI was defined based on the following criteria: ongoing ischemic symptoms (within 12 hours of onset), typical increase or decrease in cardiac biomarkers, a new ST elevation in 2 or more contiguous leads, with leads V1, V2, and V3 measuring at least 0.2 mV or the remaining leads measuring at least 0.1 mV; or a newly developed left bundle-branch block.10) Patients previously diagnosed with end stage renal failure (26 patients), patients treated with emergent coronary artery bypass graft surgery (CABG) or those with a previous history of CABG (132 patients), and patients lacking the clinical data to calculate SSII (116 patients) were excluded from the study. A total of 1,234 remaining patients were ultimately included in the study. Hospital records indicated that all patients were treated according to current guidelines for STEMI treatment, which include aspirin, clopidogrel, enoxaparin, beta blockers, angiotensin converting enzyme inhibitors, and statins.10) Hospital records also indicated that all patients included in this study were hydrated with normal saline as soon as possible, as long as there was no contraindication (Killip class 3–4). Non-ionized, low osmolar contrast material (iohexol, Sterling Winthrop Inc., New York, NY, USA) was used in the procedures. Patient survival follow-up data was obtained from hospital records and reflects only in-hospital mortality. The study protocol was reviewed and approved by the Local Ethics Committee of Kafkas University Medical School (Approval number: 80576354-050-99/107) in accordance with the Declaration of Helsinki.
Data collection
The baseline clinical and demographic characteristics and previous history of the patients were obtained from hospital records. Blood biochemical variables and complete blood count were measured in all patients on admission. Blood samples were repeated for troponin T and creatine kinase myocardial band (CK-MB) every 6 hours until peak levels were reached and were repeated daily along with creatinine and hemoglobin levels. Estimated glomerular filtration rate (eGFR) was estimated using the Cockcroft-Gault formula from blood samples obtained on admission. CIN was defined as the impairment of renal function and was measured as either a 25% increase in serum creatinine from baseline or a 0.5 mg/dL increase in absolute value when there was no alternative etiology within 72 hours after the first procedure.11)12) Left ventricular ejection fraction (LVEF) was defined as post procedural ejection fraction and was assessed using the modified Simpson's method.
Angiographic analysis
All patients underwent selective coronary angiography using the Judkins percutaneous trans-femoral technique. The type of stent used (bare metal or drug eluting) and the decision to use tirofiban were left to the operator's discretion. Culprit lesions were treated with stent implantation and balloon angioplasty if necessary. Coronary angiograms were recorded in digital media for quantitative analysis (Dicom-viewer; MedCom GmbH, Darmstadt, Germany). Digital angiograms were analyzed by 2 independent and experienced interventional cardiologists who were blinded to all data. In the case of disagreement, the final decision was made by consensus with a third independent cardiologist. The left main coronary artery (LMCA), left anterior descending (LAD), circumflex (Cx), and right coronary artery (RCA) were defined as large coronary vessels. Each lesion with ≥50% stenosis and ≥1.5 mm in diameter was scored using the online SS calculator, version 2.1 (www.syntaxscore.com).13)14) The culprit lesions were scored using the angiographic views of the infarct-related arteries before any intervention. In the absence of flow, these were scored as total occlusions of less than 3 months duration, as reported in previous STEMI studies.15) SSII was calculated using an online calculator consisting of 2 anatomical variables (anatomical SS and LMCA disease) and 6 clinical variables (age, gender, chronic obstructive pulmonary disease [COPD], peripheral arterial disease [PAD], creatinine clearance [CrCL], and LVEF).16) Coronary blood flow patterns before and after pPCI were thoroughly evaluated on the basis of thrombolysis in myocardial infarction (TIMI) flow grade, using grades 0, 1, 2, and 3.17)
Statistical analysis
SPSS version 22.0 (SPSS Inc., Chicago, IL, USA), MedCalc version (trial) 16.8.4 (MedCalc Software, Mariakerke, Belgium), and R 2.15.1 (R Foundation, Vienna, Austria; http://www.r-project.org/) were used for statistical analysis. Continuous and categorical variables were expressed as mean±standard deviation and percentage, respectively. The characteristics of the patients in the CIN and control groups were examined using the t-test or Mann-Whitney U test for continuous variables and the χ2 test for categorical variables. Multivariable logistic regression (stepwise backward elimination) analysis was used to identify independent predictors of CIN and hemodialysis requirements. All variables with p value <0.05 in univariate analysis were included in the model. Model fit was assessed by the overall χ2 test, and the goodness of fit was assessed by the Hosmer-Lemeshow statistic. Receiver operating characteristics (ROC) curve analysis of the SS and SSII scores was performed using Youden's J statistic to calculate the optimal cutoff value for predicting CIN and hemodialysis requirements.18) In order to compare the SS and SSII curves that had been formed for CIN prediction, we used the method outlined by DeLong et al.19) We assessed the additive predictive value of SSII for predicting CIN using reclassification tables, net reclassification improvement, and integrated discriminative improvement methods, as described by Pencina et al.20) In-hospital survival curves were calculated using the Kaplan-Meier method, and differences in survival between the patients with and without CIN were compared using the log-rank test. p values <0.05 were considered statistically significant.
RESULTS
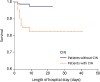
The study population consisted of 1,234 STEMI patients (mean age, 57±12 years; 80.7% male) who underwent pPCI. CIN developed in 13.5% (n=166) of the study population during index hospitalization. Demographic, clinical, laboratory, and coronary angiographic characteristics of all patients with and without CIN are listed in Table 1. SS and SSII were significantly higher in patients with CIN than in those without CIN (16.36±4.3 vs. 18.06±5.1; p<0.001 and 30.01±10.4 vs. 40.73±14.4; p<0.001, respectively). Patients with CIN were older and had greater incidence of DM, hypertension (HT), PAD, smoking, Killip class >1 on admission, cardiogenic shock, hypotension, and intra-aortic balloon pump use compared to those without CIN. Despite no statistical difference in frequency of dyslipidemia between the 2 groups, patients without CIN had a higher incidence of prior statin use (190 [17.8%] vs. 18 [10.8%]; p=0.024). White blood cell (WBC) count, C-reactive protein (CRP), CK-MB, baseline and peak creatinine levels, and contrast media volume were significantly higher, while hemoglobin level, eGFR, and LVEF were significantly lower in patients with CIN compared to those without CIN. The length of hospital stays (4.0 [3–6] days vs. 6.0 [4–9] days; p<0.001) and in-hospital mortality (1.6% vs. 15.1%; p<0.001) were significantly higher in patients with CIN (Table 1 and Figure 1).
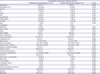
Table 1
Demographic, clinical, laboratory and coronary angiographic characteristics of all patients, patients with CIN and without CIN with p value
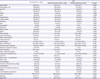
ASA = acetyl salicylic acid; ACEI = angiotensin converting enzyme inhibitor; ARB = angiotensin II receptor blocker; CIN = contrast-induced nephropathy; CK-MB = creatine kinase myocardial band; COPD = chronic obstructive pulmonary disease; CRP = C-reactive protein; DM = diabetes mellitus; eGFR = estimated glomerular filtration rate; HT = hypertension; IRA = infarct related artery; LAD = left anterior descending; LMCA = left main coronary artery; LVEF = left ventricular ejection fraction; PAD = peripheral arterial disease; SBP = systolic blood pressure; SS = Syntax Score; SSII = Syntax Score II; WBC = white blood cell.
Figure 1
Survival curve comparison between patients with and without CIN during hospitalization.
CIN = contrast-induced nephropathy.
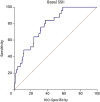
Multivariable regression analysis was used to determine the independent predictors of CIN using variables that were found to be associated with CIN development on univariate analysis (age, DM, HT, PAD, smoking, previous statin use, Killip class >1 on admission, WBC count, hemoglobin, CRP, peak CK-MB, baseline creatinine level, LVEF, eGFR, contrast volume, cardiogenic shock, hypotension and intra-aortic balloon pump use, SS, and SSII). Previous statin use (odds ratio [OR], 0.451; 95% confidence interval [CI], 0.221–0.922; p=0.028), hemoglobin (OR, 0.933; 95% CI, 0.896–0.972; p=0.001), contrast volume (OR, 1.011; 95% CI, 1.008–1.014; p<0.001), and SSII (OR, 1.031; 95% CI, 1.012–1.051; p<0.001) were found to be independent predictors of CIN development (Table 2). On multivariable analysis for CIN, the Hosmer and Lemeshow value was 8.991 (p=0.343). ROC curve analysis revealed the cutoff value of SSII for CIN prediction to be 34.1, with 62.0% sensitivity and 70.2% specificity (area under the curve [AUC], 0.723; 95% CI, 0.680–0.766; p<0.001; Youden's J statistic, 0.3293), while the cutoff value for SS was 14.7 with 80.7% sensitivity and 34.6% specificity (AUC, 0.601; 95% CI, 0.555–0.648; p<0.001; Youden's J statistic, 0.1527).
Table 2
Univariate and multivariable logistic regression analysis of demographic, clinical, laboratory and coronary angiographic characteristics for CIN and hemodialysis prediction

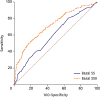
Because no definite classification of SSII exists, patients were not stratified into tertiles or quartiles according to SSII; instead, they were divided into 2 groups according to SSII cutoff value for predicting CIN (SSII ≤34.1 for the low group [n=813] and >34.1 for the high group [n=421]). There were significant differences between the groups with respect to duration of hospital stay, CIN, death, hemodialysis requirement, baseline SS, and baseline SSII (Table 3). The AUC for SSII was significantly higher than that of SS, and the difference between these areas was 0.122 (0.723 vs. 0.601; p<0.001). The ROC analyses for SS and SSII in the prediction of CIN are shown in Figure 2.
Table 3
Demographic, clinical, laboratory and coronary angiographic characteristics of SSII low and high groups with p value
ASA = acetyl salicylic acid; ACEI = angiotensin converting enzyme inhibitor; ARB = angiotensin II receptor blocker; CIN = contrast-induced nephropathy; CK-MB = creatine kinase-myocardial band; COPD = chronic obstructive pulmonary disease; CRP = C-reactive protein; DM = diabetes mellitus; eGFR = estimated glomerular filtration rate; HT = hypertension; IRA = infarct related artery; LAD = left anterior descending; LMCA = left main coronary artery; LVEF = left ventricular ejection fraction; PAD = peripheral arterial disease; SBP = systolic blood pressure; SS = Syntax Score; SSII = Syntax Score II; WBC = white blood cell.
Figure 2
ROC graphics to detect cutoff values of SS and SSII for CIN prediction.
CIN = contrast-induced nephropathy; ROC = receiver operating characteristics; SS = Syntax Score; SSII = Syntax Score II.
Previous reports have categorized patients as being at either low or high risk for developing CIN, using a risk of 20% as a cutoff value. When SSII was compared to SS, it resulted in a net reclassification improvement of 27.59% (p<0.001) and an improvement of 9.1% on integrated discrimination (p<0.001), as listed in Table 4.4)21)
Table 4
Changes in risk prediction for CIN development using SS vs. SSII

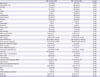
In our study, we also investigated the predictors for requiring hemodialysis in patients with CIN. Patients with CIN were classified into 2 groups according to hemodialysis status. Hemodialysis was required in 9.9% of CIN patients (n=15). Baseline demographic, clinical, laboratory, and angiographic characteristics of these patients are demonstrated in Table 5. The patients who required hemodialysis had a higher incidence of hypotension and higher baseline and peak creatinine levels than those who did not require hemodialysis. SS was similar between the 2 groups (17.62±4.9 vs. 16.13±4.6; p=0.267); however, SSII was significantly higher in hemodialysis patients compared to those who did not require hemodialysis (36.73±12.3 vs. 43.81±13.0, respectively, p=0.038). Logistic regression analysis showed that only hypotension (OR, 3.206; 95% CI, 1.118–9.189; p=0.03) and SSII (OR, 1.078; 95% CI, 1.046–1.078; p<0.001) were independent predictors of the need for hemodialysis (Table 2). On multivariable analysis for hemodialysis, the Hosmer and Lemeshow value was 5.264, p=0.729. The cutoff value of SSII for hemodialysis prediction in CIN patients was 44.01 with 62.5% sensitivity and 73.0% specificity (AUC, 0.692; 95% CI, 0.560–0.824; p=0.013; Youden's J statistic, 0.4674) (Figure 3).
Table 5
Demographic, clinical, laboratory and coronary angiographic characteristics of patients with CIN, requiring hemodialysis and without hemodialysis groups with p value
ASA = acetyl salicylic acid; ACEI = angiotensin converting enzyme inhibitor; ARB = angiotensin II receptor blocker; CIN = contrast-induced nephropathy; CK-MB = creatine kinase-myocardial band; COPD = chronic obstructive pulmonary disease; CRP = C-reactive protein; eGFR = estimated glomerular filtration rate; HT = hypertension; IRA = infarct related artery; LAD = left anterior descending; LMCA = left main coronary artery; LVEF = left ventricular ejection fraction; SBP = systolic blood pressure; PAD = peripheral arterial disease; SS = Syntax Score; SSII = Syntax Score II; WBC = white blood cell.
DISCUSSION
In this study, the relationship between SSII and CIN was evaluated in STEMI patients treated with pPCI. The main finding of our study was that SSII is an independent predictor of CIN development and the need for hemodialysis in STEMI patients.
Microemboli to the kidney and potential drug toxicity have been recognized as possible etiologic agents for post-percutaneous coronary intervention (PCI) renal failure, but most studies have focused on contrast nephropathy. CIN is associated with a poor prognosis after PCI. It is associated with high risk of renal failure and longer hospital stay. It is also associated with increased in-hospital, short-term, and long-term mortality.1)2)3) Previous studies showed that the rate of CIN development was significantly higher in MI patients who were treated with pPCI compared to those who underwent elective PCI.22) In our study, CIN developed in 13.5% of the patients. The mortality rate was 15.1% during the hospitalization period, and the hospital stay was longer in CIN patients, which is consistent with previous data. Given the high mortality rate in CIN patients, especially during early days of hospitalization (Figure 1), the ability to predict CIN is crucial. Several clinical and laboratory variables have been found to be associated with CIN development after pPCI. Concordant with previous studies,4)23) we observed that older age and history of HT and DM were associated with CIN development, but none of these were found to be an independent predictor of CIN on multivariable analysis.
Currently, the pathophysiology of CIN has not been fully elucidated. Possible mechanisms are chemokine damage, improper balance between vasoconstrictor and vasodilator levels, oxidative stress, and tubular necrosis.5)24) In addition to the type and volume of contrast media, baseline hemoglobin level and peri-procedural hemodynamic instability are the major determinants of CIN development.4)5)6) In our study, these variables were also found to be independent predictors of CIN. Additionally, statin use was found to be protective against CIN in our study, consistent with the findings of Subramaniam et al.25) The reason for this could be the pleiotropic effects of statins, which include the scavenging of free oxygen radicals and enhancement of vascular smooth muscle relaxation through increase of nitrous oxide production.26)
The SSII was first introduced by Farooq et al.16) and is composed of both clinical (age, gender, PAD, COPD, CrCl, LVEF) and anatomical (SS and LMCA disease) variables. The SSII has been reported to be more accurate than SS in estimating individual mortality risk associated with various revascularization strategies.15) Because of the associations between CIN and SSII variables, we hypothesized that SSII is be a strong predictor of CIN development than SS. Previous studies showed that CIN patients had high SS,8)27) and that SS was an independent predictor of CIN development, increased adverse outcomes, and need for hemodialysis in patients with STEMI.7) The results of our study were similar to these studies, showing that CIN is associated with prolonged procedural time and a greater amount of contrast used during the procedure. Also, the risk for CIN is higher in patients with PAD, LVEF ≤45%, eGFR <60 mL/min, and age >70 years.28)29) In our study, patients with CIN had an older age, reduced eGFR on admission, lower LVEF, and increased incidence of PAD. Therefore, it is plausible that patients with higher SSII would have increased incidence of CIN. In our study, SSII was significantly higher in CIN patients, and when SSII and SS were included together in multivariable analysis, SSII was found to be an independent predictor of CIN. It was also found that SSII was a better predictor of CIN than was SS on ROC curve analysis.
Hemodialysis was required in 15 patients, and these patients were compared with CIN patients who did not require hemodialysis. The CIN patients on hemodialysis had lower eGFR on admission, higher SSII, and higher incidence of hypotension. On multivariable analysis, only hypotension and SSII were found to be independent predictors of hemodialysis requirement in patients with CIN.
In conclusion, because of the relationship between CIN and poor outcome, risk scores and preventive measures must be established to protect patients against CIN. The main objective of the scores is to identify the patients at high risk for CIN and to make efforts to avoid dehydration, minimize contrast load, and administer statin therapy.
The combination of clinical and anatomic variables can more accurately identify patients who are at high risk for CIN after pPCI. In this study, contrary to isolated SS, higher SSII has been found to indicate an increase in CIN risk in STEMI patients undergoing pPCI. Interestingly, previously defined risk factors such as DM and HT were not found to be independent predictors of CIN development; however, these clinical conditions were common in our study's CIN group.
While SSII is harder to calculate than SS, it provides a better prediction of CIN. SSII is not yet an approved screening method for CIN; however, it might prove to be a suitable metric due to its ability to predict CIN and CIN-related in-hospital mortality.
Our study has a retrospective and cross-sectional design. For this reason, the study does not provide information on the prognosis of patients. In addition, there is no data on the long-term renal function of the study population. Additionally, the important variables related to CIN, such as hydration volume, nephrotoxic medications, and fluoroscopy time, were not addressed in our study.
 XML Download