

 PDF
PDF ePub
ePub Citation
 Print
Print


INTRODUCTION
With the advances in medical technology, the survival rate among patients with congenital heart disease (CHD) has increased. The number of adults with repaired CHD now is larger than the number of patients with CHD before operation.1) Renal dysfunction is one of the various complications that may occur in the distant postoperative period. The causes of renal dysfunction include low cardiac output, congestion, and cyanosis. Particularly, congestion and cyanosis strongly influence renal function.2)3) In patients who have undergone Fontan surgery, congestion and low cardiac output frequently exist, and estimated glomerular filtration rate (eGFR) <90 mL/min/1.73 m2 was observed in approximately 10% of cases in the remote phase.4) However, there are few reports on renal dysfunction in patients after biventricular repair. Moreover, several years after surgery, estimated glomerular filtration rate (eGFR) <90 mL/min/1.73 m2 has been considered an indicator of renal dysfunction. There are few studies on whether changes in the values of biomarkers of other renal functions occur before the eGFR declines, except in the postoperative acute phase. Even if the eGFR is ≥90 mL/min/1.73 m2, cardioprotection by release of congestion and suppression of the renin-angiotensin-aldosterone system may be useful for renal protection when other indicators of renal function are abnormal. Here, we examined whether early fluctuation of biomarkers of renal function occurs in the remote period after biventricular repair in patients with CHD.
METHODS
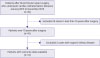
We conducted a retrospective study that included patients with CHD who underwent cardiac catheterization in the Department of Pediatrics of Asahikawa Medical University Hospital between January 2015 and December 2016. Of the 32 patients who underwent biventricular repair surgery, 14 patients who had no organic kidney disease >10 years after surgery were included. Sixteen patients in less than 10 years after surgery and 2 patients with organic kidney disease were excluded (Figure 1). Written informed consent was obtained from the patients or the parents of each patient prior to catheterization. All procedures performed in studies involving human participants were in accordance with the ethical standards of the Institutional Review Board and/or national research committee and with the 1964 Helsinki declaration and its later amendments or comparable ethical standards (approval number: 17125).
The underlying diseases among these patients were as follows: transposition of the great artery (TGA, n=5), tetralogy of Fallot (TOF, n=3), double outlet right ventricle (DORV, n=2), ventricular septal defect (VSD), and coarctation of the aorta (CoA, n=1), pulmonary atresia (PA) and VSD (n=1), atrioventricular septal defect (AVSD, n=1) and Bland-White-Garland syndrome (n=1). For calculation of eGFR, the following formula for correcting with creatinine (Cr) and cystatin C (CysC) was used.
For children age <19 years, the following formula was used to determine eGFR-Cr: eGFR=110.2×(reference serum Cr/patient's serum Cr)+2.93. Reference serum Cr levels (y) are determined using the following equations of body length (x): y = −1.259x5+7.815x4−18.57x3+21.39x2−11.71x+2.628 in males and y=−4.536x5+27.16x4−63.47x3+72.43x2−40.06x+8.778 in females.5) For children age <18 years, the following formula was used to determine eGFR-CysC: eGFR=(104.1/CysC)−7.8.6) For adults age >19 years, the following formulas were used to determine eGFR-Cr: eGFR=(194×Cr−1.094×Age−0.287) in males and (194×Cr−1.094×Age−0.287)×0.739 in females.7) For adults age >18 years, the following formulas were used to determine eGFR-CysC: eGFR=(104×CysC−1.019×0.996age)−8 in males and (104×CysC−1.019×0.996age×0.929)−8 in females.8) The first urine early in the morning was used in the urine examination. Urinary microalbumin, β2-microglobulin (B2MG), and N-acetyl-β-D-glucosaminidase (NAG) were measured as urinary biomarkers.
The patients underwent cardiac catheterization for hemodynamic parameter evaluation. All patients had the same anesthesia protocol during cardiac catheterization, which included intravenous infusion of thiopental and midazolam, blood sampling for the measurement of the oxygen content, and cardiac index (CI) measurement. Oximetry data were used to calculate intracardiac blood flow using Fick's principle. Ventricular volumes were calculated from biplane cineangiocardiograms and expressed as a percentage of normal values.9)
All parameters are expressed as median (range) values. Statistical differences were determined using Mann-Whitney's U test and a χ2 analysis or Fisher's exact test. A p value <0.05 indicates statistical significance. Statistical calculations were performed using the Statistical Package for the Social Sciences version 24.0 (IBM Corp., Armonk, NY, USA).
RESULTS
Table 1 shows the demographic characteristics, history, presentation, and outcome of the 14 patients who underwent biventricular repair. The median age of the 14 patients was 18.5 years (12–29), and 50% were males. The median postoperative period was 16 years (10–26) and the median number of operations was 1.5 (1–5). Six patients (43%) showed cyanosis before radical treatment, and the period of cyanosis was from 5 months to 5 years. As the current status, 12 patients had New York Heart Association (NYHA) class I and 2 had NYHA class II heart failure, and there were no cases of NYHA class III or IV heart failure. Two patients with NYHA class II heart failure developed palpitations during exercise. One patient had cyanosis and oxygen saturation was 86%. Cardioprotective drugs and diuretics were administered in 4 (29%) patients.
Table 1
Demographic characteristics, history, presentation, and outcome of the 14 patients who underwent biventricular repair
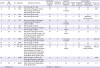
ACEi = angiotensin-converting enzyme inhibitor; ARB = angiotensin II receptor blocker; ASO = arterial switch operation; AVSD = atrioventricular septal defect; BWGS = Bland-White-Garland syndrome; CoA = coarctation of the aorta; DORV = double outlet right ventricle; DU = diuretics; ICR = intracardiac repair; mBT = modified Blalock-Taussig; NYHA = New York Heart Association; PA = pulmonary atresia; PAB = pulmonary artery banding; TGA = transposition of the great artery; TOF = tetralogy of Fallot; VSD = ventricular septal defect.
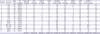
Table 2 shows the data from laboratory tests. For eGFR-Cr, the median value was 113 mL/min/1.73 m2 (85–171), and one patient had eGFR <90 mL/min/1.73 m2, which indicates chronic kidney disease. For eGFR-CysC, the median value was 117 mL/min/1.73 m2 (92–146), and no patient had eGFR <90 mL/min/1.73 m2. The median serum Cr was 0.54 mg/dL (0.37–0.83), the median serum CysC was 0.81 mg/L (0.58–1.04), and the median serum uric acid was 5.3 mg/dL (3.1–7.5). The median urine protein-to-urine Cr ratio was 0.04 (0.01–0.10), and 1 patient had urine protein-to-urine Cr ratio ≥0.2, which is the standard of proteinuria. The median urine albumin-to-creatinine ratio (UACR) was 8.3 mg/gCr (3.0–175.6). UACR ≥10 mg/gCr was considered a risk factor for cardiovascular disease in 6 (43%) patients. The diagnoses of 6 patients were as follows: TGA (1), TOF (1), DORV (2), PA and VSD (1) and AVSD (1). The median urine NAG-to-urine Cr ratio was 2.8 U/gCr (0.8–8.6) and the median urine B2MG was 90 μg/L (30–300), and both of which showed obviously high values in a few patients.
Table 2
Demographic and laboratory data

AVSD = atrioventricular septal defect; BWGS = Bland-White-Garland syndrome; CoA = coarctation of the aorta; Cr = creatinine; CysC = cystatin C; DORV = double outlet right ventricle; eGFR = estimated glomerular filtration rate; PA = pulmonary atresia; TGA = transposition of the great artery; TOF = tetralogy of Fallot; UA = uric acid; UACR = urine albumin-to-creatinine ratio; U-B2MG = urine β2-microglobulin; U-NAG/Cr = urine N-acetyl-β-D-glucosaminidase-to-urine creatinine ratio; U-prot/cre = urine protein-to-urine creatinine ratio; VSD = ventricular septal defect.
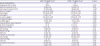
Table 3 shows the hemodynamic data. The median central venous pressure (CVP) was 6 mmHg (2–18), and 2 patients had CVP ≥10 mmHg. The median right ventricular ejection fraction (RVEF) was 59% (33–72), and the median right ventricular end-diastolic volume from the normal value (%RVEDV) was 122% of the normal value (84–268). There were 5 patients with RVEF <50% and 3 patients with %RVEDV ≥150% of the normal value. The median left ventricular end-diastolic pressure was 12 mmHg (4–16), the median left ventricular ejection fraction (LVEF) was 58% (43–73), and the median CI was 3.6 (2.2–5.9). There were 2 patients with left ventricular end-diastolic pressure ≥15 mmHg and 5 patients with LVEF <50%, and 5 patients with CI <3.
Table 3
Demographic and hemodynamic data
%LVEDV = left ventricular end-diastolic volume from the normal value; %RVEDV = right ventricular end-diastolic volume from the normal value; AVSD = atrioventricular septal defect; BP = blood pressure; BWGS = Bland-White-Garland syndrome; CI = cardiac index; CoA = coarctation of the aorta; CVP = central venous pressure; DORV = double outlet right ventricle; LVEDP = left ventricular end-diastolic pressure; LVEF = left ventricular ejection fraction; LVP = left ventricular pressure; PA = pulmonary atresia; RVEDP = right ventricular end-diastolic pressure; RVEF = right ventricular ejection fraction; RVP = right ventricular pressure; SpO2 = blood oxygen saturation level; TGA = transposition of the great artery; TOF = tetralogy of Fallot; VSD = ventricular septal defect.
Subsequently, we compared examination values between patients with UACR <10 mg/gCr (8 patients) and those with UACR ≥10 mg/gCr (6 patients), and examined each examination value for any abnormalities (Table 4). A significant difference in RVEF and deviation in %RVEDV between those with UACR <10 mg/gCr and those with UACR ≥10 mg/gCr was found (median RVEF, 61% vs. 43%; p=0.043; median %RVEDV, 114% of the normal vs. 156% of the normal, p=0.029). Although no significant difference was found, cyanosis before biventricular repair was noted in 2 (25%) patients with UACR <10 mg/gCr and in 4 (67%) patients with UACR ≥10 mg/gCr. Among them, the period in which 2 patients in UACR <10 mg/gCr group had cyanosis was 5 months and 3 years, the period in which 4 patients in UACR ≥10 mg/gCr group had cyanosis was 1 year 5 months, 2 years 5 months, 4 years, and 5 years. The median number of surgeries was 1 (1–3) in those with UACR <10 mg/gCr and 2.5 (1–5) in those with UACR ≥10 mg/gCr (p=0.043). No significant difference in CVP, CI, and left heart system parameters was observed. One patient (13%) in UACR <10 mg/gCr group and 3 patients (50%) in UACR ≥10 mg/gCr group were taking angiotensin-converting enzyme inhibitor (ACEi) or angiotensin II receptor blocker (ARB).
Table 4
Demographic and laboratory data of patients with UACR <10 mg/gCr (n=8) and patients with UACR ≥10 mg/gCr (n=6)
Data are given as median and range.
%LVEDV = left ventricular end-diastolic volume from the normal value; %RVEDV = right ventricular end-diastolic volume from the normal value; ACEi = angiotensin-converting enzyme inhibitor; ARB = angiotensin II receptor blocker; Cr = creatinine; CVP = central venous pressure; CysC = cystatin C; eGFR = estimated glomerular filtration rate; LVEDP = left ventricular end-diastolic pressure; LVEF = left ventricular ejection fraction; LVP = left ventricular pressure; RVEDP = right ventricular end-diastolic pressure; RVEF = right ventricular ejection fraction; RVP = right ventricular pressure; UA = uric acid; UACR = urine albumin-to-creatinine ratio; U-B2MG = urine β2-microglobulin; U-NAG/cre = urine N-acetyl-β-D-glucosaminidase-to-urine creatinine ratio; U-prot/cre = urine protein-to-urine creatinine ratio.
DISCUSSION
In this study, in addition to describing the characteristics of patients in the remote period after biventricular repair, we evaluated the early fluctuation of biomarkers of renal function. An eGFR value <90 mL/min/1.73 m2 is an indicator of chronic kidney disease. One patient had eGFR-Cr <90 mL/min/1.73 m2 and no patient had eGFR-CysC <90 mL/min/1.73 m2 in the remote period after biventricular repair of CHD. In addition, one patient had a urine protein-to-urine Cr ratio ≥0.2. Six (43%) patients had UACR ≥10 mg/gCr, which is a risk factor for cardiovascular disease. In children, the eGFR-Cr value is difficult to compare between cases because of muscle mass problems. Thus, CysC is useful for eGFR calculation among children as it is not affected by muscle mass. Moreover, a previous study reported that CysC itself is useful for evaluating renal function after CHD surgery.10) The hemodynamics of patients after biventricular repair are not extremely different from those of healthy people; hence, only few studies on how cardiac function abnormalities in the remote postoperative period affect the renal function and on early evaluation of renal function have been conducted. Elevated UACR (i.e., 30 to 300 mg/gCr) is originally an early predictor of progressive renal function loss in types 1 and 2 diabetes.11)12) However, recently, many reports showed that adult patients with high UACR have an increased risk of developing cardiovascular diseases. Previous reports also demonstrated that the risk of developing cardiovascular disease increases even if the UACR is <30 mg/gCr.13)14)
The cause of urinary microalbumin generation is glomerular hypertension and endothelial dysfunction.15) After CHD surgery, glomerular hypertension and endothelial dysfunction may occur due to hemodynamic problems in the remote postoperative stage, and under such circumstances, microalbumin levels could easily increase. In addition, eGFR declines only after renal impairment progresses to some extent. In one report, 10% of patients had eGFR <90 mL/min/1.73 m2 in the remote period after Fontan surgery and 10% of patients had proteinuria.4) Among those with eGFR <90 mL/min/1.73 m2, the period of time leading to curative surgery was long, and the duration of cyanosis was long. However, since 90% of cases had eGFR ≥90 mL/min/1.73 m2, early identification of renal damage with eGFR and proteinuria was difficult.
Furthermore, a previous report showed that 43% of patients who underwent Fontan surgery had UACR >20 mg/gCr in the remote phase.16) Hence, even after Fontan surgery, UACR could be an early marker of renal dysfunction rather than eGFR. An eGFR may underestimate renal function, especially after Fontan surgery, because the serum Cr value decreases because of muscle weakness.4) Thus, microalbumin measurement is essential. In this study, the rate of cyanosis before operation possibly affected UACR. Patients who underwent palliative surgery tended to have a long period of cyanosis. Therefore, when divided into 2 groups by UACR, there was a significant difference in the number of operations. In the presence of cyanosis, it is known that an increase in shear stress due to polycythemia affects renal function, and proteinuria is exacerbated by kidney interstitial fibrosis.17) This effect is thought to last long and there is a possibility that cyanosis before surgery may be affected our results. Moreover, despite the normal eGFR after biventricular repair, abnormal UACR was noted in a number of cases. Then, 3 out of 6 patients with abnormal values of UACR had taken ACEi or ARB. Hence, UACR measurement could be used to determine potential renal dysfunction and, in some cases, to perform medical interventions for both cardioprotection and renal protection at early stage.
Here, parameter abnormality of the right heart system is possibly involved in the occurrence of UACR abnormality. Similarly, a previous report noted that the rise in CVP affects renal function markers, such as serum Cr and eGFR, in adult patients with heart failure, whereas CI and LVEF have no effect on serum Cr and eGFR.3) Increased CVP directly affects renal blood flow and renal function.18) Venous congestion is also reported to be the most important hemodynamic factor causing worsening of renal function in adults.19) In our case, 2 patients with CVP ≥10 mmHg recognized UACR. Several patients with UACR ≥10 mg/gCr also had right ventricular dysfunction. If right ventricular function is poor, CVP could easily increase depending on the circumstance, such as during exercise. This, in turn, may result in an increase in UACR. Thus, we assume that not only eGFR evaluation but also a detailed assessment of renal function, including microalbumin levels, is important especially in cases wherein right heart function declines in the remote postoperative period.
This study had some limitations. First, our patient sample size was small. Second, the urinary biomarkers were inspected only once; multiple tests similar to those in the diagnostic criteria of chronic kidney disease are necessary for an accurate evaluation. Moreover, the change in the examination value over time is also important. Hence, further studies are needed.
In conclusion, after biventricular repair of CHD, no patient had eGFR-CysC <90 mL/min/1.73 m2 in the distant postoperative period, and 43% of patients showed increased UACR. In patients with UACR ≥10 mg/gCr, right heart system abnormality was observed, and several patients had cyanosis before radical treatment. Measurement for UACR may be able to detect renal dysfunction early in the postoperative remote period.
 XML Download