

 PDF
PDF ePub
ePub Citation
 Print
Print


INTRODUCTION
Transcatheter aortic valve implantation (TAVI) has become a valid option for patients with severe symptomatic aortic stenosis (AS) who are in inoperable condition or at intermediate or high-risk for conventional surgical aortic valve (AV) replacement.1)2)3)4) TAVI was first introduced into Korea in March 2010. Thereafter, the Korean Food and Drug Administration (KFDA) approved use of a device for TAVI, with Medtronic CoreValve in November 2011 and Edwards Sapien XT valve in April 2012 for the treatment of severe, symptomatic AS. The TAVI procedure is now being performed in 26 hospitals in Korea. Although several randomized controlled trials including Placement of Aortic Transcatheter Valves (PARTNER), PARTNER 2 and Surgical Replacement and Transcatheter (SURTAVI) trial demonstrated efficacy and safety of TAVI within a selected cohort of patients and hospitals, there have been no large-scale reports on the clinical outcomes of TAVI after marketing approval in Korea.1)2)3)4) The multicenter Korean-TAVI (K-TAVI) registry aims to investigate the outcomes of this emerging therapy in real-world clinical practice in Korea. Here we report the results of the first cohort of K-TAVI registry that is enrolled during June 2015 and June 2017, and analyzed the 1-year mortality and other clinical outcomes in overall and subgroups depending on the surgical risk.
METHODS
The first cohort of K-TAVI registry
The first cohort of K-TAVI registry is a retrospective registry that enrolls consecutive patients undergoing TAVI at 17 participating hospitals in Korea for 24 months during June 2015 and June 2017. The registry complies with the Declaration of Helsinki, and the relevant review boards at all participating hospitals approved the study protocol (approval number: SNU IRB 1706-150-863). All patients underwent TAVI were requested to be enrolled in this nation-wide K-TAVI registry.
The current study population consisted of 576 patients who had severe AS and underwent TAVI using the Sapien XT or Sapien 3 balloon-expandable valves (Edwards Lifesciences, Irvine, CA, USA), CoreValve or Evolut R self-expandable valve (Medtronic, Seoul, Korea), and Lotus valve (Boston Scientific, Marlborough, MA, USA) via transfemoral (TF) or transapical (TA) approach between Jun 1, 2015 and Jun 30, 2017. Participating centers have collected clinical information on patient demographics, comorbidities, functional status, hemodynamics, procedural details, and in-hospital, 30-day, and 1-year outcomes. Data quality checks were implemented at the steering committee meeting of K-TAVI registry, including data quality feedback reports and data range and consistency checks. If the patients did not visit the clinic, the attending physician contacted the patient and/or family members by telephone.
Patient selection for TAVI
Consecutive patients who underwent TAVI for severe symptomatic AS during June 2015 and June 2017 were included in this study. Patient eligibility for a TAVI procedure was decided in each center by a multidisciplinary team composed of interventional cardiologists, imaging cardiologists, cardiothoracic surgeons, radiologists and anesthesiologists. General criteria for severe AS included a mean gradient ≥40 mmHg, jet velocity ≥4.0 m/s, effective orifice area ≤1.0 cm2, or effective orifice area index ≤0.8cm2/m2. Valve annulus size was measured using both computed tomography (CT) and echocardiography. All patients underwent a pre-procedural CT scan. Vascular access and pre-procedural balloon aortic valvuloplasty (BAV) were determined per site protocol. Access site was chosen prior to the procedure, in a step-wise manner based on anatomical considerations such as the angle of the aortic root, vessel diameter, and aortic calcification severity. Iliofemoral access was considered as the first option for all available patients. The local heart team of each institution evaluated each patient’s preoperative data and selected patients for whom TAVI was deemed to be the best treatment option.
TAVI procedure
The TAVI procedures were conducted in a hybrid operating room or conventional catheterization laboratory room under general anesthesia or conscious sedation, with transesophageal echocardiography or bed side transthoracic echocardiography. Premedication with aspirin (100 mg) and clopidogrel (75 mg) was administered unless particular contraindications exist. In a TF approach, a 14–20 Fr sheath was inserted into the femoral artery by puncture. In case of TA approach, a 16–20 Fr sheath was inserted in the left ventricular (LV) apex through a minimal left anterior thoracotomy. BAV was performed under rapid ventricular pacing when needed. Dual antiplatelet therapy (aspirin 100 mg and clopidogrel 75 mg) was usually administered for at least 6 months after the procedure.
Definitions and outcome measures
Device success was defined as: 1) successful vascular access, delivery, and deployment of the device, and successful retrieval of the delivery system; 2) correct position of the device in the proper anatomical location (placement in the annulus with no impedance on device function);(3) intended performance of the prosthetic valve without moderate or severe paravalvular leakage (PVL) assessed by echocardiography; and 4) only 1 valve implanted in a proper anatomical location.5)6)7) Procedural success was defined as device success with the absence of an in-hospital major adverse cardiovascular and cerebrovascular event (MACCE). Procedure time was defined as time elapsed from the first vascular puncture or skin incision to final closure.
Primary outcome of the present study was death from any cause. The secondary outcomes were death from cardiac cause, death from non-cardiac cause, stroke, disabling stroke, major bleeding, and composite of death from any cause and disabling stroke. Death was considered cardiac unless an unequivocal non-cardiac cause could be established. Stroke, as indicated by neurological deficits, was confirmed by a neurologist on the basis of imaging modalities. A disabling stroke is defined as a stroke with symptoms that last for more than 24 hours, leaving permanent disability. Major bleeding was defined according to the Valve Academic Research Consortium (VARC)-2 bleeding classification.6) All clinical events were based on clinical diagnoses assigned by the treating physician and centrally adjudicated according to the source documentation by an independent group of clinicians.
Statistical analysis
Categorical variables are presented as numbers and percentages and compared with the χ2 test or Fisher's exact test. Continuous variables are presented as mean±standard deviation and compared using Student's t-test or the Wilcoxon rank sum test. To assess whether there was any trend in the occurrence of complications by the year of operation, a χ2 test for trend was performed. Time-to-event data analysis was performed with the Cox proportional hazards model. Kaplan-Meier survival curves were drawn to assess differences between groups for the time to an event. A stepwise option was used to determine independent predictors of the outcome variables. All tests were 2-tailed at the p-value of less than 0.05 as significance. All statistical analyses were conducted using the R statistical computing environment ver. 3.3.2 (R Development Core Team, Vienna, Austria) and the Statistical Package for Social Sciences, version 22 (IBM Corporation, Armonk, NY, USA).
RESULTS
The first cohort of K-TAVI
Total 576 TAVI cases were enrolled in the first cohort of K-TAVI registry and the case number increased throughout 2 years between June 2015 and June 2017 (Figure 1). Most of the TAVI procedures were done for septuagenarians and octogenarians (90.8%) and the median age was 79 years (Table 1). Median Society of Thoracic Surgeons (STS) predicted risk of mortality was 5.2 (3.0 to 9.0) and 144 patients (34.7%) had high surgical risk (STS ≥8). Mean effective orifice area of AV were 0.69±0.18 cm2 with mean pressure gradient (PG) of 54.0±19.2 mmHg. AV morphology of bicuspid was 8.5% (n=49) (Table 1).
Figure 1
Reported TAVI cases over time in Korea.
STS = Society of Thoracic Surgeons; TAVI = transcatheter aortic valve implantation.
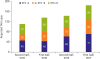
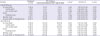
Table 1
Baseline clinical and echocardiographic characteristics depending on the surgical risk profiles
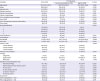
Data shown are median (IQR), mean±standard deviation, or number of patient (%).
AV = aortic valve; CABG = coronary artery bypass graft; CAD = coronary artery disease; EuroSCORE = European System for Cardiac Operative Risk Evaluation; IQR = interquartile range; LM = left main; LV = left ventricular; NYHA = New York Heart Association; PG = pressure gradient; STS, Society of Thoracic Surgeons.
Procedural characteristics
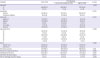
Most TAVI procedures were performed by the TF route (98.3%) and a total of 358 procedures (62.2%) were performed in hybrid rooms. The mean procedure time was 76.3±33.4 minutes and 83.5% of total procedures were performed under general anesthesia and (Table 2). Patients with high-risk associated with longer duration whole hospitalization and longer hospital stay after TAVI (Table 2). Device success for TAVI was achieved in 533 cases (92.5%). Seven cases required additional transcatheter heart valve implantation during the procedure. Two cases were converted to open-heart surgery due to aortic dissection and LV perforation.
Table 2
Procedural characteristics in subgroups depending on the surgical risk profiles
In-hospital and 30-day outcomes
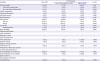
Ninety-eight percent of patients (n=563) were discharged alive (Table 3). There was no difference in the incidence of in-hospital complications between the high surgical risk group and the others. There were 19 cases of VARC major bleeding (3.3%), 7 cases of stroke (1.2%), 5 cases of myocardial infarction (0.9%) and 4 cases of cardiac tamponade (0.7%). Permanent pacemaker (PPM) was implanted in 5.6%. Major bleeding was significantly decreased in the second year compared with the first year (5.7% vs. 1.5%; p=0.006). Among 567 patients with available in-hospital echocardiographic follow-up data, moderate or severe PVL at discharge was observed in 6.0% with no significant differences between the first and the second year. Mean duration of hospitalization was 11.9±7.5 days with a trend of shortening over time (12.6±7.7 days vs. 11.4±7.2 days; p=0.060).
Table 3
Procedural complications and in-hospital outcomes depending on the surgical risk profiles
Among 532 patients who completed 30-day clinical follow-up, the incidences of all-cause death and the composite of all-cause death or disabling stroke were 2.6% and 3.5%, respectively (Table 4). The incidence of New York Heart Association (NYHA) class III or IV dyspnea 30-day after TAVI was only 0.6% (n=3). Among 399 patients with available 30-day echocardiographic follow-up data, moderate or severe PVL was observed in 6.0%. This incidence of moderate or severe PVL was significantly decreased in the second year (8.6% vs 3.7%; p=0.040).
Table 4
Clinical outcomes at 1-month and 1-year depending on the surgical risk profiles
Data shown are number of patient (%) not otherwise specified. Adjustment variables include age, sex, atrial fibrillation, bicuspid aortic valve, diabetes mellitus, hypertension, extent of coronary artery disease, and presence of left main disease.
CI = confidence interval; HR = hazard ratio; STS = Society of Thoracic Surgeons.
*Events rates were estimated with the use of Kaplan-Meier estimates and p value was derived from the log-rank test.
One-year outcomes depending on the surgical risk profiles
Overall patient
All-cause death occurred in 8.9% and cardiovascular death, in 3.3%. The cumulative incidence of the composite of all-cause death or disabling stroke was 10.8% (Figure 2 and Table 4). There was no difference in the risk of all-cause death or disabling stroke at 1-year between bicuspid and tricuspid AV (Supplementary Figure 1). In 192 patients who completed transthoracic echocardiography follow-up to 1 year, only 9.9% of patients had moderate or severe PVL (Figure 3A). Echocardiographic parameters regarding mean PG and effective orifice area were well maintained up to 1 year (Figure 3B). Cox multivariate analysis showed age (hazard ratio [HR], 1.087; 95% confidence interval [CI], 1.036–1.141; p=0.001), moderate or severe PVL (HR, 4.631; 95% CI, 1.624–13.203; p=0.004) and ESRD (HR, 5.785; 95% CI, 2.717–12.316; p<0.001) were the main contributors for all-cause death at 1 year.
Figure 2
Clinical outcomes in whole population of the first cohort of K-TAVI registry.
K-TAVI = Koran-transcatheter aortic valve implantation.
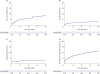
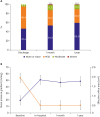
Figure 3
(A) Changes in the degree of PVL till 1-year in the patients who underwent echocardiographic examinations all 3-time points, at discharge, 1-month, and 1-year (n=192). (B) Changes in mean PG and effective orifice area over time (orange line = mean PG; blue line = effective orifice area).
PG = pressure gradient; PVL = paravalvular leakage.
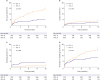
STS scores and outcomes
We analyzed the 1-year clinical outcomes depending on the surgical risk profiles, high-risk versus low to intermediate risk group (Table 4 and Figure 4). Total mortality at 1 year was significantly better in low to intermediate surgical risk group than high-risk one (5.4% vs. 15.5%, p<0.001). Cardiovascular death was also numerically lower in low to intermediate risk group than high-risk one, which did not reach statistical significance. Mortality differences emerged early after the procedure and maintained in follow-up period up to 1 year.
The reasons for TAVI in patients with low STS score and age <75
Table 5 summarizes the causes of TAVI in patients with low surgical risk and age less than 75 years. Among total 60 patients, 32% have several comorbid conditions unfavorable to surgery while 68% refused surgery. Half of them received heart-team agreement while the other half did not.

DISCUSSION
The major findings of this study were as follows. In the first cohort of K-TAVI registry between June 2015 and June 2017, total number of TAVI was growing during study period. In-hospital, 1-month, and 1-year all-cause mortality were low, which was comparable or better than other studies. The 65% of TAVI procedures are performed in low to intermediate surgical risk population. The 1-year mortality was significantly better in the low to intermediate risk patients than the high-risk ones.
In this manuscript, we presented the result of the first cohort of K-TAVI program. In-hospital and 30-days all-cause death in our study were 2.3% and 2.6%, respectively. It was comparable with those in other reported registries.8)9)10) All-cause death and disabling stroke rate at 1-year was lower than those in other literatures.8)9)10)
In K-TAVI registry, the rate of peri-procedural complication was very low and VARC major bleeding was significantly decreased in the second year of study period. Introduction of a low-profile sheath and pre-procedural screening systems using multidetector CT can be the important contributing factors to these favorable outcomes. It is interesting to note that the rate of PPM implantation was only 5.6%. This may be due to the adequate device selection, meticulous procedure, high threshold for pacemaker implantation, relatively longer hospital stays, and low rate of pre-existing conduction disturbance. The association between post-procedural PVL and long-term prognosis has been widely reported. Our result also demonstrated that moderate or severe PVL was associated with 1-year mortality. The incidence of moderate or severe PVL decreased in the second year compared with the first which might be due to the development of devices with dedicated sealing skirts and improved valve selection process and procedural skill. Therefore, this issue will be of less clinical importance in the future.
The present analysis revealed significantly higher 1-year mortality rate in the high-risk patients than in the low to intermediate surgical risk ones. This phenomenon might be related with the higher prevalence of underlying co-morbidities such as high rates of hemodialysis which has been shown to be a very strong outcome predictor after TAVI.11) Previous studies that assessed the causes of death after TAVI have shown some variability of results; however, all agree that beyond the early period after TAVI, non-cardiac death account for a large proportion of all deaths.12)13) These non-cardiac deaths may be an important reason for the poor long-term survival of high-risk patients. Recent guidelines or expert opinions have expanded the indication of TAVI in patients with intermediate surgical risk or with age over 75. In the first cohort of K-TAVI registry, about 10% of patients were younger than 75 and had low-risk. The most frequent reason why non-high-risk patients underwent TAVI in K-TAVI registry was patients' refusal of surgery or comorbid conditions that were not well acknowledged in STS scoring system, such as chronic lung disease, frailty, or liver cirrhosis. In case of patients' refusal, the half got surgeons' agreement while the other half did not.
This study was a retrospective registry with a relatively small sample size. The follow-up duration was also short. However, as the K-TAVI registry is the ongoing program sponsored by Korean Society of Interventional Cardiology, the results of next cohorts will be presented in the future.
The first cohort of K-TAVI registry enrolled between June 2015 and June 2017 revealed that the 1-year outcomes of TAVI were favorable in real-world Korean patients demonstrating the very low rate of procedural complications and comparable mortality to other clinical studies. Two-thirds of patients were low to intermediate surgical risk group and demonstrated a significantly lower mortality at 1 year than the high-risk group.
 XML Download