

 PDF
PDF ePub
ePub Citation
 Print
Print


INTRODUCTION
Diastolic blood pressure (DBP) is less featured compared with systolic blood pressure (SBP), which showed stronger ability for prediction of ischemic heart disease (IHD) or stroke mortality than DBP.1) A SBP treatment target of SBP for hypertension patients has been documented as ‘the lower, the better’.2) However, the risk of excessive blood pressure (BP) control is important, particularly for the isolated systolic hypertension (ISH) patients, as there are few modalities to treat DBP and SBP separately. If low DBP is one of the mortality risk factors for general population, clinicians may pay attention to the baseline risk assessment before prescription to avoid this factor.
The J-curve phenomenon between low DBP and cardiovascular events has been repeatedly reported in treated hypertensive2)3)4) or coronary artery disease (CAD) patients.5)6)7)8)9) In cohort studies with general population, the Prospective Studies Collaboration reported a linear association between BP and risk of death without any specific threshold from 115/75 mmHg.1) In a similar study in Asia Pacific region, the same linear trend of cardiovascular mortality was seen in subjects with BP 115/70 mmHg or higher.10) While these findings have played a major role in the wide acceptance of ‘the lower, the better’ hypothesis for BP control,2) in the figure of the former study, the risk of the lowest DBP level (70–75 mmHg) was observed to be slightly higher than that of the linear line.1)2)
On the contrary, the inverse association of low DBP and mortality risk was revealed in other studies of general population. Ohasama study reported a J-shaped relationship of 24-hour DBP with cardiovascular mortality in subjects with DBP lower than 65 mmHg after the 10.8-year follow-up of 1,332 adults.10) In MOnica, Risk, Genetics, Archiving, and Monograph (MORGAM) project with 34 European cohorts, stroke risk was negatively associated with BP in the low DBP group (<71 mmHg).12)
In our previous report focused on SBP, Yi et al.13) found the J-curve association between SBP and vascular mortality in a large cohort with more than 1 million adults, but the association with DBP was weak.
However, the baseline risk of low DBP in general population has not been fully explored besides arising concern. There is not enough information to presume the relationship between DBP and mortality risk for individuals in each DBP level or specific conditions such as age, diabetes mellitus (DM), and tobacco smoking status. Thus, we reanalyzed our data to determine the predictive risk for atherosclerotic vascular diseases (ASCVD), IHD, and all-cause mortality focusing on low DBP groups through analysis of 22.5 million person-years prospective cohort of general population.
METHODS
Study participants
The Korean Cancer Prevention Study (KCPS) cohort includes 1,329,525 individuals (482,618 women) aged 30 to 95 years who participated at least 1 routine medical checkup provided by the Korean Medical Insurance Corporation (a former branch of the National Health Insurance Service [NHIS]) between 1992 and 1995.13)14) The republic of Korea achieved universal health coverage at 1989. With the exception of medical aid beneficiaries (3%), 97% of Koreans are covered by the NHIS, which provide regular health examinations for all as a benefit.14) Excluded participants were; 1) 1,809 who died or censored during the year of enrollment, 2) 50,645 with self-reported diagnosis of cancer, liver disease, respiratory disease, or cardiovascular diseases such as heart disease, stroke or hypertension before or at the baseline survey, 3) 25,600 with missing information on tobacco smoking, alcohol intake, BP, fasting blood glucose levels, total cholesterol (TC) levels, or exercise status, and 4) 17,036 with missing or an extremely low body mass index (BMI <15.0 kg/m2). Thus, 1,234,435 participants (445,180 women, 36.1%) were finally included in the analysis. The Institutional Review Boards of Yonsei University and the Johns Hopkins University Bloomberg School of Public Health approved the study.
Data collection
All participants underwent medical examinations at local hospitals under contract with the KMIC. Standard mercury sphygmomanometers or automatic manometers were used to check BP in a seated position by registered nurses or trained technicians. TC and glucose levels were measured from a fasting serum specimen. Each participating hospital in the examination was under the external quality control procedures supervised by the Korean Association of Laboratory Quality Control. Tobacco smoking (never, former, current), alcohol intake (grams of ethanol per day), and current participation in physical exercise (yes or no) were also collected through self-reported questionnaires. Height and weight were measured while the participants wore light clothing without shoes, and BMI was calculated as weight in kilograms divided by height in meters squared (kg/m2). For participants who underwent ≥2 examinations, data from the first examination was used.13)14)16)
Follow-up and outcomes
Mortality of participants from 1993 through December 31, 2012 was confirmed with death records from the National Statistical Office of Korea. The follow-up was conducted through record linkage at the national level. The main outcomes for this study were death from all-cause, ASCVD (I10–I15 [hypertensive diseases], I20–I25, I44–I52, I60–I69, I70–I74 [diseases of arteries], R96 [other sudden death with cause unknown]), IHD (I20–I25), and total stroke (I60–I69), as defined by the International Classification of Diseases, 10th revision.13)14)
Statistical analysis
DBP was classified into 8 groups (<60 [range, 10–59], 60–69, 70–79 [reference group], 80–89, 90–99, 100–109, 110–119, and ≥120 [range, 120–280] mmHg). The DBP category with the lowest vascular risk was used as the referent group. Chi-square tests and t-test were performed to compare the differences between men and women. Cox proportional hazards models were used to evaluate the association between DBP at baseline and mortality, and the analyses were adjusted for the following covariates: age at entry (continuous), sex, tobacco smoking status (never, former, current smoker), alcohol intake (g/d; 0, 1–20, >20), physical activity (yes, no), TC (mg/dL; continuous), fasting serum glucose (mg/dL; continuous), and BMI (kg/m2; continuous). SBP was adjusted as a continuous variable to examine whether the effects of DBP are independent from those of SBP.
A stratified analysis was performed according to age at entry (30–59 or 60–95 years elderly group) to examine whether the association varied according to age group. Sex, DM, smoking status-stratified analysis was also done. In additional analyses, we excluded all deaths that had occurred in the first 2 years (n=61) and the first 5 years (n=30,729) of follow-up.
Two-sided p values were calculated, and the statistical significance level was set at 0.05. All statistical analyses were performed using SAS version 9.4 (SAS Institute, Cary, NC, USA).
RESULTS
A total of 22.5 million person-years, mean 18.2 years were followed up. Deaths were documented in 193,903 cases including 42,885 ASCVD deaths. Crude death rate was 861.8 per 100,000 person-years. At baseline, mean age, SBP, DBP were 46.6 years, 123.4 mmHg, and 80.0 mmHg, respectively. Elderly group, those who are 60 or older, was 10.6% in men and 21.3% in women. Current smokers at baseline were 58.9% in men, and 4.1% in women (Supplementary Table 1).
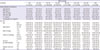
The lowest level of DBP (<60 mmHg) was shown more in women (69.7%), lower SBP, lower TC, and lower BMI, while age (mean 49.7 years) was higher than the mean age. They had lower proportion of current smokers, current drinkers, and individuals who exercise regularly. Both high and low DBP was associated with old age. Among individuals aged 60 years or older, the highest proportion was shown in the highest DBP category (29.8%), following the lowest DBP category (23.5%). The lowest proportion (10.7%) of this group was shown in DBP 70–79 mmHg (Table 1).
Table 1
Baseline characteristics of the study participants by DBP categories (n=1,234,435)
A total death in subjects with DBP <60 mmHg was 1,153, and the crude death rate was 1,057.6 per 100,000 person-years, which was higher than the death rate of 619.6 among the reference level (DBP, 70–79 mmHg). The hazard ratios (HRs) (95% confidence interval [CI]) of mortality due to all-cause, ASCVD, and IHD, estimated for those DBP <60 mmHg compared to 70–79 mmHg group were 1.23 (95% CI, 1.16–1.30), 1.37 (95% CI, 1.20–1.57), and 1.34 (95% CI, 1.01–1.79), respectively, after adjustment for sex, age, tobacco and alcohol use, exercise status, BMI, fasting glucose, TC, and SBP. The HRs for total, ASCVD, and IHD deaths were also significantly higher among those with DBP level of 60–69 mmHg than those of the reference level (Table 2).
Table 2
Person-year, death cases, death rates, and HRs from multivariable adjusted model of total death by DBP categories (n=1,234,435)

MV adjusted model was adjusted for sex, age, tobacco and alcohol use, exercise status, BMI, fasting glucose, TC, chronic diseases, and SBP.
ASCVD = atherosclerotic cardiovascular diseases; BMI = body mass index; CI = confidence interval; DBP = diastolic blood pressure; HR = hazard ratio; IHD = ischemic heart disease; MV = multivariable; SBP = systolic blood pressure.
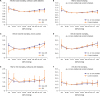
The shape of the curve on HRs and 95% CI from multivariable adjusted model of total and cardiovascular mortality in DBP groups showed J-curve in both men and women, while the association between low DBP and mortality from IHD weakened. Low DBP, as well as high DBP was associated with total mortality regardless of age. However, risk of cardiovascular mortality was associated with low DBP only in elderly older than 60 years (Figure 1). The increased HRs for total and cardiovascular mortality in low DBP groups was also found regardless of their tobacco smoking status. The stratification analysis of DM showed the same relationship in those with or without DM (Figure 2).
Figure 1
HRs from multivariable adjusted model of total, ASCVD, and IHD death by DBP categories stratified by sex and age. Multivariable adjusted HRs for total, ASCVD, and IHD mortality by 8 categories of DBP stratified by sex and age. The referent category for DBP was 70–79 mmHg. Each dot indicates HRs, and vertical lines over the dots mean 95% CIs. Age was divided into 2 groups: 30–59 years and 60 years or older (range: 60–95 years). (A, C, E) Blue line shows results in men, and orange line in women. (B, D, F) Blue line means ≥60 years age group, and orange line means 30–59 years age group. The y-axis scale was different for the 3 outcomes (0–2.0 or 0–2.5).
ASCVD = atherosclerotic cardiovascular diseases; CI = confidence interval; DBP = diastolic blood pressure; HR = hazard ratio; IHD = ischemic heart disease.
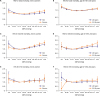
Figure 2
HRs from multivariable adjusted model of total, ASCVD, and IHD deaths by DBP categories stratified by diabetes and tobacco smoking. Multivariable adjusted HRs for total, ASCVD, and IHD mortality by 8 categories of DBP stratified by diabetes and tobacco smoking status. The referent category for DBP was 70–79 mmHg. Each dot indicates HRs, and vertical lines over the dots mean 95% CIs. (A, C, E) Blue line shows results in non-DM participants, and orange line in DM participants. (B, D, F) Blue line means ex- or non-smokers, and orange line means current smokers. The y-axis scale was different for each result (0–1.60 to 0–3.50).
ASCVD = atherosclerotic cardiovascular diseases; CI = confidence interval; DBP = diastolic blood pressure; DM = diabetes mellitus; HR = hazard ratio; IHD = ischemic heart disease.
Among men, the mortality risk was higher in those with DBP <60 mmHg (HR, 1.61, 95% CI, 1.32–1.96) compared to those in the highest DBP category (DBP ≥120 mmHg) (HR, 1.58, 95% CI, 1.43–1.74). For total mortality, DBP 60–69 mmHg also showed an increased risk in both men and women (HR, 1.12, 95% CI, 1.09–1.15 in men; HR, 1.05; 95% CI, 1.01–1.09 in women; Supplementary Table 2). Both age groups, adults aged 30–59 years and elderly with age 60 or older, had an increased risk of total mortality (HR, 1.26; 95% CI, 1.12–1.40; HR, 1.21; 95% CI, 1.13–1.30, respectively; Supplementary Table 3), which were similar in both smoker or non-smoker (Supplementary Table 4). DM patients showed no significant associations with mortality risk in the lowest DBP group. However, in subjects within DBP 60–69 mmHg category, they had increased risk for total mortality (HR, 1.12, 95% CI, 1.04–1.20) and IHD mortality (HR, 1.48, 95% CI, 1.10–2.00; Supplementary Table 5).
The association between the lowest DBP groups and increased risk for all-cause and cardiovascular mortality remained significant after excluding initial 2 years or initial 5 years of follow-up. Participants with DBP <60 mmHg or DBP 60–69 mmHg groups had higher cardiovascular mortality after excluding initial 5 years of follow-up (HR, 1.42; 95% CI, 1.22–1.64; HR,1.08; 95% CI, 1.02–1.14, respectively; Supplementary Table 6).
DISCUSSION
Increased risk of all-cause death in the lowest DBP category group were maintained in men or women, 30–59 or ≥60 years, smoker or non-smoker, or DM or non-DM subgroups. However, the risk for ASCVD death in 30–59 years and DM group, and risk for IHD death in most subgroups except elderly were weak.
These results showed that there was a consistently increased mortality or cardiovascular disease risk in the lowest DBP group of <60 mmHg, particularly in older adults. While the DBP 60–69 mmHg group also showed increased risk for all-cause mortality, the significance of the risk was relatively unstable in several subgroups.
One explanation for this result is that ISH treatment may cause the DBP depletion at least among the elderly participants who develop hypertension within follow-up period. ISH is known to increase according to age. Prevalence of ISH was about 25.5% in elderly aged 60 years or older in NHANES 2005–2010 data.17) There has been a debate on the subject of target SBP levels expressing concern over excessive lowering of BP. This seems to be partly because there is no medication that can control the SBP and DBP separately, particularly among ISH patients.
In 2014, the 8th Joint National Committee report for the management of high BP in adults recommended SBP goal of lower than 150 mmHg, rather than 140 mmHg, to the general population aged 60 years or older.18) This recommendation was based on the proved benefit from randomized clinical trials with a goal of lower than 150/90 mmHg. There were also studies comparing strict (SBP goal of <140 mmHg) vs. mild (SBP goal of 140–160 mmHg in subjects aged 65–85 years or 140–149 mmHg in those aged 70–84 years) treatment groups in elderly.19)20) The outcome of the 2 treatment groups did not differ significantly in the 2 studies.
Solini and Grossman21) also suggested SBP goal of 140 to 150 mmHg in elderly patients with diabetes and ISH, ‘providing the DBP is >60 mmHg’. This was because many ISH patients have low DBP, and treatment for SBP would also lower their DBP. Potential benefits from reduced SBP seemed to be offset by the risk of low DBP. Our result support these previous suggestions because of the increased risk of all-cause death in the low DBP population in 30–59 years or elder group, or DM/non-DM subgroups. However, it should be clarified clearly that our cohort participants are general population. Also, some hypertension patients may be included, though initial exclusion of the self-reported diagnosis of hypertension, particularly among those who had higher BPs at baseline.
The reference range of the DBP of current analysis was 70–79 mmHg due to the lowest risk, whereas the former report's reference range of DBP was 60–69 mmHg.13) However, DBP 60–69 mmHg seems to be too low as a reference in this analysis focusing on DBP. BP has been known to increase the risk linearly from DBP 75 mmHg.1) In a Japanese prospective study, the risk increased among those who had 24 hours ambulatory DBP below 65 mmHg.11) Increased risk of stroke was observed at lower DBP below 71 mmHg in elderly.12) When combined, DBP 60–69 mmHg appears to be too low for risk analysis, and we concluded that it may be appropriate to measure the risk of those who have DBP 70–79 mmHg.
Even though Yi's study13) showed that the risk increased below DBP 60 mmHg, additional studies were necessary to emphasize the findings. The J-curve phenomenon is more prominent in this study. The model is identical with the former one, which adjusted for multiple known confounding factors including SBP. Therefore, the significant association found in this research between low DBP and mortality was independent even from SBP.
The mechanism of the J-curve has been explained by hypoperfusion during diastole particularly in cardiovascular patients. Coronary perfusion occurs during diastole rather than systole. Therefore, when DBP is lower than 60 mmHg, coronary blood flow to provide blood to myocardium is insufficient.5)8) According to the mechanism, IHD or CAD patients with low DBP have higher risk of cardiac events due to the decreased perfusion during diastolic period. The presence of J-curve was reported in patients with end-organ damage, such as CAD.3)4)7) This feature was more prominent in IHD patients because of their damaged myocardium and decreased cardiac function. However, the increased risk of low DBP groups has been reported not only in the IHD patients but also in healthy adults. In a study of 11,565 community dwellers without cardiovascular diseases or heart failure in ARIC cohort, DBP <60 mmHg group had increased mortality. They had higher high-sensitivity cardiac troponin-T level, which helped explain the process of cardiac event through myocardial damage even in those without cardiovascular diseases.8)
Epidemiological studies also reported risk of the lowest BP groups in several areas, such as Asia,11) Europe,12) and North America.22) ARIC cohort in North American also included relatively large number of African Americans (25%).8)
However, in the North American-Framingham Heart Study, analysis was performed on the higher SBP group to assess the risk of low DBP. In a cross-classification of SBP and DBP groups of 1,439 CVD cases, subjects with DBP 70–79 mmHg and SBP ≥180 mmHg showed a higher risk (odds ratio [OR], 9.0; 95% CI, 4.5–18.2), than those with DBP 80–89 mmHg and SBP ≥180 mmHg (OR, 2.4; 95% CI, 1.3–4.5), compared to the SBP >120 mmHg and DBP >70 mmHg group.22) In the European-MORGAM project, the outcome variable was stroke, rather than heart diseases.12) In Ohasama study of Japan, the BP was measured by 24 hours ambulatory BP monitoring, which have higher sensitivity and less accessibility than usual BP.11)
A major strength of this study is that it is from a large cohort data including more than 1 million participants which had a number of cases with low DBP. This enabled the analyses among the age, sex, tobacco smoking status and DM subgroups with low DBP. It was hard to find such subgroup result other than sex or age in previous studies.12)
The cohort also has a prospective design with long-term duration (mean 18.2 years). Complete follow-up was available, using the universal healthcare coverage managed by electronic data exchange in the Korean NHIS.15)23)
Although we cannot exclude the possibility of reverse causation, we omitted participants with history of cardiovascular diseases including known hypertension from their enrollment to control bias. Even when we excluded all death or censored cases in the initial 2 years or initial 5 years, the J-curve association was maintained. These additional analyses were to ensure sensitivity of the results (Supplementary Table 6).
While the number of IHD cases was relatively small compared with western countries, it is a well-known phenomenon in Korea. The age-standardized incidence rate of hospitalized acute myocardial infarction had decreased from 41.6 cases per 100,000 persons in 2006 to 29.4 cases per 100,000 persons in 2010, which was smaller than those of stroke: 172.8 in 2006, and 135.1 in 2010.24) However, the statistical power in some IHD groups was weak due to the small numbers.
Another important limitation is the possibility of misclassification; 1) Measurement of BP by 2 methods, 2) lack of data on repeated measurement and medical records, 3) preference for decimal numbers, 4) chance to miss the diagnosed or medicated hypertension patients at baseline, 5) chance to miss the new onset or medicated hypertension patients, and 6) other measurement or data management errors. Therefore, we cannot exclude the possibility of missed or newly developed hypertension patients after baseline checkup. Careful interpretation should be taken also the data may include hypertension patients who did not report or did not know about their diseases or medication. It is unlikely that patients who are taking medicine have high chances to be missed. But, newly developed hypertension patients, particularly ISH patients, may contribute to the risk in low DBP groups. High standards for BP measurement have been widely adopted. However, in large epidemiological studies, single measure of BP has been used as meaningful data.13)25) In a comparison research with statistical models using the single baseline-only model or repeated BP measures, there was modest benefit in the ‘cumulative mean of SBP model’, but little further improvement from any of other methods.26) When we assume this misclassification by measurement error was non-differential, it is known that the association tends toward null.25)27) In our result, we found significant association even with this limitation of analysis. It would be beneficial to use average value of BP with multiple measure in future studies.
While the homogeneity within Korean participants may be understood as an advantage, this finding should not be directly generalized to other ethnic population.13)14)
Finally, the presence of J-curve association in low DBP group is consistent with the results from other Asian, European, and American reports, and we added more clarification and new information on several subgroups.8)11)12)20)
In conclusion, using the KCPS data, a prospective cohort with 22.5 million person-years and mean 18.2 years of follow-up, J-curve relationship between DBP lower than 60 mmHg and increased risks of all-cause death was found in all participants and subgroups such as men or women, 30–59 or ≥60 years of age, smoker or non-smoker, and DM or non-DM. In terms of the risk of ASCVD and IHD death, the association was more noticeable in the elderly. With additional information on several subgroups, the results of this study were consistent with other reports on various ethnic populations. The baseline mortality risk in the general population with low DBP may be considered for risk assessment, particularly in case of interventions that lower DBP below 60 mmHg. Further research is needed to clarify the influence of hypertension incidence, treatment, or medication to the increased risk in low DBP group.
 XML Download