

 PDF
PDF ePub
ePub Citation
 Print
Print


INTRODUCTION
Despite recent advances in primary prevention and therapeutic technology, cardiovascular disease accounts for more than 17 million deaths worldwide each year, as reported by World Health Organization. Coronary heart disease is the most common type of cardiovascular disease and acute myocardial infarction is one of the leading causes of death in developed countries. Acute coronary syndrome (ACS) is a broader spectrum terminology based on a common pathogenesis, which includes unstable angina, non-ST-segment elevation myocardial infarction (NSTEMI), and ST-segment elevation myocardial infarction (STEMI). Pathogenesis of ACS has been extensively investigated ex vivo and in vivo, the findings of which have been applied to its prevention and treatment in daily practice.1)2)3)4)5)6)
The term “vulnerable” is defined by the English dictionary as “susceptible to injury or susceptible to attack”, suggesting the conditional likelihood of an event occurring in the future. The term “vulnerable plaque” was originally proposed by Muller et al.7) Given that it is now widely accepted that intraluminal thrombus is critical for the transition from chronic to acute clinical condition, the current definition of “vulnerable plaque” should encompass plaque susceptible to the development of occlusive coronary thrombosis.4)5)8)9)10) Although the pathology varies for plaque at high risk of coronary thrombosis, rupture is the leading mechanism causing coronary thrombosis and ACS. Thus, contemporary literature often uses the term “vulnerable plaque” to denote plaque susceptible to rupture.
Histopathology studies have characterized vulnerable plaque based on autopsy findings, however, these characterizations are limited in that the cross-sectional and retrospective observation of cadavers do not allow the identification of plaque at increased risk for future events. The advent of high-resolution, intracoronary imaging modalities has enabled visualization of coronary arteries in vivo and consequently has expanded our knowledge on the mechanisms of atherosclerosis and thrombus formation in the coronary arteries of living subjects. This article aims to summarize the growing evidence on vulnerable plaques assessed by intracoronary imaging modalities.
DEFINITION OF VULNERABLE PLAQUE
As described above, the final trigger that transforms an atherosclerotic plaque into a culprit lesion of ACS is an occlusive thrombus formation on the plaque surface, which leads to downstream myocardial damage.6) Autopsy studies have revealed 3 major mechanisms for coronary thrombosis: plaque rupture, plaque erosion, and calcified nodules.8)10)11) Although the prevalence of underlying mechanisms depends on population characteristics, previous studies have revealed that plaque rupture accounts for 60–70% and plaque erosion accounts for 30–40% of coronary thrombosis.8)10) As an atheromatous plaque grows, the necrotic core (NC) may become larger and the fibrous cap overlying it may become thinner by action of inflammatory cells and cytokines. Thereafter, the fibrous cap becomes disrupted by an imbalance between intrinsic vulnerability and external trigger, which exposes thrombogenic substrates such as smooth muscle cells, NC containing collagen in extracellular matrix, and macrophages to circulating blood. Consequently, both platelet and coagulation cascades are triggered, which leads to thrombus formation.4)5)6)8)9) In general, pathological features of vulnerable plaque include thin fibrous cap, large NC, macrophage infiltration within the plaque, positive remodeling, cholesterol clefts, and neovascularization.8)12) Of note, the combination of atherosclerotic plaque with thin fibrous cap and large lipid core, also known as thin cap fibroatheroma (TCFA), is recognized as a hallmark of vulnerable plaque.8)13)14)
VULNERABLE PLAQUE IMAGED BY INTRAVASCULAR IMAGING MODALITIES
Since percutaneous coronary intervention has emerged as the primary mode of revascularization, intravascular imaging modalities have been developed as adjunctive to coronary angiography. Given its superior resolution compared to non-invasive imaging, intravascular imaging has been utilized to evaluate culprit lesions of ACS and further understand plaque vulnerability (Table 1).15)
Table 1
Comparison of intravascular imaging modalities for visualization of vulnerable plaque

Intravascular ultrasound (IVUS) was introduced in the late 1990s and has been the standard for intravascular imaging in catheterization laboratories. Conventional IVUS provides grey-scale cross-sections of coronary arteries with an axial resolution of approximately 100–250 µm. The key advantage of IVUS imaging is excellent tissue penetration, which enables visualization of whole vessel structures and further analysis of vessel remodeling. However, the combination of low spatial resolution of IVUS and its grey-scale representation does not effectively allow detailed visualization of the plaque phenotype. These limitations have been in part overcome by IVUS-based post-processing methods including virtual-histology IVUS (VH-IVUS), integrated backscatter IVUS (IB-IVUS), and iMAP,16)17)18)19) each of which superimposes a color scheme on greyscale images to represent distinct plaque characteristics. Of these modalities, the most widely used is VH-IVUS, by which plaque composition is classified into 4 categories: fibrous in green; fibrofatty in light green; NC in red; and dense calcium in white (Figure 1).16)
Figure 1
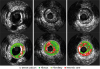
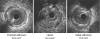
A lesion with a necrotic core assessed by VH-IVUS. A fibroatheroma was imaged by grey-scale IVUS (upper row) and VH-IVUS (lower row). VH-IVUS categorizes the tissue into DC, FT, FF, or NC by processing the radiofrequency data of IVUS. In general, a plaque containing >10% of NC is defined as fibroatheroma. When NC is adjacent to the lumen >30 degrees of circumferences on 3 consecutive frames, fibroatherma is defined as VH-TCFA, as proposed in the PROSPECT study. The lesion in the third column contains >10% of NC, but the angle of NC adjacent to the lumen is not >30 degrees. Therefore, the lesion is defined as ThCFA.
DC = dense calcium; FT = fibrous tissue; FF = fibrofatty tissue; IVUS = intravascular ultrasound; NC = necrotic core; PROSPECT = Providing Regional Observations to Study Predictors of Events in the Coronary Tree; ThCFA = thick-cap fibroatheroma; VH-IVUS = virtual-histology intravascular ultrasound; VH-TCFA = virtual-histology-derived thin-cap fibroatheroma.
Optical coherence tomography (OCT) has emerged as a high-resolution imaging modality since it was introduced to catheterization laboratories in the early 2000s.20)21)22) Given the high-resolution images with approximately 20 µm axial resolution, OCT is currently the most widely used modality to visualize micro-structures of coronary plaque (Figure 2).23)24) In addition, OCT can be used to identify thrombus, an essential component of the ACS.25) A principal advantage of OCT is its utility in characterizing the vulnerable component of plaque. Specifically, OCT differentiates lipid, fibrous tissues, and calcifications denoted by signal attenuation patterns. Lipid rich plaque is characterized by signal-poor regions surrounded by diffuse borders and overlaying signal-rich bands corresponding to fibrous cap.26)
Figure 2
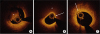
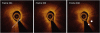
Typical OCT findings representing vulnerable plaques. (A) shows intraluminal thrombus characterized by a mass (*) attached to the wall (9–12 o'clock). (B) shows TCFA characterized by a signal poor region (*) with a thin, signal rich band (white arrow) on the luminal side. (C) shows a fibrous plaque with neovascularization characterized by a tubuloluminal, signal lucent structure (white arrow) within the plaque.
OCT = optical coherence tomography; TCFA = thin cap fibroatheroma.
Coronary angioscopy, with a resolution of 10–50 µm, is a unique technique that allows direct visualization of the luminal surface of coronary artery and detection of thrombus by endoscopy (Figure 3).27) With angioscopy, plaque characteristics can be categorized according to surface color. Normal coronary arteries appear as glistening white and advanced atherosclerotic plaques appear yellow.28) However, due to its complexity and technical difficulty, angioscopy has not been widely utilized in clinical practice.
Figure 3
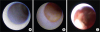
Coronary plaques imaged by angioscopy. Angioscopy allows direct visualization of coronary plaques surface from the luminal side. Plaque characteristics is categorized by color grading: white (grade 0); light yellow (grade 1); yellow (grade 2); or intensive yellow (grade 3). (A) shows white plaque (grade 0) and (B) shows yellow plaque (grade 2). In addition to the color grade, presence of thrombus and plaque disruption can be visualized by angioscopy. (C) shows a plaque rupture with red thrombus.
Near-infrared spectroscopy (NIRS) is a relatively new imaging modality, which allows automated evaluation of lipid-containing plaque (Figure 4). The current version of NIRS provides a color-coded spectrum, which is co-registered with grey-scale IVUS. The probability of having lipid inside a plaque is calculated from the NIRS spectral data for each pixel of 0.1 mm length and 1 degree angle. Although NIRS provides quantitative assessment of lipid, it does not provide visually detectable morphological features of plaque vulnerability, such as the depth of lipid.
Figure 4
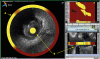
A lipid-rich plaque imaged by NIRS. A culprit lesion of NSTEMI was examined by NIRS co-registered with grey-scale IVUS. NIRS provides a probability of the presence of lipid ranging from 0 to 1.0 for each pixel occupying 0.1 mm and 1 degree, which is indicated on a map of lumen surface called “chemogram” (Right upper panel). The information of the probability is superimposed on the rim of grey-scale IVUS (A). In the center of grey-scale IVUS and in the right lower panel, “block chemogram” which summarizes the probability value of each 2-mm segment is shown (B). Numbers of pixels of which the probability is >0.6 is expressed as permil, and called LCBI. Max LCBI4mm is generally used as an indicator of lipid volume (C).
IVUS = intravascular ultrasound; LCBI = lipid core burden index; Max LCBI4mm = Maximal LCBI value within a 4 mm-segment; NIRS = near-infrared spectroscopy; NSTEMI = non-ST-elevation myocardial infarction.
TCFA
As it is currently understood, fibrous cap is the final frontier to prevent a lipid-containing atheromatous plaque from rupturing. Therefore, thinning of fibrous cap is one of the most significant factors determining plaque vulnerability. Pathology studies have defined cut-off thickness of “thin” fibrous cap as 65 µm. This threshold was derived from a morphometric analysis of 41 ruptured plaques, among which 95% (2 standard deviations) of the caps measured <64 µm.8)29) OCT, with its high axial resolution, is the only in vivo modality which can be used to measure fibrous cap thickness of atheromatous plaque.30) When this ex vivo cut-off value was tested in 71 ruptured plaques by OCT,31) 95% of ruptured plaque showed fibrous cap thickness <80 µm. Thus, a fibrous cap thickness of <80 µm in vivo corresponds to 65 µm in pathological analysis.
Subclinical plaque rupture, or those plaques that did not cause clinical events, were also frequently seen by pathology or by intravascular imaging.15)32) Tian et al.33) examined a total of 126 lipid-rich plaques including 49 ruptured culprit lesions, 19 ruptured non-culprit lesions, and 58 non-ruptured TCFA in 86 patients suffering from ACS who underwent OCT and IVUS. In this study, fibrous cap thickness determined by OCT was shown to be the best measure to differentiate ruptured plaque from non-ruptured TCFA. It was suggested that thin-fibrous cap accompanied by large NC represents a characteristic feature of vulnerable plaque, consistent with the concept of TCFA previously proposed by pathologists.8)14)
Identification of TCFA has also been tried with use of other intravascular imaging modalities. The Providing Regional Observations to Study Predictors of Events in the Coronary Tree (PROSPECT) study by Stone et al.34) proposed a definition of TCFA based on VH-IVUS findings. Due to the limited resolution of VH-IVUS to identify thin fibrous cap <65 µm, virtual-histology-derived thin-cap fibroatheroma (VH-TCFA) was alternately defined as a fibroatheroma showing >10% of confluent NC and >30° abutting to the lumen in 3 consecutive slices.34)35) In implementing this definition, the PROSPECT study demonstrated that VH-TCFA, large plaque burden ≥70%, and minimal lumen area ≤4.0 mm2 at non-culprit lesions is independently associated with lesion-related adverse events at the median of 3.4 years follow-up. In a direct comparison of OCT-derived TCFA and VH-TCFA, with the pathology as gold standard,36) both OCT and VH-IVUS demonstrated acceptable differentiation of TCFA from other types of plaques with diagnostic accuracy ranging from 80% to 85%. Although different definitions were used, TCFA derived by OCT or by angioscopy predicted future events comparable to VH-TCFA reported in the PROSPECT study.
Uemura et al.37) investigated the OCT predictors for angiographic plaque progression at 7 months in 69 plaques. They showed that TCFA and microvessels were more frequently observed in plaques that had significant progression at 7 months. OCT may potentially provide even higher predictive value for future events given superior resolution as compared with VH-IVUS. A prospective study demonstrating the clinical significance of OCT-derived TCFA is warranted.
Unlike OCT, angioscopy is not able to quantify fibrous cap thickness. However, intensive yellow color of luminal surface generally represents superficial lipid and corresponds to TCFA (Figure 3). Takano et al.38) compared angioscopy and OCT findings of 205 plaques in 26 patients, and demonstrated that fibrous cap thickness measured by OCT was significantly thinner in yellow plaques in comparison with white plaques. The cut-off fibrous cap thickness that differentiated yellow plaque was 110 µm.
POSITIVE REMODELING AND LARGE NC
A large NC accompanied by expansive vessel remodeling is a common feature of vulnerable plaque.6)8)14) At present, IVUS is thought to be the most suitable intravascular imaging modality to evaluate plaque burden and vessel remodeling (Figure 5). Morphometric analysis of a plaque is performed by tracing external elastic membrane (EEM) and lumen contour followed by further calculations. In general, plaque plus media area and plaque burden are commonly used to quantify plaque. Plaque plus media area is calculated by lumen area subtracted from EEM area. Plaque burden is calculated as plaque plus media area divided by EEM area.39) Plaque volume, analyzed by reconstructing cross-sectional images obtained by pullback with constant speed, has been utilized as an indicator of the effectiveness of medical therapies such as statin or proprotein convertase subtilisin/kexin type 9 inhibitor.40)41)42) Degree of vessel remodeling is expressed as remodeling index, which is calculated as EEM area at the lesion site divided by EEM area at the reference site.39) Although the causal effect of plaque volume on the development of ACS has not been proven in a prospective manner, the PROSPECT study revealed that plaque burden >70% is one of the predictors of future adverse events including target-lesion revascularization.34) Unlike IVUS, signal penetration of OCT is limited in the presence of lipid component,22) which precludes the assessment of vascular remodeling. Previous OCT studies tried to evaluate the size of lipid by lipid volume index calculated by mean lipid angle multiplied by length of lipid,15) each of which were independently associated with plaque vulnerability. Recently, a 2-year follow-up study of lipid-rich plaque defined by OCT reported that lipid-rich plaque in non-culprit lesion was associated with more frequent cumulative adverse events after in 1,474 patients who underwent OCT imaging of the non-culprit plaques within the target vessel.43)
Figure 5
Positive remodeling. EEM area can be measured with IVUS. RI is calculated as the ratio of lesion EEM area divided by that of reference site. Threshold of RI for positive remodeling varies among different studies. In previous IVUS studies, RI >1.05 or 1.00 were predominantly used for the definition of positive remodeling. In this figure, RI is 1.37, which indicates significant positive remodeling.
EEM = external elastic membrane; IVUS = intravascular ultrasound; RI = remodeling index.
MACROPHAGE INFILTRATION
Along with the thickness of fibrous cap, inflammation by macrophage infiltration into fibrous cap is an important factor of plaque vulnerability.14)44)45) The size of a macrophage is approximately 15–80 µm, which is below the threshold of direct visualization for existing in vivo imaging modalities,46) However, OCT can potentially identify macrophage accumulation by exhibiting spotty high signals accompanied by heterogenic shadows (Figure 6). Tearney et al.47) validated the potential of OCT to quantify macrophage density in an ex vivo study comparing OCT images with histology. In this study, macrophage infiltration was identified by CD68 immunostaining and the density of CD68 positive cells was determined within the region of interest (ROI). On OCT images, the normalized standard deviation (NSD) of the signal intensity within ROI showed a good correlation with the density of CD68 positive cells. Based on this validation study, MacNeill et al.48) compared NSD between ACS patients and stable patients. They found that macrophage density measured by NSD was significantly higher in ACS patients than in stable patients. Moreover, they revealed higher NSD in ruptured plaque than in non-ruptured plaque. It was reported that macrophage density represented by signal NSD was associated with low endothelial shear stress computed by bidirectional angiogram and OCT, which potentially predicts plaque vulnerability and progression of plaque.49) However, we should bear in mind that these studies analyzed the NSD of raw data, which is different from the logarithmic data used for the construction of OCT images in commercially available systems. Recent studies warned that macrophage infiltration might cause misdiagnosis of TCFA and compromise the measurements of fibrous cap thickness due to light scattering exhibited by both macrophage infiltrations and TCFA.50)51) The identification of macrophage infiltration on OCT can also be confounded by heterogenous plaques containing calcification. It was reported that re-training the observer to differentiate macrophage infiltration from TCFA improved reproducibility of OCT interpretation.51)
Figure 6
Macrophage accumulation. Three consecutive frames of a plaque showing macrophage accumulation. Macrophage accumulation is identified by punctate or linear high-signal intensities accompanied by heterogenic shadow (white arrow, frame 304), which cast on the deeper layer of intima. Heterogenic shadow is characterized by frame-by-frame variability (frame 304–306) and sharp radial border between plaque density (triangle, frame 306) and a shadow density (circle, frame 306) within the plaque.
NEOVASCULARIZATION
Development of vasa vasorum within plaques, also called neovascularization or microchannels, has been recognized as a vulnerable feature of coronary plaques.12)14) Given the small size of the vasa vasorum, OCT is the only intravascular imaging modality able to visualize it in vivo (Figure 2C). Kume et al.52) evaluated the feasibility of OCT in identifying intraplaque neovasculature compared with histological assessment in an ex vivo validation study investigating 55 coronary plaques of 31 human cadavers. In this study, OCT-derived neovascularization was defined as no-signal tubuloluminal structures with 50–300 µm of diameter on 3 consecutive frames. Sensitivity and specificity of OCT-derived neovascularization in comparison with histology as the gold standard were found to be 52% and 68%, respectively. Previous pathology studies showed that angiogenesis occurs from both adventitial side and luminal side, and majority of those arises from outer side.53)54) Therefore, OCT may have limited value in detecting microvessels deep in the vessel wall. Nevertheless, OCT-derived neovascularization has been associated with a variety of lesion and patient characteristics. In a study investigating the association between baseline OCT findings of non-culprit plaque and subsequent angiographical progression, neovascularization was more frequently observed in plaques showing progression of luminal stenosis.37) Kitabata et al.55) investigated the association between microchannel within the plaque and other vulnerable features of plaques in 64 lesions by OCT. They demonstrated that plaques with microchannel, corresponding to neovascularization, showed greater prevalence of TCFA (54% vs. 21%, p=0.012) and positive remodeling (67% vs. 36%, p=0.02). This observation suggested a significant relationship between neovascularization and plaque vulnerability. Another study comparing OCT findings of non-culprit plaques between patients with ACS and those with stable angina pectoris, observed that neovascularization in ACS patients tended to be located more proximally as compared with that in stable patients.15) Moreover, Taruya et al.56) analyzed the volume of vasa vasorum and intraplaque neovessels by 3-dimensional reconstruction, and revealed that plaques with vulnerable characteristics such as fibroatheroma and ruptured plaque contained greater volume of intraplaque neovessels as compared with other plaque phenotypes. These results suggested differential vulnerability according to the location of neovascularization. Although the histological validity of OCT-derived neovascularization is controversial, recent studies have supported its significance in the process of plaque vulnerability. Given the significant role of neovascularization in the progression of atherosclerosis, development of technologies that provide more reliable identification of neovasculature would be useful.
EROSION
The term “vulnerable plaque” has been used for rupture-prone plaque in a narrow sense. Considering the original definition of the word “vulnerable”, the range of mechanisms leading to coronary thrombosis should span the domain of vulnerable features as well as rupture-prone characteristics. Although Virmani et al.8) reported different underlying pathologies related to sudden cardiac death (SCD) secondary to occlusive coronary thrombosis, the presence of plaque erosion and calcified nodules have been underestimated in vivo because of the lack of technology to identify these lesions. However, the advent of OCT enabled near-histology level imaging in vivo and shed light on the mechanisms of acute coronary thrombosis, especially on plaque erosion. In pathology studies, plaque erosion was defined as denudation of endothelial layer, accounting for 30–40% of underlying pathology of coronary thrombosis. Plaque erosion is characterized by eccentric plaque, which is rich in smooth muscle cells and proteoglycan, and has a small NC with thick fibrous cap, and less occlusive lesions.14) As an endothelial cell is <10 µm in thickness, it is not visualized by any imaging modality including OCT, which has 10–20 µm axial resolution. However, given the ability of OCT to detect plaque rupture in the culprit lesions of ACS,57) the absence of plaque rupture informs a reliable identification of plaque erosion in contrary arteries.
Our group proposed an OCT definition of plaque erosion and calcified nodules, and investigated a total of 126 culprit lesions of ACS.58) Definite erosion was defined by OCT as a plaque with intact fibrous cap showing thrombus that allows visualization of underlying plaque (Figures 7 and 8). Among 126 lesions assessed by the proposed OCT definition, 55 plaque rupture (43.7%), 39 erosion (31.0%), and 10 calcified nodule (7.9%) cases were identified. These figures are consistent with the prevalence of underlying plaque reported in the previous post-mortem studies.8)9)14) This result suggested the feasibility of OCT-classification for culprit lesions of ACS.
Figure 7
Plaque erosion on OCT. OCT images of a culprit lesion of NSTEMI show “definite” erosion. Definite erosion is defined by OCT as having intact fibrous cap underneath thrombi (arrowheads) that do not preclude plaque characterization behind the thrombus.
NSTEMI = non-ST-elevation myocardial infarction; OCT = optical coherence tomography.
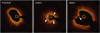
Figure 8
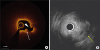
Plaque rupture imaged by OCT and IVUS. Plaque rupture in a culprit lesion of STEMI is imaged by OCT (A) and IVUS (B). OCT clearly visualizes disruption of fibrous cap (arrow head) and a thrombus attached to the lumen (white arrow), however circumferential lipid precludes visualization of entire vessel wall. In contrast, IVUS delineate medial layer (yellow arrow) beyond the plaque, whereas microstructure beside the lumen such as a thrombus and plaque rupture are not detectable.
IVUS = intravascular ultrasound; OCT = optical coherence tomography; STEMI = ST-segment elevation myocardial infarction.
Plaque erosion has drawn attention in catheterization laboratories in recent years. Prevalence of erosion has been studied in the setting of STEMI.59) Of 112 culprit lesions of STEMI, plaque rupture was found in 72 lesions (64.3%) and plaque erosion was found in 30 lesions (26.8%). IVUS analysis of these lesions revealed that plaque erosion was frequently associated with eccentric plaque (73.3%) and less frequently with positive vascular remodeling (30.0%). Underlying plaque characteristics were associated with certain types (platelet-rich vs. erythrocyte-rich) and quantity of residual thrombus after thrombolysis.60) Culprit lesions of 29 STEMI patients were assessed by OCT between 24 and 48 hours after successful thrombolysis. Lesions with OCT-defined plaque erosion showed less thrombus burden and more frequent platelet-rich thrombus compared with lesions of plaque rupture, suggesting differential thrombogenic properties between plaque rupture and erosion. Considering the different pathogeneses of culprit lesions with plaque rupture, ACS caused by plaque erosion may require a different therapeutic approach. The EROSION study tested the feasibility of anti-thrombotic therapy without stent implantation for the ACS patients with plaque erosion and angiographic diameter stenosis <70%. The study demonstrated excellent short-term outcomes.61) Among 405 ACS patients undergoing OCT, 103 (25.4%) patients showed plaque erosion in the culprit lesions. Among these, 65 patients who met inclusion criteria were treated with anti-thrombotic therapy without stenting. These patients showed significant reduction of intraluminal thrombus by OCT and experienced no cardiovascular death for one month. Despite the significance of these findings, characteristics of the lesions showing plaque erosion have not yet been fully defined and requires further investigation.
CALCIFIED NODULE
Unlike plaque erosion, nature of calcified nodule has been barely studied in vivo and is still unknown because of the limited frequency which is reported to be 3–5% of culprit lesions of coronary thrombosis.8)14) Calcified nodule is characterized in pathological examinations by a lesion with fibrous cap disruption and thrombi associated with eruptive, dense, calcific nodules. According to the pathological definition, previous studies have attempted to identify calcified nodules by IVUS62)63) and OCT,58) in which calcified nodule is defined as protruding, superficial calcification accompanied by substantive calcium proximal and/or distal to the lesion. Recently, Lee et al.64) investigated by OCT a total of 889 lesions in which 37 (4.2%) calcified nodules were identified. In this study, calcified nodule was most frequently observed in mid right coronary artery followed by proximal to mid left anterior descending coronary artery, and the presence of calcified nodule was associated with the angle of bending motion of coronary artery during cardiac cycle. Despite of low prevalence of calcified nodules, its contribution to the onset of ACS is not negligible and further studies are warranted.
FUTURE TASKS OF INTRAVASCULAR IMAGING FOR VULNERABLE PLAQUE
Intravascular imaging modalities are able to visualize features of vulnerable plaque shown in pathology studies. However, each modality has its unique limitations. To be able to overcome these limitations, a combination of modalities, such as IVUS and OCT may be complementary in promising better delineation of vulnerable plaque.65)66)67) Nevertheless, there is a lack of prospective observation to show that vulnerable plaques imaged by intravascular imaging modalities will indeed lead to acute coronary thrombosis in the future. Natural history studies are needed. It should be noted that the goal of intravascular imaging is to provide accurate information for prediction and prevention of future coronary thrombosis leading to ACS or SCD.
CONCLUSION
The use of intravascular imaging modalities has contributed to a better understanding of plaque vulnerability. Nonetheless, accurate prediction of coronary thrombosis yet to be accomplished, partly due to the limitations of existing imaging technologies and limited prospective data. Further development and investigation of intravascular imaging modalities are needed to better predict acute coronary events in the future.
 XML Download