

 PDF
PDF ePub
ePub Citation
 Print
Print


Introduction
Subclinical hypothyroidism (SH) is defined as an elevated thyroid stimulating hormone (TSH) level with normal free thyroxine (fT4) and free triiodothyronine (fT3) concentrations,1) and SH occurs in 4% to 20% of the adult population.2) Hypothyroidism is considered to be a risk factor for cardiovascular diseases (CVD)3)4) and increasing evidence also suggests that an association exists between atherosclerotic CVD and SH.5) The metabolic syndrome (MS), which has been linked to CVD and mortality in the general population6) is one of the underlying potential mechanisms for this association. MS is characterized by atherogenic dyslipidemia, insulin resistance, and hypertension,7) all of which may be increased in hypothyroid or subclinical hypothyroid states. It is also well known that visceral adipose tissue (VAT) plays a major role in the development of MS.8)
It was shown that epicardial adipose tissue (EAT), which is located between the heart and the pericardium, is related to features of the MS and reflects VAT.9) As an emerging cardiometabolic risk factor, increased EAT thickness was shown to be strongly associated with coronary artery disease.10) Although some studies demonstrated the association between SH and MS,11)12) the association between EAT, which is a marker of visceral adiposity, and SH has not been ev-aluated extensively. The aim of this study was to investigate whether SH is independently associated with higher EAT thickness.
Subjects and Methods
Patients
Fifty-one patients with SH and 51 healthy age-matched euthyroid subjects were enrolled in this study between June 2013 and February 2014 after obtaining their written informed consent. Local ethics committee approved the investigational protocol described herein. The diagnosis of SH was based on normal serum fT4 (0.8-1.8 ng/dL) and mildly increased serum TSH levels (4.8-10 mIU/L).1) Euthyroid subjects were defined as those having normal serum fT4 and TSH levels. A detailed questionnaire was used to assess the past history of any disease, alcohol consumption, smoking, and occupational history.
Patients were excluded if they had overt hypothyroidism, severe obesity, history of smoking or alcohol abuse, familial or secondary dyslipidemia, diabetes mellitus, renal, hepatic or other systemic diseases. None of the patients had a previous history of radioiodine treatment, thyroid surgery, external radiation, and/or drug therapy which could cause SH. Patients receiving drugs such as levothyroxine, oral contraceptives, steroids, antihypertensive, antidiabetic or antilipidemic medications were also excluded from the study.
Study variables
The variables of this study were as follows: age, sex, systolic and diastolic blood pressure, body mass index (BMI), fasting plasma glucose, total cholesterol, triglycerides, high density lipoprotein-cholesterol (HDL-C) and low density lipoprotein-cholesterol (LDL-C), thyroid function tests (TSH, fT3, and fT4), waist and neck circumferences, MS, and echocardiographic measurement of EAT. The presence of SH was the primary predictor variable.
Clinical and laboratory examinations
Two blood pressure measurements were performed at an interval of at least 10 minutes by using a mercury sphygmomanometer while the participants were in a sitting position after 10 minutes of rest. BMI was calculated as weight (in kilograms)/height (in meters) squared.
Waist circumference was measured at the midpoint between the lowest rib and the iliac crest, and neck circumference was measured at mid-neck height between mid-cervical spine and mid-anterior neck13) with plastic tapes calibrated weekly to within 1 mm.
Blood samples were collected from all subjects between 08:00 and 10:00 after at least 10 hours of fasting. A procedure involving chemiluminescence was used to determine thyroid function (TSH, fT3, and fT4). Plasma glucose, total cholesterol, HDL-C and LDL-C, triglyceride levels were measured using standard methods.
Echocardiographic assessment of epicardial adipose tissue
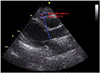
We performed echocardiographic assessment of EAT, using the method proposed by Iacobellis et al.9) Patients were placed in the left lateral decubitus position. EAT thickness was assessed on the free wall of the right ventricle in two-dimensional long and short heart axis views, at the end of the systole (Vivid 3; GE Vingmed, Horten, Norvay). We performed 5 measurements of EAT thickness during 5 cycles of two-dimensional long and short heart axis views, and an average of values was obtained for each patient. EAT appears as an echo-free space anterior to the right ventricular wall and its thickness is measured between the epicardial surface of the right ventricle and the parietal pericardium (Fig. 1).
Diagnosis of metabolic syndrome
For the diagnosis of MS, we used the following criteria, which are slightly modified from the National Cholesterol Education Program-Adult Treatment Panel III guideline7) in terms of central obesity evaluation, which is adopted by the Turkish Society of Endocrinology and Metabolism. Based on this, MS was diagnosed when three or more of the following criteria were met: 1) abdominal obesity: waist circumference >94 cm in men and >80 cm in women; 2) plasma triglycerides: ≥150 mg/dL; 3) plasma HDL-C: <40 mg/dL in men and <50 mg/dL in women; 4) systolic blood pressure ≥130 mm Hg or diastolic blood pressure ≥85 mm Hg or use of an anti-hypertensive me-dication; and 5) Hyperglycemia (fasting blood glucose ≥110 mg/dL).
Statistical analysis
Quantitative variables were presented as mean (±SD), and qualitative variables were presented as percentages (%). The Kolmogorov-Smirnov test was used for assessing normality in distribution of data. A comparison of parametric values between the two groups was made using a two-tailed Student t-test, and for nonparametric values, Mann-Whitney U test was used. Categorical variables were compared using the chi-square test or Fisher's exact test. A p of ≤0.05 was considered statistically significant. Pearson's test was used for correlation analysis. Multivariate logistic regression analysis was performed to evaluate independent association of SH with variable clinical parameters. All statistical analyses were carried out using Statistical Package for the Social Sciences (SPSS) version 18.0 (SPSS Inc., Chicago, IL, USA).
Results
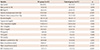
Comparison of clinical characteristics, laboratory results, and echocardiographic evaluation between the SH and control groups is presented in Table 1. No significant difference was observed in age, gender, BMI, glucose, fT3 and fT4 levels between the two groups (p>0.05). Mean EAT thickness was significantly higher in the SH group compared with the control group (6.7±1.4 mm vs. 4.7±1.2 mm, p<0.001). In the subgroup analysis, higher EAT thickness was also observed in patients without MS in the SH group compared to patients without MS in the control group (6.1±1.1 mm vs. 4.6±1.2 mm, p<0.001). In addition, EAT thickness was shown to be correlated with TSH (r=0.303, p=0.002) and inversely correlated with fT4 (r=-0.241, p=0.015).
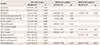
Logistic regression analysis was performed in patients with SH (Table 2). Variables such as systolic and diastolic blood pressure, triglyceride, LDL-C and HDL-C, BMI, MS, EAT thickness were included into the multivariate logistic regression model because their unadjusted p were ≤0.05. Waist and neck circumferences, which reflect VAT, are associated with EAT thickness; hence, they were not included in the multivariate analysis.
Because some variables have a significant correlation with MS itself, resulting in a significantly high collinearity, two different multivariate models were used, one including MS alone without any of its components, and the other excluding the MS variable, but including each component. EAT thickness was found to be independently associated with SH in both models {odds ratio (OR): 3.87, 95% confidence interval (CI): 1.92-7.78, p<0.001; OR: 3.80, 95% CI: 2.18-6.62, p<0.001, respectively}.
Discussion
In the present study, patients with SH had increased EAT thickness compared with control subjects. Multivariate analysis revealed that SH was independently associated with higher EAT thickness.
The increasing morbidity and mortality from CVD in the last decade identified a clustering of CVD risk factors, including obesity, type 2 diabetes mellitus, hyperlipidemia, and hypertension.14)15) These risk factors are associated with insulin resistance, and this led to the identification of the unique disease entity, which is called MS. MS is a combination of risk factors for CVD.7) Although multiple risk factors, such as obesity, insulin resistance, physical inactivity, advanced age, and hormonal imbalance, appear to predispose people to the MS,7) VAT plays a major role in the development of MS.8) It is well accepted that hypothyroidism is associated with CVD,4) and increasing evidence also suggests an association between SH and CVD.5)16)17) One such potential mechanism for this association is MS. Components of the MS may increase in overt or subclinical hypothyroid states. Overt hypothyroidism leads to an increase in plasma cholesterol levels and blood pressure.18)19) The clearance of LDL-C was found to be delayed in patients with overt hypothyroidism due to down-regulation of LDL-C receptors on hepatocytes. Therefore, it is characterized by high levels of serum cholesterol and LDL-C and a low level of HDL-C.20) In a study investigating the hypothesis that thyroid function is associated with components of the MS, a reciprocal relationship was observed between fT4 and triglyceride and LDL-C even within the euthyroid range.21) Obesity is also an important component of MS, and a positive association between TSH and BMI or waist circumference has also been described.22) There are conflicting findings on the association between blood pressure and thyroid function. It was demonstrated that TSH levels were positively correlated with systolic blood pressure, but no correlation was found between TSH and diastolic blood pressure.23)
There is also a significant increase in CVD risk factors among people with SH,24) and it was demonstrated that the prevalence of SH was increased in patients with MS.12) It was also shown that an association exists between higher TSH levels and increased prevalence of the MS even within the euthyroid range.11) Our results also showed an association between SH and the presence of MS. Additionally, levels of triglyceride, HDL-C and LDL-C, degree of systolic and diastolic blood pressure, waist and neck circumference were also found to be associated with SH.
Waist circumference is widely used as an indicator and screening tool of VAT. However, this measurement does not distinguish between accumulation of VAT and subcutaneous abdominal fat. EAT, which is the adipose tissue accumulated between the visceral pericardium and the myocardium measured by echocardiography, was proposed as a novel imaging indicator of VAT.25) It is well correlated with VAT assessed by magnetic resonance imaging, which is the gold standard for measurement of VAT.25) It has been suggested that increased EAT thickness is positively associated with the risk of MS25)26) and it is a better indicator of visceral adiposity than waist circumference.26) EAT is not only a fat deposit but also an active metabolic organ. It has been found to produce several bioactive molecules associated with insulin resistance and systemic inflammation27) and it was proposed that increased EAT thickness is associated with CVD.25) However, the association between EAT, which is a marker of visceral adiposity, and SH has not been evaluated extensively.
Although some recent studies suggested an association between SH and EAT,28)29) there are some conflicting results.30) Our study revealed an independent relationship between EAT thickness and SH in the multivariate analysis. Increased LDL-C and systolic blood pressure levels were also found to be independently associated with SH, and all of these findings support the association between CVD and SH.
The main limitation of this study is the small sample size. Our preliminary findings should be supported by further studies. Therefore, the ability to generalize this correlation might be limited. Secondly, currently, magnetic resonance imaging is the gold standard diagnostic method for measuring epicardial fat thickness; however, echocardiography is more practical and sufficiently reliable compared to magnetic resonance imaging. Finally, the duration of SH in the study population is unknown due to the generally asymptomatic nature of the disease and the presence of anti-thyroperoxidase antibodies was not assessed, which is associated with an increased risk of developing overt hypothyroidism. Therefore, these implications may complicate the assessment of the impact of SH on EAT thickness.
In conclusion, our study demonstrated that increased EAT thickness was observed in patients with SH compared with control subjects. Hence, this finding suggests that there is a relationship between SH and visceral adiposity, and it supports the previous findings of SH being a potential cardiovascular risk factor.
 XML Download