

 PDF
PDF ePub
ePub Citation
 Print
Print


Introduction
Hypertension (HT) is one of the most common cardiovascular risk factors. Left ventricular hypertrophy (LVH) is frequently encountered in hypertensive patients due to chronic pressure overload. LVH is an important predictor of mortality and morbidity independent of other major cardiac risk factors, both in the general population and in patients with HT.1) Moreover, LVH is generally accepted as a marker of subclinical cardiovascular disease.2) Regression of LVH is associated with lower cardiovascular mortality, independent of blood pressure (BP) reduction.3)
Left ventricular hypertrophy is related to various clinical and anthropologic parameters. Data from the Framingham Heart Study revealed that subjects with LVH tend to be older, more obese and have higher BP, lower systolic function, and preexistent coronary artery disease (CAD), all of which implicate a high-risk population.4) Moreover, age, height, systolic BP, and body mass index (BMI) were the independent predictors of left ventricular mass (LVM) in the Framingham population.5)
There has been considerable interest regarding the association of biochemical parameters such as bilirubin and uric acid, with changed cardiovascular risk in hypertensive patients. Normally, serum uric acid (SUA) is an important antioxidant and a free radical scavenger.6) However, under ischemic conditions, xanthine dehydrogenase, rather than xanthine oxidase, generates SUA, which facilitates pro-oxidant and pro-inflammatory effects due to the generation of free radicals. Therefore, SUA seems to have a paradoxical effect depending on local ischemia, which may justify its relation to increased cardiovascular risk in certain populations.7) Accordingly, elevated SUA markedly increases coronary heart disease and is a predictor of either all-cause or cardiovascular mortality.8) Bilirubin, the final product of heme metabolism, has gained attention, owing to its powerful antioxidant activity, especially in physiologic oxygen concentrations.9) Several studies have demonstrated that bilirubin is negatively associated with the severity and extent of CAD, and acts as a predictor of cardiovascular morbidity and mortality.10) Concordantly, higher bilirubin values confer cardioprotection.11) Waist circumference, an important measure of abdominal obesity, is closely related to metabolic syndrome and cardiovascular disease and is an independent predictor of cardiovascular events.12)
The prevalence of LVH differs with respect to BP, age, obesity, and gender. Increased LVM ranges from a prevalence of 20% in uncomplicated HT to almost 100% in severe or complicated HT.13) Since LVH is an important marker of cardiovascular disease, we intended to investigate the association of LVM with carotid intima-media thickness (CIMT) and brachial flow-mediated dilation (FMD) as surrogates of atherosclerosis and endothelial dysfunction, respectively. Moreover, we planned to evaluate the determinants of LVH among several anthropometric and biochemical parameters in previously untreated hypertensive patients.
Subjects and Methods
Patient population and inclusion criteria
Our cross-sectional study included 114 consecutive previously untreated hypertensive patients who underwent echocardiography and ultrasonography to evaluate their vascular status and function by measuring CIMT and FMD of brachial artery.
The study was performed in accordance with the principles stated in the Declaration of Helsinki and approved by the local Ethics Committee. Patients gave informed consent prior to enrollment.
Patients with previous coronary artery, peripheral vascular, and cerebrovascular disease, left ventricular systolic dysfunction, renal failure, hepatic or cholestatic disease, hematological disorders, secondary HT, infectious disease, hyperuricemia, malignancy, and patients previously treated for HT were excluded.
Blood pressure values were obtained by the traditional auscultatory method. Resting BP values were obtained at a physician's office and echocardiography room by the traditional auscultatory method using a sphygmomanometer. Patients were advised to refrain from smoking or consumption of coffee or tea and physical exercise, 30 minutes prior to the measurement. Following a five-minute rest, two separate measurements were averaged to determine office BP.
Baseline characteristics of the patients were recorded. HT was defined as the documentation of BP more than 140/90 mm Hg. Diabetes mellitus was defined as fasting plasma glucose levels over 126 mg/dL or a glucose level over 200 mg/dL under any measurement, or active use of antidiabetic treatment. Patients who were using tobacco products on admission to our hospital and those quit smoking within the last year were considered to be smokers. BMI was calculated by the following formula: BMI=weight (kg)/height2 (m). Metabolic syndrome score was calculated according to current criteria.14) Since all patients were hypertensive, they all had at least 1 point for the metabolic syndrome score. Additional points were added per patient if they fulfilled the following criteria: waist circumference >102 cm in males and >88 cm in females, high density lipoprotein-cholesterol (HDL-C) <40 mg/dL in males or <50 mg/dL in females, triglycerides ≥150/mg/dL, and fasting glucose ≥100 mg/dL, or use of antidiabetic therapy. Additionally, we used the Turkish Adult Risk Factor Study (TEKHARF) metabolic syndrome criteria, which differs in waist circumference as >95 cm in men, and >91 cm in women.15)
Biochemical analyses
Blood samples were drawn by venipuncture to measure routine blood chemistry parameters after fasting for at least 8 hours. Fasting blood glucose, serum creatinine, uric acid levels, total cholesterol, HDL-C, low density lipoprotein-cholesterol, and triglyceride levels were recorded. Glucose, creatinine, uric acid, and lipid profile were determined by an autoanalyzer (Architect c16000, Abbott Laboratories, IL, USA) using the spectrophotometric method. Serum C-reactive protein was analyzed using a nephelometric technique (Beckman Coulter Immage 800; Fullerton, CA, USA; normal range 0-0.8 mg/L).
Echocardiography and measurement of left ventricular mass
Patients were imaged in the left lateral decubitus position with a GE-Vingmed Vivid S5 (GE-Vingmed Ultrasound AS, Horten, Norway) using a 2.5-3.5 MHz transducer by an experienced cardiologist, blind to clinical status and data of the patients. The echocardiographic study required recording of ≥10 cycles of 2-dimensional parasternal long axis views and ≥10 cycles of M-mode with optimal cursor beam orientation in each view. Interventricular septum (IVS), posterior wall (PW), left ventricular end-diastolic diameter (LVEDD), and left ventricular end-systolic diameter were measured and noted. LVM was calculated according to formula: LVM=1.04 {(LVEDD+PW+IVS)3-(LVEDD)3}-13.6 g. In addition, LVM index values were computed by dividing by the body surface are (BSA) for standardization. BSA was calculated according to formula: BSA (m2)=0.007184×height (cm)0.725×weight (kg)0.425. LVH was defined as a LVM index >115 g/m2 in men and >95 g/m2 in women.
Measurement of carotid intima-media thickness
Ultrasonography was performed on all patients using a high-resolution ultrasonography scanner (Xario, Toshiba Medical Systems, Tokyo, Japan) with a PLT-805AT linear array transducer. Measurements were performed on the right and left carotid arteries. The patient was lying supine with the head directed away from the side of interest and the neck slightly extended. The transducer was manipulated so that the near and far walls of the common carotid artery were parallel, and the lumen diameter was maximized in the longitudinal plane. The region 1 cm proximal to the carotid bifurcation was identified, and the CIMT of the far wall was evaluated as the distance between the lumen-intima interface and the media-adventitia interface. The CIMT was measured on the frozen frame of a suitable longitudinal image, with the image magnified to achieve a higher resolution of detail. The CIMT measurement was obtained from four contiguous sites at 1-mm intervals on each carotid artery, and the average of all eight measurements was used for analysis. The same radiologist, blinded to patient data, performed all the measurements. The intra-observer mean absolute difference in measuring the common CIMT was 0.026±0.043 mm (coefficient of variation: 1.6%, intra-class correlation: 0.95). We defined CIMT thickness >1.2 mm as indicative of plaque.16)
Assessment of brachial flow-mediated dilation
A standard protocol was used to assess endothelial function, as previously reported.17) Briefly, for the FMD of brachial artery, patients fasted 8 hours before the study. The FMD was evaluated at the same time of the day, at 9.00 a.m, using a high-resolution ultrasonography scanner (Xario, Toshiba Medical Systems) with a PLT-805AT linear array transducer. The study took place in a quiet, temperature-controlled room. Caffeine intake and cigarette smoking were prohibited for at least 4-6 hours before the study. The right arm was immobilized using two cushions supporting the elbow and the wrist. A sphygmomanometric cuff was placed on the forearm. After 10-15 minutes of rest, the brachial artery was visualized longitudinally with the ultrasonic scanner operating in B mode. After an optimal image of the artery was obtained, the ultrasonic transducer was fixed in this position with a custom-built probe holder. The brachial artery diameter was determined manually in the end-diastole phase, as indicated by the R wave of the electrocardiogram.
After three baseline measurements were obtained, ischemia was induced by the inflation of the cuff to 30 mm Hg greater than the systolic arterial pressure to occlude arterial flow for 5 minutes. After the deflation of the cuff, diameter measurements were performed at 60 seconds. We used FMD at 1 minute after ischemia to represent the spontaneous endothelial function. The maximal diameter obtained during ischemia-induced hyperemia was used to calculate the percentage of FMD, using the following formula: (maximum diameter-baseline diameter)/baseline diameter×100. The same radiologist performed the endothelial function study. The intra-observer reproducibility of resting arterial diameter was 0.01±0.01 mm.
Statistical analysis
Continuous variables are given as mean±SD, if normally distributed; otherwise, as median (min.-max.); categorical variables were defined as percentages. Data were tested for normal distribution using the Kolmogorov-Smirnov test. The Student's t-test was used for the univariate analysis of changes in LVM with respect to categorical variables. Pearson and Spearman correlation coefficients were used for correlation analysis of parametric and nonparametric variables, respectively. Linear regression was used for the multivariate analysis of independent variables. Age, waist circumference, systolic and diastolic BP, pulse pressure, glucose, creatinine, uric acid, total bilirubin, direct and indirect bilirubin, HDL-C, hemoglobin levels, gamma-glutamyl transferase activity, aspartate aminotransferase, CIMT, and FMD were included in the linear regression analysis while the Stepwise method was used for pre-elimination. Thereafter, linear regression analysis with the enter method was used for age, male gender, waist circumference, uric acid, hemoglobin, systolic BP, total bilirubin, and CIMT.
All tests of significance were two-tailed. Statistical significance was defined as p<0.05. The Statistical Program for the Social Sciences (SPSS IBM Statistics, Version 21, NY, USA) was used for all statistical calculations.
Results
Patient characteristics
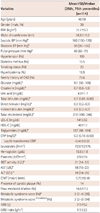
Demographic characteristics of the patients are detailed in Table 1. The study population consisted of 114 middle-aged (mean age, 48±9) men (39%) and women with untreated HT. The patients, on average, were slightly obese (31.7±5.3 kg/m2) with an enlarged waist circumference (96.5±10.2 cm). A low proportion of patients were diabetic (10.5%) and/or hyperlipidemic (18.5%). Approximately one fifth of the group were current smokers. The median systolic and diastolic BP value was 160 (140-200) over 90 (80-140) mm Hg.
Except for the mildly increased serum glucose and cholesterol concentrations, the biochemical parameters of our study population were within normal limits. The mean CIMT was 0.73±0.18 mm and 14% of the study group had carotid plaques. The brachial FMD was 14.8±7.2 within the group. The patient group had a median metabolic syndrome score of 3 (1-5); therefore, the majority of our patients also had metabolic syndrome (55%).
Left ventricular mass and study parameters
Left ventricular mass values did not differ within subgroups formed by the presence versus absence of the categorical variables, including diabetes mellitus (224±63 g vs. 216±51 g, p=0.627), smoking status (237±86 g vs. 213±40 g, p=0.064), hyperlipidemia (198±49 g vs. 222±53 g, p=0.060), and family history of CAD (213±48 g vs. 234±65 g, p=0.171).
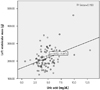
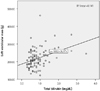
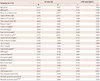
Among all study parameters, age (r=0.281, p=0.004), systolic BP (r=0.374, p<0.001), diastolic BP (r=0.296, p=0.002), pulse pressure (r=0.290, p=0.003), plasma glucose (r=0.213, p=0.032), uric acid (r=0.283, p=0.004), total bilirubin (r=0.244, p=0.014), direct bilirubin (r=0.294, p=0.003), hemoglobin (r=0.295, p=0.003) and CIMT (r=0.357, p<0.001) were positively correlated with LVM index (Table 2, Figs. 1 and 2). Although insignificant, a trend showing a weak correlation between LVM index and FMD (r=-0.176, p=0.078) was observed.
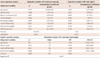
Multivariate analyses
Linear and logistic regression analyses with the enter method were used for independent variables, which were included if they were significantly different in the univariate analyses, after a pre-elimination with the stepwise method. Multiple linear regression analysis revealed that office systolic BP (Beta: 0.296, p<0.001), SUA (Beta: 0.203, p=0.028), total bilirubin (Beta: 0.208, p=0.011), CIMT (Beta: 0.194, p=0.017), and waist circumference (Beta: 0.186, p=0.027) were independent predictors of LVM (Table 3). Of these parameters, only systolic BP remained a significant predictor of the LVM index following standardization. However, there was a non-significant trend for uric acid. Multiple logistic regression analysis revealed office systolic BP {odds ratio (OR): 1.076, p=0.001}, age (OR: 1.075, p=0.010), male gender (OR: 3.527, p=0.017), and total bilirubin (OR: 3.647, p=0.044) were independent predictors of LVH.
Discussion
We documented that, in addition to systolic BP, age, male gender, and total bilirubin levels are important predictors of LVH hypertensive patients who have never been treated.
Left ventricular hypertrophy, a sign of target organ damage, increases cardiovascular mortality and morbidity approximately two-fold in HT.1) Even though LVH is considered to be a consequence of hemodynamic overload, several other factors, including renin angiotensin aldosterone system, salt intake, obesity, diabetes, and sympathetic neural activity are also blamed in the pathogenesis of this maladaptive state.18) Accordingly, BP reduction per se does not cause a regression of LVH, implicating the importance of other etiologic factors.19)
Serum uric acid is a debated marker of cardiovascular risk. An elevated level of uric acid is frequently encountered in hypertensive patients.20) Moreover, uric acid is closely related to metabolic syndrome.21) Studies investigating the effect of SUA on LVH revealed conflicting results. Iwashima et al.22) demonstrated a significant association between SUA and LVM in 619 patients with essential HT. Moreover, during follow-up period of 34 months, SUA proved to be an independent predictor of cardiovascular events.22) Conversely, two studies with large populations failed to demonstrate a significant relationship between SUA and LVH in patients with essential HT and untreated HT.23)24) SUA is usually associated with multiple risk factors, including HT, obesity, dyslipidemia, and insulin resistance, all of which are also related to LVH.25) Thus, even if SUA may not be related to LVH in the general population, this association may become evident in selected populations, like in our study, that mainly includes patients with metabolic syndrome.
The documented independent positive association between bilirubin and LVM in our study is novel and unprecedented. Bilirubin, a bile pigment with potent antioxidant properties, is the end product of heme catabolism by heme oxygenase.9) Heme oxygenase-1 is a stress-induced enzyme that catalyzes the degradation of heme into iron, carbon monoxide, and biliverdin.26) Biliverdin is rapidly converted to bilirubin by biliverdin reductase. Hu et al.27) have revealed that inducing heme-oxygenase-1 inhibits angiotensin II induced LVH in cultured rat neonatal cardiomyocytes. This effect was mediated by bilirubin through the suppression of reactive oxygen species.27) The same protective effect of bilirubin on LVH was observed in spontaneously hypertensive rats.28) Liver growth factor, detected in hepatobiliary disorders, is an endogenous factor that is comprised of covalently bound albumin and bilirubin. Liver growth factor is not detected under physiological conditions.29) A recent study demonstrated that liver growth factor treatment reduced LVM in hypertensive rats.30) Although there is some evidence that bilirubin, mediated by antioxidant properties, may protect against hypertrophy in vitro, to date there is no information regarding the impact of bilirubin on LVH in humans at physiologic concentrations. We speculate that either the physiologic effect of bilirubin on LVH may be different than under in vitro conditions or that the bilirubin levels may reflect another process that has not yet been elucidated. This relationship and its clinical significance require further research.
Limitations
Our study has several limitations. The main limitation is our small sample size. Another limitation is that our study included previously untreated patients that were in earlier hypertensive stages. These patients may have less vascular involvement than those with long-standing HT, which would reduce the statistical power of our findings. Moreover, our study is cross-sectional in nature; therefore, our results cannot implicate causality. However, in order to decrease the variability in measuring atherosclerotic parameters, we utilized validated end-points, which are a stronger aspect of our study. Lastly, we did not include subjects without HT, so our results may not be generalized to the population as a whole.
 XML Download