Abstract
Objective
To test the applicability of the Arbeitsgemeinschaft Gynäkologische Onkologie (AGO) and Memorial Sloan Kettering (MSK) criteria in predicting complete cytoreduction (CC) in patients undergoing secondary cytoreductive surgery (SCS) for recurrent ovarian cancer (ROC).
Methods
Data of consecutive patients undergoing SCS were reviewed. The Arbeitsgemeinschaft Gynäkologische Onkologie OVARian cancer study group (AGO-OVAR) and MSK criteria were retrospectively applied. Nomograms, based on AGO criteria, MSK criteria and both AGO and MSK criteria were built in order to assess the probability to achieve CC at SCS.
Results
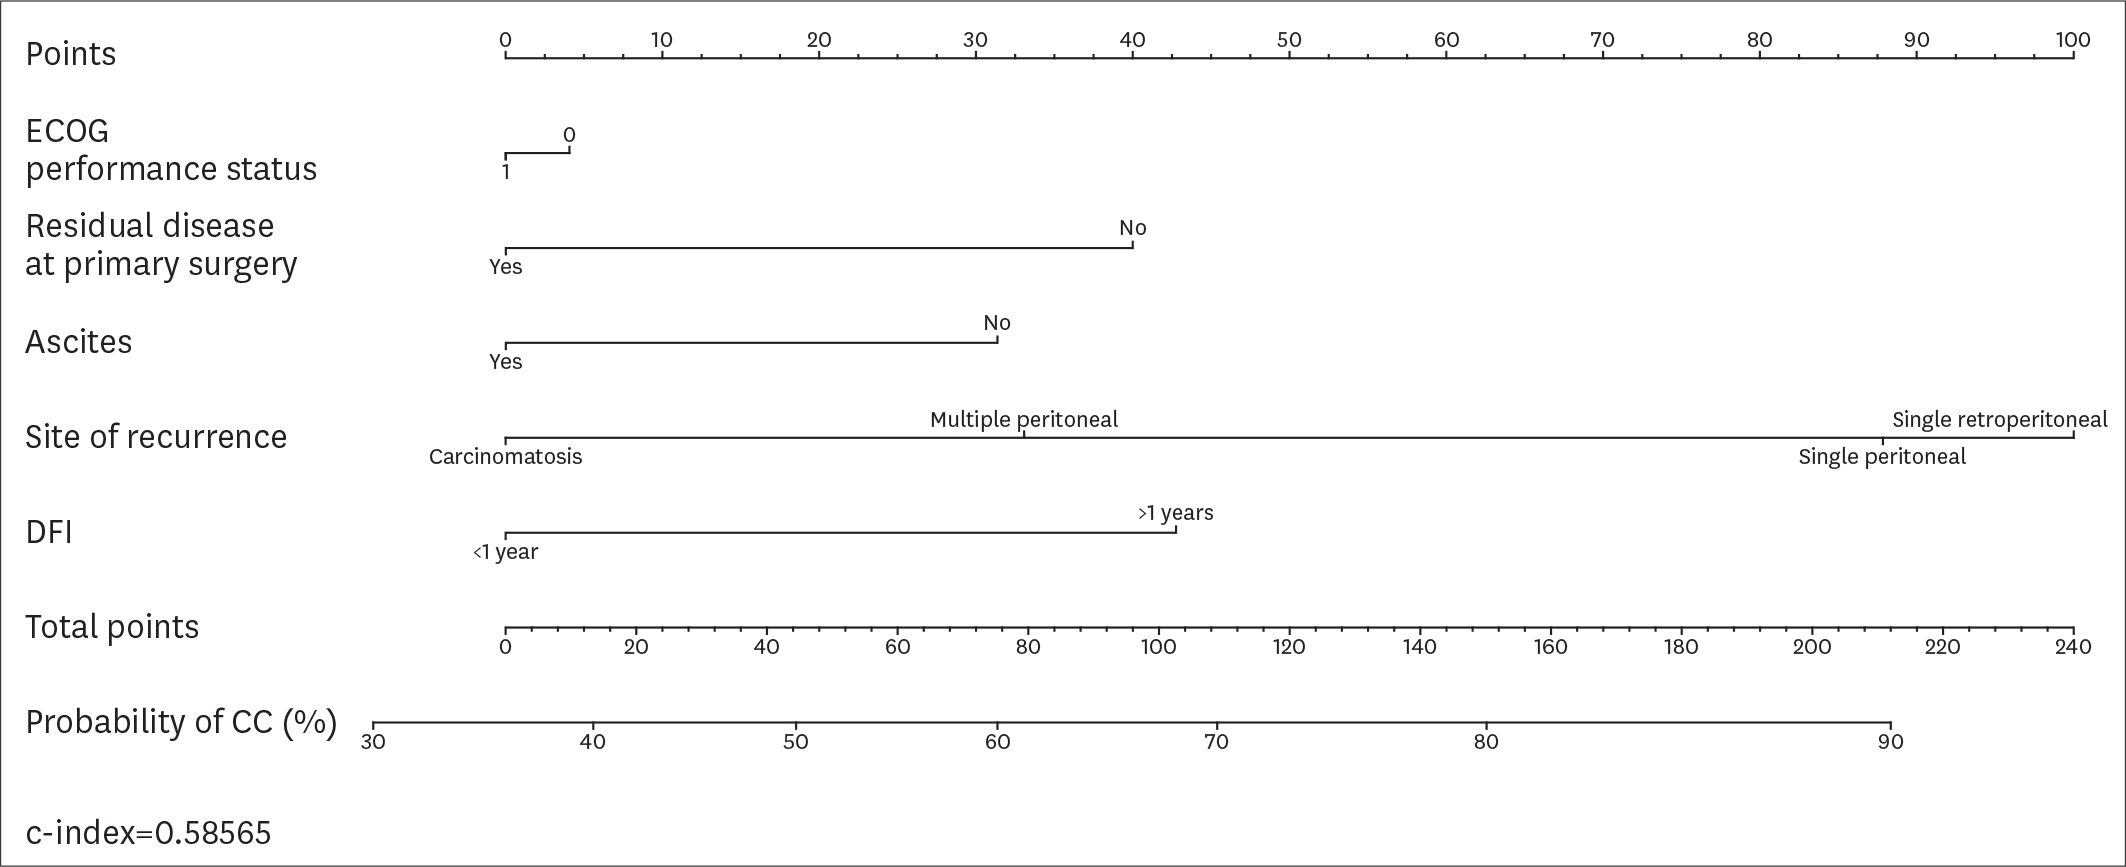
Overall, 194 patients met the inclusion criteria. CC was achieved in 161 (82.9%) patients. According to the AGO-OVAR criteria, we observed that CC was achieved in 87.0% of patients with positive AGO score. However, 45 out of 71 (63.4%) patients who did not fulfilled the AGO score had CC. Similarly, CC was achieved in 87.1%, 61.9% and 66.7% of patients for whom SCS was recommended, had to be considered and was not recommended, respectively. In order to evaluate the predictive value of the AGO-OVAR and MSK criteria we built 2 separate nomograms (c-index: 0.5900 and 0.5989, respectively) to test the probability to achieve CC at SCS. Additionally, we built a nomogram using both the aforementioned criteria (c-index: 0.5857).
Go to : 
References
2. Cowan RA, Eriksson AG, Jaber SM, Zhou Q, Iasonos A, Zivanovic O, et al. A comparative analysis of prediction models for complete gross resection in secondary cytoreductive surgery for ovarian cancer. Gynecol Oncol. 2017; 145:230–5.

3. van de Laar R, Massuger LF, Van Gorp T, IntHout J, Zusterzeel PL, Kruitwagen RF. External validation of two prediction models of complete secondary cytoreductive surgery in patients with recurrent epithelial ovarian cancer. Gynecol Oncol. 2015; 137:210–5.

4. Minaguchi T, Satoh T, Matsumoto K, Sakurai M, Ochi H, Onuki M, et al. Proposal for selection criteria of secondary cytoreductive surgery in recurrent epithelial ovarian, tubal, and peritoneal cancers. Int J Clin Oncol. 2016; 21:573–9.

5. Janco JM, Kumar A, Weaver AL, McGree ME, Cliby WA. Performance of AGO score for secondary cytoreduction in a high-volume U.S. center. Gynecol Oncol. 2016; 141:140–7.

6. da Costa AA, Valadares CV, Mantoan H, Saito A, Salvadori MM, Guimarães AP, et al. The value of secondary cytoreductive surgery in recurrent ovarian cancer and application of a prognostic score. Int J Gynecol Cancer. 2016; 26:449–55.
7. Eriksson AG, Graul A, Yu MC, Halko A, Chi DS, Zivanovic O, et al. Minimal access surgery compared to laparotomy for secondary surgical cytoreduction in patients with recurrent ovarian carcinoma: perioperative and oncologic outcomes. Gynecol Oncol. 2017; 146:263–7.

8. Berek JS, Hacker NF, Lagasse LD, Nieberg RK, Elashoff RM. Survival of patients following secondary cytoreductive surgery in ovarian cancer. Obstet Gynecol. 1983; 61:189–93.
9. Harter P, du Bois A, Hahmann M, Hasenburg A, Burges A, Loibl S, et al. Surgery in recurrent ovarian cancer: the Arbeitsgemeinschaft Gynaekologische Onkologie (AGO) DESKTOP OVAR trial. Ann Surg Oncol. 2006; 13:1702–10.

10. Pfisterer J, Harter P, Canzler U, Richter B, Jackisch C, Hahmann M, et al. The role of surgery in recurrent ovarian cancer. Int J Gynecol Cancer. 2005; 15(Suppl 3):195–8.

11. Angioli R, Capriglione S, Aloisi A, Ricciardi R, Scaletta G, Lopez S, et al. A Predictive score for secondary cytoreductive surgery in recurrent ovarian cancer (SeC-score): a single-centre, controlled study for preoperative patient selection. Ann Surg Oncol. 2015; 22:4217–23.

12. Harter P, Sehouli J, Reuss A, Hasenburg A, Scambia G, Cibula D, et al. Prospective validation study of a predictive score for operability of recurrent ovarian cancer: the Multicenter Intergroup Study DESKTOP II. A project of the AGO Kommission OVAR, AGO Study Group, NOGGO, AGO-Austria, and MITO. Int J Gynecol Cancer. 2011; 21:289–95.

13. Chi DS, McCaughty K, Diaz JP, Huh J, Schwabenbauer S, Hummer AJ, et al. Guidelines and selection criteria for secondary cytoreductive surgery in patients with recurrent, platinum-sensitive epithelial ovarian carcinoma. Cancer. 2006; 106:1933–9.

14. Tian WJ, Chi DS, Sehouli J, Tropé CG, Jiang R, Ayhan A, et al. A risk model for secondary cytoreductive surgery in recurrent ovarian cancer: an evidence-based proposal for patient selection. Ann Surg Oncol. 2012; 19:597–604.

15. Raspagliesi F, Bogani G, Ditto A, Martinelli F, Chiappa V, Borghi C, et al. Implementation of extensive cytoreduction resulted in improved survival outcomes for patients with newly diagnosed advanced-stage ovarian, tubal, and peritoneal cancers. Ann Surg Oncol. 2017; 24:3396–405.

16. AGO Study Group. Study comparing tumor debulking surgery versus chemotherapy alone in recurrent platinum-sensitive ovarian cancer (DESKTOP III). ClinicalTrials.gov Identifier: NCT01166737 [Internet]. Bethesda, MD: National Institutes of Health;2010. [updated 2017 Feb 14; cited 2017 Sep 11]. Available from:. www.clinicaltrials.gov.
17. Coleman RL. Making of a phase III study in recurrent ovarian cancer: the odyssey of GOG 213. Clin Ovarian Cancer. 2008; 1:78–80.

18. van de Laar R, Zusterzeel PL, Van Gorp T, Buist MR, van Driel WJ, Gaarenstroom KN, et al. Cytoreductive surgery followed by chemotherapy versus chemotherapy alone for recurrent platinum-sensitive epithelial ovarian cancer (SOCceR trial): a multicenter randomised controlled study. BMC Cancer. 2014; 14:22.

19. van de Laar R, Kruitwagen RF, IntHout J, Zusterzeel PL, Van Gorp T, Massuger LF. Surgery for recurrent epithelial ovarian cancer in the Netherlands: a population-based cohort study. Int J Gynecol Cancer. 2016; 26:268–75.
20. Tian WJ, Jiang R, Cheng X, Tang J, Xing Y, Zang RY. Surgery in recurrent epithelial ovarian cancer: benefits on Survival for patients with residual disease of 0.1–1 cm after secondary cytoreduction. J Surg Oncol. 2010; 101:244–50.
Go to : 
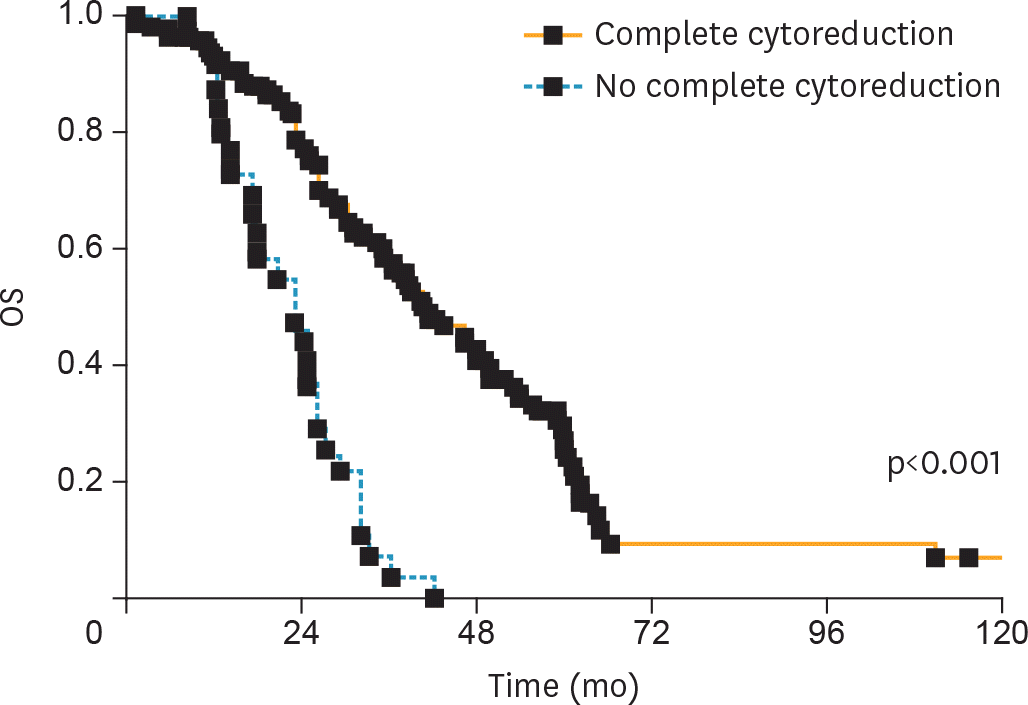
 | Fig. 1.OS according to CC at SCS. CC, complete cytoreduction; OS, overall survival; SCS, secondary cytoreductive surgery. |
 | Fig. 2.Nomogram displaying the probability of CC according to the variables included in the AGO-OVAR score.
AGO-OVAR, Arbeitsgemeinschaft Gynäkologische Onkologie OVARian cancer study group; CC, complete cytoreduction; ECOG, Eastern Cooperative Oncology Group; RD, residual disease.
|
 | Fig. 3.Nomogram displaying the probability of CC according to the variables included in the modified MSK criteria. CC, complete cytoreduction; DFI, disease-free interval; MSK, Memorial Sloan Kettering. |
 | Fig. 4.Nomogram displaying the probability of CC according to the variables included in the AGO-OVAR score and MSK modified criteria. AGO-OVAR, Arbeitsgemeinschaft Gynäkologische Onkologie OVARian cancer study group; CC, complete cytoreduction; DFI, disease-free interval; ECOG, Eastern Cooperative Oncology Group; MSK, Memorial Sloan Kettering; RD, residual disease. |
Table 1.
Main characteristics of the study population
| Characteristics | Value |
|---|---|
| Age (yr) | |
| Mean (SD) | 61.6 (±12.5) |
| Median (quartiles*) | 63.0 (53, 71) |
| BMI (kg/m2) | |
| Mean (SD) | 24.7 (±4.2) |
| Median (quartiles*) | 25.4 (20, 36) |
| ECOG performance status | |
| 0 | 151 (77.8) |
| 1 | 43 (22.2) |
| CA125 at first diagnosis (UI/L) | |
| Mean (SD) | 328.5 (±682.2) |
| Median (quartiles*) | 103 (42, 234.3) |
| Type of ovarian cancer | |
| High-grade serous | 140 (72.5) |
| Low-grade serous | 4 (2.0) |
| Endometrioid | 19 (9.8) |
| Clear cells | 9 (4.6) |
| Undifferentiated | 20 (10.3) |
| Mucinous | 2 (1.0) |
| FIGO stage | |
| I | 5 (2.6) |
| II | 9 (4.6) |
| III | 139 (72.7) |
| IV | 21 (10.8) |
| Unknown | 20 (10.3) |
| RD | |
| No macroscopic tumor at the end of | 146 (75.2) |
| surgery (RD=0) | |
| Macroscopic tumor at the end of surgery | 42 (21.6) |
| (RD>0) | |
| Unknown | 6 (3.1) |
| Site of recurrent disease | |
| Retroperitoneal | 39 (20.1) |
| Single peritoneal | 62 (31.9) |
| Multiple peritoneal | 77 (39.7) |
| Carcinomatosis | 16 (8.3) |
| Ascites | |
| Yes | 23 (11.9) |
| No | 124 (63.9) |
| Unknown | 47 (24.2) |
| DFI, (mo) | |
| Mean (SD) | 43.9 (±38.5) |
| Median (quartiles*) | 32.5 (18, 59.5) |
| Follow-up (mo) | |
| Mean (SD) | 32.2 (±20.9) |
| Median (quartiles*) | 26 (17, 43.7) |
Table 2.
Factors predicting complete cytoreduction at the time of secondary cytoreductive surgery
| Characteristic | Univariate analysis | Multivariate analysis | ||
|---|---|---|---|---|
| OR (95% CI) | p-value | OR (95% CI) | p-value | |
| Age (years)* | 1.01 (0.80–1.46) | 0.616 | – | – |
| BMI (kg/m2)* | 0.93 (0.84–1.17) | 0.544 | – | – |
| ECOG | 0.22 | – | ||
| ECOG 0 | Reference | – | ||
| ECOG 1 | 0.59 (0.25–1.36) | – | ||
| Histotype | 0.019 | 0.14 | ||
| High-grade serous | Reference | – | Reference | – |
| Low grade serous & mucinous | 0.31 (0.05–1.83) | 0.198 | 0.45 (0.04–4.85) | 0.508 |
| Endometrioid | 2.83 (0.36–22.42) | 0.325 | 2.02 (0.23–17.77) | 0.525 |
| Clear cells | 0.31 (0.07–1.36) | 0.122 | 0.20 (0.03–1.23) | 0.083 |
| Undifferentiated | 0.24 (0.09–0.65) | 0.005 | 0.29 (0.09–1.00) | 0.05 |
| CA125 levels | 0.99 (0.99–1.001) | 0.266 | – | – |
| Stage at presentation | N.E. | – | ||
| I–II | Reference | – | ||
| III–IV | N.E. | – | ||
| RD at primary cytoreductive surgery | 0.037 | 0.239 | ||
| RD0 | Reference | Reference | ||
| RD>0 | 0.42 (0.19–0.95) | 0.55 (0.20–1.49) | ||
| Site of recurrent disease | 0.137 | |||
| Peritoneal multiple site | Reference | – | – | |
| Retroperitoneal | 1.78 (0.54–5.87) | 0.345 | – | – |
| Peritoneal single site | 1.06 (0.43–2.60) | 0.905 | – | – |
| Carcinomatosis | 0.34 (0.11–1.10) | 0.071 | ||
| Ascites | 0.086 | 0.138 | ||
| No | Reference | Reference | ||
| Yes | 0.43 (0.16–1.13) | 0.44 (0.15–1.31) | ||
| Disease-free interval | 0.019 | 0.43 | ||
| <12 months | Reference | Reference | ||
| ≥12 months | 3.16 (1.21–8.26) | 1.62 (0.49–5.36) | ||


 PDF
PDF Citation
 Print
Print


 XML Download