

 PDF
PDF Citation
 Print
Print


INTRODUCTION
Uterine leiomyoma is the most common benign uterine neoplasm affecting women of reproductive age [1]. With advances in techniques and devices, minimally invasive surgery is preferred over open surgery for the treatment of symptomatic leiomyomas because the smaller incisions, less postoperative pain, and shorter hospital stays all reduce the morbidity and mortality [23]. Power morcellation plays a crucial part in the removal of large uterine leiomyomas from the pelvic cavity during minimally invasive surgery [4].
Unfortunately, what are presumed to be leiomyomas before surgery are sometimes later found to be uterine sarcomas. Several studies have attempted to assess the rate of unsuspected uterine sarcoma among patients undergoing surgery for apparent benign uterine disease, leading to a suspected rate between 0.03% and 1% [567]. In 2014, the US Food and Drug Administration (FDA) stated that power morcellation might incur a risk of spreading malignant tissue, which in turn might significantly worsen long-term survival; therefore, it has discouraged the use of laparoscopic power morcellation for leiomyomas [89].
Uterine sarcomas are a rare heterogeneous group of malignant tumors of mesenchymal origin, accounting for only 3% of uterine malignancies and encompassing leiomyosarcoma (LMS), carcinosarcoma, and endometrial stromal sarcoma (ESS) according to traditional classification systems [10]. Tumor biology of carcinosarcomas leans toward an epithelial origin by immunohistochemical studies, and molecular comparison between the epithelial and mesenchymal components [11] have recently classified them as high-grade endometrial carcinomas with sarcomatous/stromal differentiation with biologic behavior similar to high-grade endometrial carcinomas [12]. After excluding carcinosarcoma, LMS and ESS are the most common malignant pure mesenchymal uterine tumors (MPMUT) of the uterus.
The lack of pre-therapeutic suspicion for uterine sarcoma, especially in the era of minimally invasive surgery including morcellation, can pose a great threat of intraperitoneal dissemination and initiation of inappropriate treatment, as well as delay proper treatment [1513]. It is therefore imperative to obtain an optimal pretreatment imaging diagnosis of uterine masses.
Magnetic resonance imaging (MRI) has been widely utilized for the precise characterization of the uterine masses [14151617]. Specifically, MRI has a profound role in the assessment and characterization of uterine mass at initial presentation, adequate staging (invasion depth, spread to adjacent organs, lymph node evaluation), and subsequently, determination of appropriate treatment plan. Typical MRI for leiomyomas has been suggested as well-defined masses of low signal intensity (SI) compared to the myometrium on T2-weighted imaging (T2WI) [16]. However, considerable overlap occurs in the magnetic resonance (MR) morphology, SI, and enhancement pattern of uterine sarcoma and degenerative leiomyomas [18]. Among the types of degeneration of leiomyomas, the appearance of uterine leiomyoma with cystic degeneration (ULCD) is important to recognize as it may also be seen in LMS [19].
Thus, the purpose of our study was to identify MRI features that could assist in the differentiation of MPMUT from ULCD.
MATERIALS AND METHODS
Our institutional review board approved this retrospective study with a waiver of the requirement for patients' informed consent.
1. Patients
One author (K.T.H. with 3-year experience in genitourinary imaging) performed a computerized search of our electronic medical records to find all female patients with histopathologically proven ULCD, ESS, or LMS from January 2000 and September 2015. A total of 74 female patients with ULCD, 39 with ESS, and 33 with LMS were identified; of those, we ultimately included 30 patients with ULCD, 15 with LMS, and 18 with ESS (former low-grade ESS) who had underwent preoperative MRI (Supplementary Fig. 1). The median interval between MRI and surgery or biopsy was 14 days (range, 2–603 days).
2. Clinical features
The clinical features of all patients were analyzed by one author (K.T.H.) using the electronic medical records of the hospital. He reviewed the patients' age, menopause state, initial symptom, baseline tumor marker level (cancer antigen [CA] 125, carcinoembryonic antigen [CEA], CA 19-9), and type of initial surgery, as well as whether the patient was suspected to have a benign tumor or a malignancy.
3. MRI technique
As our study population consisted of patients over an extended period of time, the patients underwent MRI examinations using either a 1.5-T system (Signa Excite; GE Healthcare, Waukesha, WI, USA or Magnetom Vision Plus; Siemens Medical Solutions, Erlangen, Germany) or a 3-T system (Trio Tim; Siemens Medical Solutions). An 8-channel body array coil was used. Hyoscine butyl bromide 20 mg (Buscopan; Boehringer Ingelheim Pharma, Ingelheim am Rhein, Germany) was injected intramuscularly before imaging in order to suppress bowel motion. Contrast enhanced MRI was obtained with axial fat-saturated T1-weighted gradient recalled echo (GRE) imaging before and at 3 minutes after intravenous bolus administration of contrast media using 0.1 mmol/kg of gadopentetate dimeglumine (Magnevist; Berlex Laboratories, Wayne, NJ, USA) injected at a rate of 2 mL/s followed by a 20-mL saline flush using a power injector.
The imaging protocol was generally as follows: 1) T2-weighted fast spin-echo imaging in the axial, coronal, and sagittal planes with 4,500/110 ms TR/TE, 90° flip angle (FA), 22-cm field of view (FOV), 5-mm slice thickness, 1-mm intersection gap, 384×224 matrix, and number of excitations (NEX) totaling 2; 2) axial T1-weighted fast spin-echo imaging with 650/9.2 ms TR/TE, 90° FA, 2-cm FOV, 5-mm slice thickness, 1-mm intersection gap, 320×192 matrix, and 2 NEX; 3) contrast enhanced axial fat-saturated T1-weighted GRE imaging with 4/2 ms TR/TE, 12° FA, 30-cm FOV, 6-mm slice thickness, 1-mm intersection gap, 256×160 matrix, and 0.7 NEX.
Diffusion-weighted MRI (DWI) with calculation of apparent diffusion coefficient maps and dynamic contrast enhanced (DCE) MRI have been recently used as part of our routine multiparametric MRI protocol for pelvic masses, but were not assessed as part of this study. DCE MRI consists of precontrast, 1 minute, 3 minutes, and 5 minutes enhancement images after intravenous bolus administration of contrast media. In the cases of examination with DCE MRI, only 3 minutes enhancement images were included for the review in this study.
4. MRI analysis
MR images were interpreted by 2 radiologists (K.T.H. and C.J.Y.) on the following MRI features in consensus who were blinded to the pathologic diagnoses: 1) maximum size of the tumor on axial T2WI; 2) location of the tumor; endometrial, myometrial or subserosal; 3) tumor margin (ill-defined if any portion of outer contour of the uterine mass is ambiguous and indistinguishable with adjacent myometrium); 4) presence of a peripheral dark band signal in T2WI; 5) presence of a peripheral crescent-shaped lesion; 6) speckled appearance (diffusely scattered hyperintense T2 SI spots within the mass) [20]; 7) presence of an intratumoral hemorrhage; 8) presence of local invasion; 9) presence of lymphadenopathy; and 10) presence of distant metastasis. In the event where the consensus was not reached, the third reviewer (S.Y.K) further analyzed and made final decision.
Both subjective and objective analyses were performed for the SI of the solid part of the tumors on T2WI. For the subjective analysis of the solid part of the tumor, the reviewers assessed the lesion either as high T2 SI or iso/low T2 SI in comparison with the normal myometrium. For the objective analysis, the radiologists measured the mean T2 SI at the solid portion of the tumor as well as the gluteus maximus muscle. Thereafter, the T2 SI ratio of the solid portion of the tumor-to-gluteus maximus muscle was calculated using the following equation:
T2 SI ratio of the solid portion of the tumor-to-gluteus maximus muscle=(mean T2 SI at the solid portion of the tumor−mean T2 SI at the normal gluteus maximus muscle)/(mean T2 SI at the normal gluteus maximus muscle)
5. Statistical analysis
The clinical manifestations and prevalence of each MR finding, including T2WI SI between ULCD, ESS, and LMS, were compared using a χ2 test for the nominal variables. One-way analysis of variance (ANOVA) with Tukey-Kramer post hoc comparisons and Student's t-test were utilized for the continuous variables. Thereafter, binary logistic regression analyses using the enter method were performed to identify the most significant MR finding for the differentiation of MPMUT (n=33) from ULCD. Statistical analyses were performed using SPSS version 21.0 (SPSS Inc., Chicago, IL, USA). A p-value of <0.05 was considered to indicate a significant difference.
RESULTS
1. Clinical manifestation
The mean age was 45.5 years in ULCD, 42.9 years in ESS, and 56.9 years in LMS. A significant age difference (p=0.005) was found, with LMS more common in older patients compared with ESS and ULCD. Accordingly, patients with menopause state were more common in LMS compared with ULCD (p<0.001). Tumor marker did not show significant difference among 3 groups. Asymptomatic patients were significantly more common in ULCD compared with MPMUT: ESS and LMS combined (n=33) (p=0.034). The types of initial surgery differed between ULCD and MPMUT (p=0.022); myomectomy was frequently performed on ULCD. Among 33 MPMUT, 13 patients (13 out of 33, 40%) were presumed as benign lesions initially whereas among 30 ULCD, 9 patients (9 out of 30, 30%) were presumed as malignant lesions. The clinical manifestations of 3 groups are summarized in Table 1.
Table 1
Clinical manifestation of ULCD, ESS, and LMS
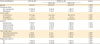
Except where indicated, data are numbers of patients or mean±standard deviation and numbers in parenthesis are percentages.
CA, cancer antigen; CEA, carcinoembryonic antigen; ESS, endometrial stromal sarcoma; LMS, leiomyosarcoma; MPMUT, malignant pure mesenchymal uterine tumor; ULCD, uterine leiomyoma with cystic degeneration.
*One-way analysis of variance; †χ2 test, ULCD vs. MPMUT; ‡χ2 test, ULCD vs. ESS; §χ2 test, ULCD vs. LMS.
2. MRI findings
The comparison of MRI findings among the ULCD, ESS, and LMS groups are summarized in Table 2. The mean values of the maximum diameter±standard deviation of tumors were 12.3±6.0 cm for ULCD, 9.8±4.8 cm for ESS, and 9.8±4.3 cm for LMS, and were not significantly different (p=0.177). The tumor location for the ULCD group was significantly different than the ESS (p<0.001), and there was a borderline difference between ULCD and LMS (p=0.051). Most of the ULCD lesions showed either an intramural (36.4%) or subserosal (53.3%) location, while most of the ESS tumors (16/18 cases, 88.9%) and only 5 of 15 cases of LMS (33.3%) were located in the endometrium. A well-defined tumor margin was more frequently observed in ULCD (96.7%) compared with MPMUT (33.3%). Bands of low SI on T2WI were more frequently observed in ESS than in ULCD (p<0.001). The presence of peripheral crescent lesions did not show a significant difference among the 3 groups. A speckled appearance was more frequently demonstrated in the ULCD group than in the ESS (p<0.001) and LMS (p=0.048) groups. Most of the LMS cases (86.7%) showed tumoral hemorrhage, which was significantly different compared with the ULCD group (30%) (p=0.001). At the initial work up, 3 ESS and 2 LMS cases showed local invasion. Two LMS cases showed pelvic lymphadenopathy and 3 LMS cases had distant metastasis.
Table 2
MRI findings of ULCD, ESS, and LMS
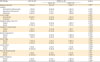
Except where indicated, data are numbers of patients or mean±standard deviation and numbers in parenthesis are percentages.
ESS, endometrial stromal sarcoma; LMS, leiomyosarcoma; MPMUT, malignant pure mesenchymal uterine tumor; SI, signal intensity; ULCD, uterine leiomyoma with cystic degeneration.
*One-way analysis of variance; †χ2 test, ULCD vs. MPMUT; ‡χ2 test, ULCD vs. ESS; §χ2 test, ULCD vs. LMS.
Supplementary Table 1 summarizes both the subjective and objective analyses of T2WI SI in the main solid portion of ULCD, ESS, and LMS lesions. ULCD appeared to be significantly more hypointense compared to normal myometrium than the MPMUT on subjective analysis (90% vs. 33%, respectively). For the objective analysis, the SI ratio of the solid portion of the tumor-to-gluteus maximus muscle showed significant differences among the 3 groups: 0.62±0.80 in ULCD compared with 2.44±1.29 in ESS, and 1.13±0.63 in LMS. Supplementary Fig. 2 is a box and plot showing T2WI SI in the main solid portion of the lesions of the 3 groups.
Binary logistic regression analysis revealed an ill-defined margin and high T2WI SI ratio as significantly independent differential MR features of MPMUT from ULCD (odds ratio [OR]=44.885; p=0.003 and OR=4.396; p=0.046, respectively) (Table 3).
Table 3
Results of multivariate analysis for clinical and MRI findings of MPMUT (n=33) compared with ULCD (n=30)

T2WI SI ratio defined as (mean T2 SI at the solid portion of the tumor−mean T2 SI at the normal gluteus maximus muscle)/(mean T2 SI at the normal gluteus maximus muscle).
CI, confidence interval; MPMUT malignant pure mesenchymal uterine tumor; MRI, magnetic resonance image; SI, signal intensity; ULCD, uterine leiomyoma with cystic degeneration; WI, weighted image.
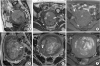
Fig. 1
(A-C) ULCD in a 41-year-old woman. Sagittal T2WI (A) and axial T2WI (B) show marked uterine enlargement due to a heterogeneous well-defined myometrial tumor with multifocal cystic component. Axial T1WI with fat suppression (C) showed no evidence of hemorrhage. Note the main solid portion of the tumor (arrow) showing T2 hypointensity compared with normal uterine myometrium (arrowhead). The T2 SI ratio of the main solid portion to that of gluteus maximus muscle was 0.56. (D-F) ULCD in a 46-year-old woman. Sagittal T2WI (D) and axial T2WI (E) show a well-defined myometrial tumor with multifocal cystic component. Axial T1WI with fat suppression (F) showed multifocal hemorrhage within cystic components. Note the main solid portion of the tumor (arrow) showing T2 isointensity compared with normal uterine myometrium (arrowhead). The T2 SI ratio of the main solid portion to that of gluteus maximus muscle was 0.81.
The tumor displayed a speckled appearance (line) without a peripheral band of T2 hypointensity.
SI, signal intensity; ULCD, uterine leiomyoma with cystic degeneration; WI, weighted image.
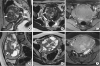
Fig. 2
(A–C) ESS in a 54-year-old woman. Sagittal T2WI (A) and axial T2WI (B) show marked uterine enlargement due to a heterogeneous ill-defined myometrial tumor with multifocal cystic component. The tumor shows numerous peripheral bands of T2 hypointensity (line). Axial T1WI with fat suppression (C) shows no evidence of hemorrhage. The T2 SI ratio of the main solid portion to that of gluteus maximus muscle was 2.51. (D-F) ESS in a 40-year-old woman. Sagittal T2WI (D) and axial T2WI (E) show an ill-defined endometrial tumor with a peripheral band of T2 hypointensity (line). Axial T1WI (F) showed no evidence of hemorrhage. The T2 SI ratio of the main solid portion to that of gluteus maximus muscle was 2.32.
Note the main solid portion of the tumor (arrow) showing T2 hyperintensity compared with normal uterine myometrium (arrowhead).
ESS, endometrial stromal sarcoma; SI, signal intensity; WI, weighted image.
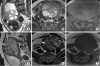
Fig. 3
(A-C) LMS in a 53-year-old woman. Sagittal T2WI (A) and axial T2WI (B) show marked uterine enlargement due to a heterogeneous myometrial tumor with multifocal cystic component and a multifocal ill-defined margin (line) without a peripheral band of T2 hypointensity. Axial T1WI with fat suppression (C) showed focal hemorrhage within the tumor. The T2 SI ratio of the main solid portion to that of the gluteus maximus muscle was 1.52. (D-F) LMS in a 56-year-old woman. Sagittal T2WI (D) and axial T2WI (E) show an ill-defined myometrial tumor with a multifocal ill-defined margin (line) without a peripheral band of T2 hypointensity. Axial T1WI with fat suppression (F) showed multiple hemorrhages. The T2 SI ratio of the main solid portion to that of gluteus maximus muscle was 1.36.
Note the main solid portion of the tumor (arrow) showing T2 hyperintensity compared with normal uterine myometrium (arrowhead).
LMS, leiomyosarcoma; SI, signal intensity; WI, weighted image.
DISCUSSION
In 2014, the US FDA issued a statement discouraging the use of power morcellation for hysterectomy and myomectomy owing to the potential for dissemination of an occult uterine sarcoma [89]. The statement had a huge impact on the practice of gynecology considering the fact that uterine leiomyomas are the most common uterine tumor, for which there is high demand for minimal invasive surgery; approximately 50% of women with leiomyoma prefer it even after the completion of childbearing [113]. Therefore, in cases where there is suspicion for uterine malignancy from uterine leiomyoma including initial presentation related with tumor rupture (hemoperitoneum), tumor growth on follow-up in post-menopausal women or heterogeneous echogenicity in pelvis ultrasound, thorough preoperative MR imaging is more important to differentiation the 2 entities. To the best of our knowledge, our study is the first to compare preoperative MRI features of ULCD from those of MPMUT. We found multiple MRI features that could differentiate MPMUT from ULCD and conclude that an ill-defined margin and a relatively high T2 SI ratio compared to gluteus maximus muscle are the two most independent features favoring MPMUT.
ESS is the second most common of the MPMUT even though they account for only 0.2% of all malignant uterine tumors [21]. Although the imaging findings of uterine sarcoma are nonspecific, Koyama et al. [22] specifically reported that bands of low SI are observed within the areas of myometrial involvement on T2WI in ESS and that these bands correspond to the preserved bundles of myometrium on pathologic examination. The results of our study are well in line with the previous report. In 18 cases of ESS, 15 cases demonstrated the low SI bands on T2WI. On the other hand, these findings were observed in only 4 of 15 cases of LMS and in 5 of 30 cases of ULCD (p<0.001).
LMS is the most common of the MPMUT, accounting for 1% to 2% of uterine malignancies [22]. In our study, LMS tend to be accompanied by more hemorrhage than ULCD and ESS (LMS, 86.7%; ESS, 16.7%; ULCD, 30%; p=0.001). Hemorrhage within LMS is one of commonly reported findings and aggressive behavior of tumor cells with accompanied necrosis is one of the pathologic explanation for tumoral hemorrhage [142324].
ULCD is observed in about 4% of leiomyomas and may be accompanied by myxoid degeneration [25]. It is clinically important that cystic degeneration may also be seen on MRI in other malignant uterine tumors [25]. In our study, several distinctive MRI findings of ULCD for the differential diagnosis from MPMUT were found. A well-defined tumor margin was one of the distinctive MRI findings of ULCD (90%) compared with MPMUT (ESS, 33.3%; LMS, 33.3%) in this study. This result is well in line with previous studies that showed a tendency for an ill-defined margin in malignant uterine tumors, representing the aggressiveness and infiltrative nature of the malignant cells [142627].
In the present study, a speckled appearance was more frequently observed in ULCD than in MPMUT. Ha et al. [20] classified heterogeneous leiomyomas into four patterns depending on the morphologic appearance of signal intensities: speckled, nodular, cystic, or indeterminate. The speckled pattern was associated with a mild degree of hyaline or myxoid degeneration or focal areas of necrosis. The cystic pattern indicated a disease with cystic change, commonly related to a severe hyaline or myxoid degeneration or necrosis. The areas showing a speckled pattern in the ULCD may represent the areas of residual smooth muscles with milder hyaline degenerative change rather than areas with severe cystic degenerative change.
Several studies have reported higher T2WI SI of malignant uterine tumors compared with leiomyomas [282930]. Sumi et al. [28] defined the contrast ratio (CR) of T2 SI as [(SItumor−SIiliopsoas muscle)/SIiliopsoas muscle] and found a statistically higher CR for sarcomas compared with leiomyomas (2.54 vs. 0.99, p=0.006). In addition, the author reported different CRs according to the histologic type in uterine sarcomas, with ESS having a higher CR than LMS (0.31 vs. 2.73, p=0.012). Namimoto et al. [29] reported that uterine sarcomas had a significantly higher tumor-myometrium CR on T2WI than leiomyomas. Tanaka et al. [30] also reported a high T2WI SI of more than 70% of smooth muscle tumors of uncertain malignant potential and LMS compared with that for leiomyomas. In the present study, both objective and subjective analysis of T2 SI of the main solid component of the tumor revealed that a high T2 SI ratio compared to the SI of the gluteus maximus muscle is suggestive of MPMUT rather than ULCD. Furthermore, the ESS group had a higher T2 SI ratio than the LMS group (2.44 vs. 1.13, p<0.001). One pathophysiologic explanation for the high T2 SI of ESS is that these tumors are composed exclusively of cells resembling the endometrial stroma in its proliferative phase, which contain a rich mucinous component [1031].
In the binary logistic regression analysis, only an ill-defined margin and high T2 SI ratio were considered as independent variables for differentiation between ULCD and MPMUT. These findings may prove to be useful considering that the margin and T2 SI ratio of the uterine tumor can be evaluated intuitively even in conventional MRI sequences.
We noticed a higher incidence of asymptomatic patients in the ULCD group than in the MPMUT group, and among older patients in the LMS than in the ESS and ULCD groups. However, the binary logistic regression test results showed that MRI features such as ill-defined margin and high T2 SI ratio are more useful in determining whether the uterine mass is of the ULCD or MPMUT type, irrespective of different clinical features.
Our study had several limitations. First, it included a relatively small number of patients; however, we were still able to uncover valuable MRI differential findings of ULCD from MPMUT that were in concordance with previous reports. We postulate that further study with more patients might strengthen our findings. Second, our study was of retrospective design with rare tumors, thus subjecting it to potential selection bias. In many clinical settings, because mesenchymal neoplasms are both uncommon and difficult to diagnose on imaging, conservative follow-up is often preferred to the surgery. Further generalization with prospective study design is needed for the generalization of our results. Third, because we included patients diagnosed over a long period, we could not use functional MRI sequences such as diffusion weighted images or DCE images, which are currently part of our routine multiparametric protocol for pelvic masses. The utilization of diverse MRI systems (both 1.5T and 3T) could also be our limitation. However, in order to normalize and objectify the values, we utilized the ratio between normal gluteus muscles which resulted in the minimization of inter-machinery measurement difference.
In conclusion, this study revealed that several MRI findings differed between ULCD and MPMUT. An ill-defined tumor margin and high T2WI SI were proven to be the most independent MRI differentiators of MPMUT from ULCD.
 XML Download