

 PDF
PDF Citation
 Print
Print


INTRODUCTION
Uterine carcinosarcoma (UCS) is classified as a high-grade endometrial carcinoma [1]. UCS is histologically composed of 2 cell type components: a carcinoma and a sarcoma [1]. Recent leading-opinion on clonal origin favors that UCS is as a metaplastic tumor with the sarcoma component being dedifferentiated from the carcinoma component [23]. More recent comprehensive high throughput analyses not only showed similar gene signatures to endometrial cancer (EC) but also demonstrated strong evidence of an epithelial-mesenchymal transition in UCS [45].
UCS is characterized by older age of onset, typically in the 7th decade of life [6]. Black women have a disproportionally increased risk compared to other races/ethnicities [67]. Exposure to tamoxifen and pelvic radiation are recognized risk factors for UCS [8910]. When compared to other types of high-grade endometrial carcinoma or even uterine sarcoma, UCS is more likely to present with metastatic disease especially in lymph nodes, and is associated with worse survival outcomes [111213]. The carcinoma component is the main prognostic indicator in UCS but the sarcoma component also has a major impact on survival and treatment response [1415].
UCS is considered a rare tumor. The incidence of UCS in the general population ranges from 5.1 to 6.9 per 1,000,000 person-years [16]. UCS comprises less than 5% of uterine tumors [11718]; however, this statistic was based on studies mixed with uterine sarcoma or conducted several decades ago. Due to its rarity, UCS has been understudied, and recent population-based statistics solely in the EC population are missing. Given a recent change in demographics in the U.S., providing trends and changes in the characteristics of UCS will be useful in understanding its epidemiology of this disease. The objective of this study is to examine temporal trends in the proportion of UCS among women with EC.
MATERIALS AND METHODS
1. Data source
This is a retrospective observational study examining The Surveillance, Epidemiology, and End Results (SEER) program between 1973 and 2013. The SEER program is a population-based database launched in 1973 that is supported and managed by the National Cancer Institute in the U.S. [19]. SEER covers approximately 27.8% of the US population from 11 states and 7 areas. SEER data are publicly available and deidentified. Data entry into the tumor registry was performed by certified trained personnel with vigorous quality control [20]. The current study was deemed exempt by the University of Southern California Institutional Review Board.
2. Eligibility
The SEER*Stat 8.3.2 (IMS Inc., Calverton, MD, USA) was used to extract the dataset for the SEER18 covering cases between 1973 and 2013. Cases were identified by searching “Uteri Corpus” limited to malignancy and female sex. Primary EC cases were eligible for the analysis, and uterine sarcoma and metastatic tumor to the uterus from another origin were excluded from the analysis. The 3rd edition of International Classification of Diseases for Oncology site/histology validation and World Health Organization (WHO) histological classification codes for 8950-3, 8951-3, 8980-3, and 8981-3 were used for the surrogates for UCS cases.
3. Clinical information
Among eligible cases, calendar year of diagnosis (1973–2013), age at diagnosis (continuous), race (White, Black, Hispanic, Asian, and others), marital status (single, married, divorced, and widow), registry area (west, central, and east), histology types (endometrioid, serous, clear cell, mucinous, mixed, carcinosarcoma, squamous, and undifferentiated), and tumor grade (1, 2, and 3) were abstracted from the database.
4. Study definition
Based on a prior study, an age cutoff of 60 years was used to group young women (<60 years) and old women (≥60 years) for our analysis [14]. Type II EC was defined as grade 3 endometrioid, serous, clear cell, mucinous, mixed, carcinosarcoma, squamous, and undifferentiated types. Whereas, type I EC was defined as grade 1–2 endometrioid types as described previously [2122].
5. Statistical consideration
The primary interest of analysis was to examine temporal trends in the proportion of UCS among primary EC. The secondary interest of the analysis was to examine the temporal trends based on age, cancer type, and race. In addition, trends in age at UCS diagnosis were examined.
The Joinpoint Regression Program 4.2.0.2 provided by the National Cancer Institute was used for the temporal trends analysis to determine potential changes in temporal trends [23]. Time duration was grouped every calendar year or every year of patient age, and the time-specific proportion of UCS was examined during the study period. A linear segmented regression test was utilized for the model, and log-transformation was performed to determine annual percent change (APC) of the slope with 95% confidence interval (CI) [24]. All hypotheses were 2-tailed, and a p-value of less than 0.05 was considered statistically significant.
RESULTS
1. Patient demographics
During the study period, there were 246,737 cases of uterine malignancies recorded in the tumor registry. Of those, 10,578 cases of uterine sarcoma and 309 cases of metastatic tumors to the uterus from other origin were excluded from the analysis. The final study population comprised 235,849 cases of primary EC.
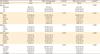
UCS were seen in 11,000 (4.7%, 95% CI=4.6, 4.8) women during the study period. The patient demographics of UCS are shown in Table 1. Mean age at diagnosis was 68.2 years, with 8,603 (78.2%) women aged 60 years or older. When compared to those who had other histology types, women with UCS were more likely to be older, Black, live in the eastern U.S., and divorced/widowed (all, p<0.001). Uterine UCS was more likely to present with distant metastatic disease than other histology types (27.6% vs. 8.0%, p<0.001).
Table 1
Patient demographics of UCS
2. Trends in age at cancer diagnosis
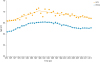
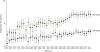
Because age represents a key risk factor for UCS, trends in age at diagnosis were examined during the study period (Fig. 1). Mean age at UCS diagnosis increased from 65.9 to 71.7 years between 1973 and 1988 (APC=0.50; 95% CI=0.37, 0.62; p<0.001) and then decreased from 71.7 to 67.0 years between 1988 and 2013 (APC=−0.19; 95% CI=−0.26, −0.13, p<0.001). Mean age at diagnosis was also examined in the entire cohort of primary EC (Fig. 1). Similar to the UCS cohort, there seems to be a recent decrease in the mean age at diagnosis in the entire cohort of primary EC from 65.3 to 62.6 years between 1993 and 2007 (APC=−0.33; 95% CI=−0.38, −0.28; p<0.001).
3. Trends of UCS (all histology types)
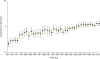
We first examined the temporal trends of the proportion of UCS in the entire cohort of primary EC (n=235,849). In the past 4 decades, there was a significant increase in the proportion of UCS throughout the study period as demonstrated in Fig. 2. These significant increases were seen between 1973 and 1979 from 1.7% to 3.5% (APC=11.6; 95% CI=9.6, 13.6; p<0.001) and between 1979 and 2013 from 3.5% to 5.6% (APC=1.4; 95% CI=1.4, 1.5; p<0.001).
4. Trends of UCS in type II cancer
Because UCS is considered a high-grade EC, we compared the carcinosarcoma cases to other type II ECs, including grade 3 endometrioid, serous, clear cell, mucinous, mixed, carcinosarcoma, and undifferentiated types (n=65,118). Compared to other histology types among type II EC, women with UCS were more likely to be old, Black, live in the eastern U.S., and be divorced/widowed (Table 1).
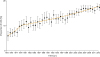
Among type II ECs, the proportion of UCS has increased significantly throughout the study duration as shown in Fig. 3. Specifically, there was an increase in the proportion of UCS from 6.0% to 10.2% between 1973 and 1979 (APC=9.2; 95% CI=7.2, 11.2; p<0.001). Additionally, there was a significant increase in the proportion of UCS from 10.2% to 17.5% between 1979 and 2013 (APC=1.7; 95% CI=1.6, 1.7; p<0.001).
5. Trends of UCS in young or old women
UCS is a disease of the elderly. Thus, we examined the trends of UCS in young and old women. An increasing proportion of UCS among primary EC was seen in both young and older women as shown in Fig. 4. Among women aged <60 years (n=90,455), the increase in the proportion of UCS was steady throughout the study period without flexion points in temporal trends from 1.3% in 1973 and 3.3% in 2013 (APC=2.02; 95% CI=1.63, 2.40; p<0.001). Among women aged ≥60 years (n=145,394), there was a significant increase in the proportion of UCS during the study period but the magnitude of increase was larger in the older women compared to the younger women (2.6% in 1973 to 7.0% in 2013).
6. Trends per race
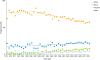
Because race is a salient risk factor for UCS, we examined trends of race during the study period (Fig. 5). Among women with UCS, there was a significant decrease in the proportion of White women during the study period from 86.0% to 60.5% between 1987 and 2013 (APC=−1.16; 95% CI=−1.3, −0.99; p<0.001). Conversely, there was a significant increase in proportion of Black women during the study period from 11.9% to 20.3% between 1974 and 2013 (APC=1.15; 95% CI=0.76, 1.54; p<0.001). Similar trends were seen in the entire cohort of primary EC, with a steady decrease in the proportion of White women from 90.6% to 67.5% and an increase in the proportion of Black women from 2.9% to 10.0% between 1973 and 2013.
DISCUSSION
Our study demonstrated that the proportion of carcinosarcoma among ECs has significantly increased over time in the U.S. This increase in proportion of UCS was also seen among women with high-grade EC. Possible causalities to link these trends include demographic changes in age, race, and the obesity in the U.S.
This study found that there is a marked change in the race distribution among women with UCS, with a decrease in the proportion of White women and an increase in the proportion of Black women. This trend was also seen in the entire EC cohort. Because Black women have substantially increased risks of developing UCS compared to other races or ethnicities [67], this increase in the proportion of Black women with UCS may be due to an increase in the proportion of UCS in EC.
Some may argue that our observation of racial distribution changes may not reflect the general population because this tumor registry, SEER program, only covers less than one third of the U.S. population and is composed of unique geographic areas related to racial distribution [19]. However, a recent U.S. census indicates a similar trend in racial distribution in this country as a population, with a decrease in White proportion and an increase in Black proportion [25]. Therefore, it is most likely that the racial distribution changes seen in the SEER program reflect the demographic changes in the U.S. population.
UCS is generally a disease of the elderly, leading us to postulate that the increase in the proportion of UCS may be due to the increase in the number of older women in the U.S. society [26]. In fact, the age at diagnosis of UCS increased significantly until the late-1980s, and the proportion of UCS continues to increase in older women. However, in the past few decades, the age of diagnosis for women with UCS became younger. Moreover, an increasing proportion of UCS within ECs was also seen in the younger age group, suggesting other factors such as obesity as a cause for the increasing proportion of UCS.
The obese population continues to increase in the U.S. In the year 2013–2014, more than one third of the adult population was estimated to be obese (37.7%). This has increased by more than several percentage points since the year 1999–2000 (30.5%) [27]. We thus speculate that an increasing obese population in the U.S. may be one possible cause linking these temporal trends of recent younger age at diagnosis of UCS and an increase in proportion of UCS among young women.
Obesity is known to be a state of chronic systemic inflammation related to the excess adipose tissues [28]. Pro-inflammatory cytokines related to obesity are associated with an increased risk of EC [28]. Inflammation increases the epithelial-mesenchymal transition in tumor via induction of adhesion molecules and transcription factors [293031]. Free fatty acid related to obesity can be an alternative pathway inducing the epithelial-mesenchymal transition in tumors [32]. The epithelial-mesenchymal transition is a unique characteristic in UCS [1]. Recent high-throughput molecular analyses have shown that UCS not only has genetic similarities to endometrial carcinoma but also has increased expression of epithelial-mesenchymal transition markers [45]. Therefore, it may be speculated that obesity not only increases the risk of EC but also increases the epithelial-mesenchymal transition in endometrial tumors to further form UCS.
Obesity is also a risk factor for developing breast cancer [33], for which tamoxifen is commonly used as an adjuvant therapy. Tamoxifen use is known to be associated with an increased risk of UCS [8910]. There is a global increase in the incidence of breast cancer [34], with a concordant increase in tamoxifen use [35]. These increases in the rate of tamoxifen use may be associated with the increased incidence of UCS.
UCS has been previously considered as a member of uterine sarcoma until recently, and thus, this may possibly attribute to the increase in proportion of UCS. However, when trends in the proportion of uterine sarcoma among uterine malignancies were examined in a post hoc analysis, there was no counter-decrease in the proportion of uterine sarcoma among uterine malignancies during the study period (3.8% in 1973 and 4.0% in 2013). Therefore, misclassification between these 2 categories is unlikely.
Strengths of this study are that this is likely the first study demonstrating increasing trends of UCS by utilizing a population-based tumor registry. A weakness of this study is its retrospective nature, and thus the inherent possibility of missing confounding factors. For instance, this database does not have other salient information such as tamoxifen use to support our hypotheses. Moreover, this study only examined proportional changes among women who developed EC, as we do not have information on cancer incidence in the general population.
A critical limitation of the study is that central pathology review to confirm UCS was not performed. As this study covers a long time, it is likely that reliability of histopathology diagnosis has changed over time, in part related to evolving use of immunohistochemistry. Lastly, while the aforementioned hypothesis linking increasing obese population and increasing trends of UCS sounds plausible, this database does not have information for body mass index to prove this.
The clinical implications of our results may lie in the prevention, diagnosis, and treatment for UCS. The increasing trend in the diagnosis of UCS is particularly applicable to treatment strategy as prognosis of UCS is generally poor even in early-stage disease [1415]. There are currently limited treatment choices for chemotherapeutic agents for UCS, and therefore, developing effective treatment agents and strategies should be of paramount importance.
In conclusion, there seems to be a significant increase in proportion of UCS among EC. Previously, the proportion of UCS was recognized to comprise less than 5% of all uterine tumors [11718]. However, the proportion of UCS now exceeds 5% with a continuous increase. Based on our observation, we respectfully suggest that UCS is no longer considered to be a rare tumor in the era of 21st century.
 XML Download