

 PDF
PDF Citation
 Print
Print


INTRODUCTION
Epithelial ovarian cancer (EOC) is known as one of the most serious gynecologic cancers [1] and shows a higher incidence in developed countries [2]. The general presentation of late stage EOC includes increased ovarian tumor size and multiple metastatic lesions in the peritoneal cavity with ascites. However, we sometimes encounter cases of advanced stage EOC without definite ovarian enlargement, known as “normal-sized ovarian carcinoma syndrome (NOCS).”
In 1989, Feuer et al. [3] first introduced the concept of NOCS, a diffuse metastatic malignant disease of the abdominal cavity of the female, with normal-sized ovaries and no origin assigned definitively by intraoperative or preoperative evaluation; this was divided into subgroups of primary EOC, primary peritoneal carcinoma (PPC), metastatic tumor from other primary origin, and mesothelioma. They reported that, except for primary EOC, survival of patient subgroups was usually less than 1 year, and a proper treatment strategy had not yet been identified. There are only a few studies on NOCS, and most of the previously published reports are case series of small numbers [4567]. There is still a lack of information on the prognostic value of ovary size in EOC. Location of metastatic lesions and the size of metastatic lymph nodes, rather than ovary size, are considered important in the International Federation of Gynecology and Obstetrics (FIGO) staging for EOC [8]. Previously, a retrospective analysis of 110 EOC patients regarding tumor size revealed that early stage EOC cases had larger diseased ovaries than advanced stage EOC [9], and they suggested that this might be a factor that separates EOC into different diseases.
We can speculate that primary EOC with normal-sized ovary would exhibit different biological behavior from the more common EOC with ovarian enlargement. However, there is little information for comparison of outcomes between serous EOC with normal-sized ovary and enlarged-ovarian tumor, especially in advanced stages. We carried out a retrospective analysis comparing the survival outcomes of patients with advanced serous EOC with normal-sized ovary and enlarged-ovarian tumor by propensity score matching analysis.
MATERIALS AND METHODS
1. Patients
With Institutional Review Board (IRB) approval (No. 2017-03-077-002), we reviewed data from all patients with primary EOC who were treated at Samsung Medical Center from January 2002 to December 2015. We retrospectively obtained data from electronic medical records. We enrolled patients depending on the inclusion criteria as follows: 1) primary EOC with FIGO stages IIIB, IIIC, or IV disease; 2) high-grade serous type histology; and 3) patients who were treated with primary debulking surgery (PDS) with adjuvant chemotherapy for primary treatment. Patients who underwent neo-adjuvant chemotherapy (NAC) with interval debulking surgery (IDS) were excluded from the study. A total of 419 patients were selected for this study, of which 48 (11.5%) with a normal-sized ovary (less than 4 cm in the longest diameter, with a tumor size greater than 5×5 mm within the ovarian substance) and relatively well-preserved normal ovarian appearance confirmed by both preoperative imaging studies and operation records were categorized as the NOCS group. Pathologic classification of normal-sized ovary was completed according to the pathologic report of a gynecologic pathologist who was aware of NOCS, as a previously published study from our institution in which the criteria of normal-sized ovary of advanced stage serous EOC were used [10].
2. Treatment and follow-up
Before the start of primary treatment, patients were routinely examined by serum cancer antigen (CA)-125 level and imaging studies including abdominal/pelvic computed tomography (CT), magnetic resonance imaging (MRI), and positron emission tomography (PET)-CT. Radiologists evaluated the imaging studies to report metastatic lesions and size of EOC for treatment plans.
For primary surgical treatment, bilateral salpingo-oophorectomy, hysterectomy, peritoneal washing, retroperitoneal lymphadenectomy, omentectomy, and tumorectomy of any metastatic lesions were performed routinely. If any abnormalities were suspected, peritoneal biopsy was performed for pathologic confirmation. For defining residual disease status after PDS, the largest diameter of residual disease was measured and categorized as follows: no residual, <1 cm residual, and ≥1 cm residual disease. After surgery, gynecologic pathologists reviewed all surgical pathology slides.
For adjuvant chemotherapy, the first cycle of combination chemotherapy consisting of taxane/platinum was initiated routinely within 2 weeks of surgery. Subsequent chemotherapy cycles were performed every 3 weeks for 6 cycles, but there could have been variation in the number of cycles depending on patient situation.
We designated overall survival (OS) as the time between initial diagnosis and patient death or loss to follow-up. Progression-free survival (PFS) was designated as the time between diagnosis and patient recurrence/progression or loss to follow-up.
3. Statistical analysis
We used summary statistics to describe the data. Medians (range) or means (standard deviation) were used for continuous variables. Mann-Whitney U test for comparing median values and Student's t-test for comparing mean values were used after the Shapiro-Wilks test to confirm normal distributions. We presented categorical variables as frequencies (percentages). We used Fisher's exact test or χ2 test for analyzing the distribution of characteristics according to NOCS. Analyses for survival curves were performed by the Kaplan-Meier method and comparisons were performed using the log-rank test. We used the Cox proportional hazards model to perform univariate and multivariate analyses for the evaluation of the prognostic significance of NOCS and other clinicopathological features. Multivariate p-values were used to present the significance of each feature. To quantify the correlation between survival time and each independent feature, a 95% confidence interval (CI) was used. All p-values were 2-sided, and we considered p-values less than 0.05 as statistically significant. We performed statistical analyses using R 3.0.3 (R Foundation, Vienna, Austria; http://www.R-project.org).
After the total cohort analyses, propensity score matching was performed to further investigate patient characteristics. Normal-sized ovary cases were 1:3 matched with the closest propensity patients with enlarged-ovarian tumor according to age, FIGO stage, residual disease status after PDS, and initial CA-125 level (performed with R using the MatchIt package). The propensity scores were calculated using a multivariable logistic regression model based on factors that demonstrated significant differences between the 2 groups in the total cohort.
RESULTS
In this study, 419 EOC patients of stages IIIB, IIIC, or IV with high grade serous type histology were investigated. Among EOC patients treated at Samsung Medical Center from 2002 to 2015, 672 were stage IIIB, IIIC, or IV. We excluded 184 patients with other than high-grade serous type and 69 patients who received NAC.
The clinical features of the included patients are shown in Table 1. Patients with enlarged-ovarian tumor were younger (54.0±10.3 vs. 58.4 ± 9.2 years; p=0.005) than those in the normal-sized ovary group, and there was a statistically significant difference in residual disease status between the 2 patient groups. To reduce the selection bias when comparing the 2 groups of patients, propensity score matching was performed with R using the MatchIt package with nearest-neighbor 1:3 matching according to age, FIGO stage, residual disease status after PDS, and initial CA-125 level. Propensity score matching was successful, with no significant differences between the 2 groups for all matched variables.
Table 1
Characteristics of study cohort
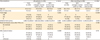
Data are shown as mean ± standard deviation or number (%).
ASA, American Society of Anesthesiologist; CA-125, cancer antigen-125; FIGO, International Federation of Gynecology and Obstetrics; PDS, primary debulking surgery.
![]()
After propensity score matching, 192 patients were included, 48 with normal-sized ovary and 144 with enlarged-ovarian tumor (Table 1). The mean age of the patients was 58.1±11.0 years in the group with enlarged-ovarian tumor and 58.4±9.2 years in the normal-sized ovary group (p=0.847). There were no significant differences between the 2 groups for stage, residual disease status, initial serum CA-125 level, and American Society of Anesthesiologists (ASA) physical status. Distribution of propensity score and histograms of propensity scores before and after matching are shown in Supplementary Figs. 1 and 2.
At the time of analysis, of the 419 enrolled patients, 298 (71.1%) experienced a relapse, and 192 (45.8%) died after a median observation time of 43 months (range, 3–164 months). In survival analysis of the entire cohort, no significant difference was observed in PFS between the 2 patient groups (p=0.139) (Fig. 1A and Table 2). For OS, however, patients with a normal-sized ovary showed poorer survival outcomes (median OS, 71.2 vs. 41.4 months; p=0.003) (Fig. 1B). In addition, in survival analysis of patients after propensity score matching, patients with a normal-sized ovary still showed poorer survival outcomes for OS (median OS, 72.1 vs. 41.4 months; p=0.031), although there was no statistically significant difference in PFS between the 2 groups (p=0.118) (Fig. 2).
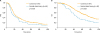 | Fig. 1Kaplan-Meier curve of (A) PFS and (B) OS in all patients.
OS, overall survival; PFS, progression-free survival.
|
Table 2
Normal-sized ovary and survival outcomes (univariate analysis)

![]()
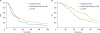 | Fig. 2Kaplan-Meier curve of (A) PFS and (B) OS in patients after propensity score matching.
OS, overall survival; PFS, progression-free survival.
|
In multivariate analysis of clinicopathologic features of OS, normal-sized ovary remained a significant variable in all patients (hazard ratio [HR]=1.593; 95% CI=1.097–2.314; p=0.015) and in patients after propensity score matching (HR=1.578; 95% CI=1.045–2.384; p=0.030), together with residual disease status after PDS (Table 3).
Table 3
Multivariate Cox proportional hazards analysis of PFS and OS to adjust for risk-associated prognostic clinical features
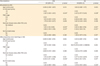
CA-125, cancer antigen-125; CI, confidential interval; FIGO, International Federation of Gynecology and Obstetrics; HR, hazard ratio; OS, overall survival; PDS, primary debulking surgery; PFS, progression-free survival.
*p<0.05.
![]()
DISCUSSION
In this study, we categorized cases with advanced stage serous type EOC according to the presence of normal-sized ovary and demonstrated a statistically significant difference in OS between patients with normal-sized ovary and with enlarged-ovarian tumor in survival comparisons after propensity score matching. In addition, normal-sized ovary remained a significant factor, together with other clinical variables, after multivariate analysis for OS.
Previously, we compared patients with papillary serous carcinoma in ovaries of normal size and those with extraovarian PPC and found no meaningful difference in survival between the 2 patient groups. In the present study, we compared patients with advanced-stage high-grade serous EOC with enlarged-ovarian tumor and with normal ovary size and found a significant difference in OS, but no statistically significant difference in PFS. Although, as a principle, we try to achieve no gross residual lesion after PDS [11], metastatic lesions might not always be removed completely, depending on the circumstances, and there is the possibility of remaining lesions with microinvasion into other organs. However, in the treatment of advanced stage EOC, the ovaries are removed regardless of size. This might explain the lack of a significant difference in PFS between patients with advanced-stage EOC with normal-sized ovary and those with enlarged-ovarian tumor. It can be hypothesized that EOC patients with normal-sized ovary are more likely to be diagnosed late due to the absence of enlargement of the ovaries and, consequently, have a poorer prognosis. However, all patients in our study had advanced-stage disease, and there was no significant difference in disease stage between the 2 groups after propensity score matching. Survival differences were observed after adjusting for disease stage, and normal-sized ovary remained a significant prognostic factor in multivariate analysis. Therefore, other reasons for the survival difference, such as tumor biology and genetic characteristics, need to be analyzed in future studies.
In comparing groups in clinical studies, randomization is the most effective method to acquire a balance of covariates between groups [12]. However, randomized research studies might not be always feasible, due to various factors such as ethical considerations, generalizability, safety, cost, and, especially, a retrospective setting. Multiple regression analysis is a statistical approach to account for confounding variables. However, multivariable regression analysis might not be effective when there are numerous covariates. There might not be sufficient power to demonstrate a statistically significant effect after all adjustments, which could result in misleading data due to over-fitting. Propensity score analysis is a statistical method that can be applied to various clinical studies, and that can effectively adjust for confounders in a retrospective observational study, thus facilitating comparisons between patient groups [13]. Multivariable regression and propensity score matching can result in concordant or discordant results depending on the data. In our study, both multivariate regression and propensity score matching were performed to minimize possible biases.
If the propensity scores of the control group and the treatment group are not similar, there is a disadvantage that data of many groups can be excluded from analysis. Therefore, 1:2 matching has better power than 1:1 matching when the number of subjects between groups is different. It is also known that the increase in power is not significant when the matching is performed at 1:5 or more. In addition, nearest neighbor matching method is known to generally yield the lowest bias, and 1:n matching can be used to increase precision in cohort studies [14]. In the current study, we used a nearest-neighbor 1:3 matching ratio to improve the power of the study.
There are few studies on NOCS, and most of the previous reports in the literature are case series of small numbers without sufficient information [4567]. In a previous analysis of characteristics of patients with NOCS, significant factors for survival were residual disease status after primary surgery and chemosensitivity, which were not different from generally accepted predictive factors of EOC [4]. A comparison of pathological and cytological studies of patients with and without NOCS revealed no differences [6]. Immunohistochemical reactivities of keratin, epithelial membrane antigen, vimentin, and proliferative cell nuclear antigen of both groups were similar, from which we can hypothesize other factors to be involved, such as genetic alteration.
In the present study, we intended to compare differences according to ovary size within serous type EOC, rather than using existing NOCS. The analysis was carried out with pathologically proven serous type EOC only. To our knowledge, this study is the first to show data for a relatively large number of patients with normal-sized ovary of serous type EOC and the first to perform survival comparisons regarding the influence of normal-sized ovary in advanced-stage serous EOC. Factors predictive of prognosis in EOC can play an important role in determining the treatment modality for patients, and the results of our study will contribute to existing prognostic factors in the clinical field [1516].
This study has limitations because of its retrospective nature with a moderate number of patients from a single institution and the lack of detailed medical histories, short-term clinical outcomes, and data on treatments after recurrence that could be related to OS. Racial differences were not considered because patients at our institution are predominantly Asian. Although we analyzed data with propensity matching to reduce selection bias when comparing 2 groups of patients, few variables were included in the propensity score matching. However, adoption of more variables in propensity score matching would have led to difficulties in data analysis due to fewer matched cases.
Our data showed that normal-sized ovary in advanced stage EOC might be related with a poorer outcome for OS in the entire cohort, as well as after propensity score matching. Normal-sized ovary remained a significant prognostic factor for OS in multivariate analysis. These data provide additional information regarding the prognostic significance of normal-sized ovary in advanced serous EOC. However, further analysis of the reasons for the difference in OS is needed to provide greater clarity.
 XML Download