

 PDF
PDF Citation
 Print
Print


INTRODUCTION
Approximately 75% of patients diagnosed with epithelial ovarian cancer have advanced stage disease (International Federation of Gynecology and Obstetrics [FIGO] IIb-IV) [1], resulting in 5-year survival rates of just 17%–36% [2]. Management of advanced stage ovarian cancer consists of surgical cytoreduction and postoperative chemotherapy or neoadjuvant chemotherapy and interval debulking.
Serial measurements of cancer antigen 125 (CA125) are routinely used to monitor tumor response during chemotherapy, survival being correlated with CA125 decline [3]. In surgery the volume of the residual tumor after debulking is known as the most important prognostic factor for survival [45]. However, the definition of residual disease is subjective, as any estimate of residual tumor volume is based on the surgeons’ intraoperative assessment. Two studies exploring the clinical significance of changes in serum CA125 levels during the perioperative period report that a reduction of ≥80% immediately after surgery is an independent prognostic factor for progression-free survival (PFS) [67]. However, studies examining the correlation between the change in perioperative serum CA125 levels and the extent of disease after surgery report conflicting results [891011].
The objectives of the present study were to investigate the relationship between the postoperative decline in serum CA125 levels and the residual tumor volume after primary cytoreductive surgery in patients with advanced stage epithelial ovarian cancer, and to determine the value of perioperative changes in CA125 levels for predicting disease-specific survival.
MATERIALS AND METHODS
1. Study design and sample selection
The medical records of patients with advanced stage (FIGO IIb-IV) epithelial ovarian cancer who were treated with primary cytoreductive surgery followed by adjuvant platinum-taxane based chemotherapy at two university hospitals and one regional teaching hospital in the Southeastern region of the Netherlands between the 1st January, 1996 and the 31st December, 2009, were retrospectively reviewed. Primary debulking surgery was the treatment of choice for patients with advanced stage ovarian cancer. Only when it was estimated that complete or at least optimal (≤1 cm) tumor resection could not be accomplished based on imaging and patient’s performance status, treatment with neoadjuvant chemotherapy followed by interval debulking surgery was chosen. In this study, patients treated with neoadjuvant chemotherapy were excluded. Patients were included if the pre- and postoperative serum CA125 levels were documented and assessed within five weeks up to primary cytoreductive surgery, five weeks postoperatively and before the initiation of adjuvant chemotherapy. Patients were excluded if no data were available regarding pre- and/or postoperative CA125 levels or surgery outcome, or if their preoperative CA125 value was within the normal range (≤35 U/mL).
2. Data collection
The following demographic and clinical data were retrieved from individual medical records and stored in a database: patient and tumor characteristics at primary diagnosis (age, tumor histology and grade, FIGO stage); specified data of the primary surgery (intra-operative volume of ascites, extensiveness of surgery, residual disease after primary surgery as documented by the surgeon); pre- and postoperative serum CA125 level; type of chemotherapy; and follow-up data.
3. Definitions
1) Perioperative changes in CA125 levels
Perioperative changes in serum CA125 levels were calculated as the absolute difference between pre- and postoperative values. To determine the effect of surgery on serum CA125 levels, pre- and postoperative measurements were performed as close to the date of surgery as possible and before the initiation of adjuvant chemotherapy. If more than one serum CA125 level was documented before surgery, the value closest to the date of surgery was used for analyses. When more than one postoperative CA125 value was retrieved from the records (which was the case for 17 patients), the value obtained immediately before the initiation of adjuvant chemotherapy was used. In addition, the percentage reduction in the serum CA125 level was calculated for each patient. In line with previous studies [7], the study population was then categorized into three groups based on changes in serum CA125 levels: ≥80% reduction; 50%–79% reduction; and <50% reduction. Ten patients in whom the serum CA125 level increased postoperatively were included in the latter category.
2) Outcome of cytoreductive surgery
Patients were categorized into three groups according to the presence of residual tumor after primary cytoreduction: complete (no macroscopic evidence of residual tumor); optimal (residual tumor nodule(s), largest diameter ≤1 cm); and incomplete (residual tumor nodule(s), largest diameter >1 cm) [45]. Surgery was defined extensive when bowel, upper-abdominal or, diaphragm resection has been performed.
3) Follow-up
To calculate disease-specific survival, the follow-up time in months was calculated for each patient as follows: the time from the date of primary cytoreductive surgery to the time of cancer-related death (event cases), or the time of the last recorded follow-up visit or death from other cause (censored observations), whichever occurred first.
4. Statistical analysis
Continuous variables were expressed as the mean (IQR, inter quartile range) if normally distributed, or as the geometric mean (CI, confidence interval) if skewed. Categorical data were expressed as percentages. Variables showing a positive skewed distribution (i.e., pre- and postoperative CA125 levels and perioperative reductions in CA125 levels) were loge-transformed prior to further analyses. Multilevel analyses were undertaken to account for differences in survival and CA125 measurements between the three hospitals.
Multilevel linear regression models were used to compare pre- and postoperative and absolute reductions in CA125 levels across the three categories of surgical outcome. Calculations were first performed without adjustment and then again with adjustment for potential confounding factors (age, time between preoperative assessment of CA125 levels and surgery, and time between surgery and postoperative measurement of CA125 levels). A two-level model was used, with random intercepts at the patient and hospital levels, to account for the structure of the data. The chi-squared test was used to compare relative reductions in CA125 levels according to the three categories outlined above (≥80%, 50%–79% and <50% reductions).
Survival estimates for patients showing different levels of CA125 decline were constructed using the Kaplan-Meier method and the data analyzed using the log-rank test. Univariate and multivariate Cox-proportional hazard regression models were used to examine the effects of each potential determinant of CA125 levels. The following variables were included in the different models: percentage reduction in CA125 levels; age at the time of surgery; histology results; tumor grade; FIGO stage; volume of ascites; extent of surgery; and the presence of residual disease after primary surgery. The level of CA125 decline was entered into the above models either as a continuous variable or as a percentage relative to the three categories mentioned above, with a <50% reduction used as the reference level. Graphical examination and testing using Schoenfeld’s residuals confirmed that the proportional hazards assumption of the models had not been violated. In addition, graphical examinations and the use of partial Martingale’s residuals revealed no departure from linearity in the case of continuous variables.
All statistical analyses were performed using the Stata software package, version 13.0 (StataCorp, College Station, TX, USA) and statistical significance was set at p<0.05.
RESULTS
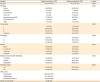
We identified 498 patients with epithelial ovarian cancer. Based on the in- and exclusion criteria, finally 123 patients were enrolled in the study (see flowchart, Fig. 1). The characteristics of both patients included and excluded (based on a lack of data regarding CA125 levels, n=108) are described in Table 1. The geometric mean of the preoperative CA125 concentration was 650 U/mL (95% CI 504–837 U/mL) and the median time from preoperative CA125 sampling to primary surgery was 15 days (range 0–34 days). The median time from surgery to postoperative serum CA125 measurement was 16 days (range 5–34 days) with a geometric mean of 197 U/mL (95% CI 159–243 U/mL).
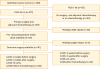
Table 1
Characteristics of the study population
1. Decline in serum CA125 levels and residual tumor volume after primary surgery
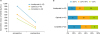
The majority of patients (92%) experienced a decline in serum CA125 levels after surgery. Only ten patients (8%) experienced a postoperative increase in CA125 levels. Comparisons across the three groups of surgery outcome showed that pre- and postoperative serum CA125 levels were both significantly higher in the group of patients with an inadequate outcome of surgery. The height of the serum CA125 levels in the latter group were decreasing linearly across those with optimal and complete cytoreduction (p=0.034 and <0.001 for pre- and postoperative values, respectively) (Table 2, model 1). However, the absolute decline in serum CA125 levels was similar between the three groups (p=0.289) (Table 2, model 1). Indeed, the decline was greater in the inadequate outcome group than in the patients with an optimal or complete outcome (Fig. 2). Adjusting for potential confounders (Table 2, model 2) did not significantly alter these results. When relative declines in serum CA125 levels were cross-tabulated with surgical outcome, a significant trend towards greater declines in those with a better surgical outcome was found (p=0.035) (Fig. 2).
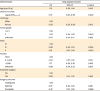
Table 2
Comparisons of levels of perioperative CA125 by category of surgery outcome
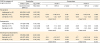
Model 1, crude (i.e. unadjusted); Model 2, adjusted for potential confounders (i.e. patient’s age and time elapsed between preoperative CA125 assessment and surgery in comparisons of preoperative CA125; time between surgery and postoperative CA125 assessment in comparisons of postoperative CA125; both times in comparisons of perioperative decline in CA125). ß is the regression coefficient indicating the difference in preoperative CA125, postoperative CA125 and perioperative decline in (pre-post) CA125 in complete or optimal versus inadequate (referent) groups; note that because comparisons were performed on loge CA125 data the regression coefficient may need to be back transformed (by taking the anti-log of ß) for a more direct interpretation of the magnitude of the differences, which will then be expressed in percentage difference, i.e. (eß-1)*100; for instance, a ß of −0.40 indicates that the preoperative CA levels were 33% lower in the optimal vs. the inadequate groups.
SD, standard deviation; CI, confidence interval.
2. Decline in serum CA125 levels and disease-specific survival
The median follow-up time was 31 months (range 0–178 months). During the course of follow-up 75 of the 123 patients died (68 of whom due to disease-specific causes). Kaplan-Meier survival curves showed an increased mortality risk in patients with a lower relative decline in serum CA125 (p=0.002) (Fig. 3). Specifically, HR50%–79%=0.59 (95% CI: 0.34–1.05) and HR≥80%=0.35 (0.19–0.67) vs. the referent <50% (Table 3, model 1). Likewise, survival was linked to improved surgical outcome (HRoptimal=0.70 [0.41–1.20] and HRcomplete=0.35 [0.17–0.71] vs. the group of patients with an inadequate outcome of surgery [p=0.003]). Adjustments for age (Table 3, model 2) had no effect on these estimates. Multivariate Cox regression analysis, which included categories of serum CA125 decline and surgical outcome and also all other prognostic factors for survival as mentioned above as variables, identified only the decline in serum CA125 but not the outcome of surgery, as being significantly associated with better survival (HR50%–79%=0.52 [95% CI: 0.28–0.96] and HR≥80%=0.26 [95% CI: 0.13–0.54] vs. the serum CA125 decline of <50%; p<0.001) (Table 3, model 3). The same patterns of association were observed when reductions in CA125 levels were expressed on a continuous absolute scale rather than as categories of change in percentages (p=0.003) (Table 4).
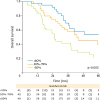
Table 3
Determinants of disease specific mortality
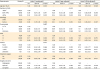
Model 1, crude (i.e. unadjusted); Model 2, adjusted for age; Model 3, fully adjusted model (i.e. model 2 + all determinants considered).
HR, hazard ratio (vs. referent category as indicated by HR=1.00); CI, confidence interval; FIGO, International Federation of Gynecology and Obstetrics.
*Includes 10 patients in whom no changes or slight increases in CA125 were observed between pre- and postoperative.
Table 4
Determinants of disease specific mortality
Crude and age-adjusted values of HR (95% CI) for perioperative decline in CA125 were 0.91 (0.78, 1.06) and 0.82 (0.66, 1.02), respectively; All analyses were conducted within hospital strata to account for the clustering of patients within hospitals (n=3).
HR, hazard ratio (vs. referent category as indicated by HR=1.00); CI, confidence interval; FIGO, International Federation of Gynecology and Obstetrics.
DISCUSSION
The results reported suggest that perioperative changes in serum CA125 level is an early biomarker for predicting disease-specific survival in patients that have undergone cytoreductive surgery. After controlling for known prognostic factors, the relationship between changes in perioperative serum CA125 levels and disease-specific survival had greater prognostic value than the level of residual disease after primary surgery.
These findings are in agreement with those reported by others. Yoo et al. [6] reported that a ≥75% decline in serum CA125 levels was an independent prognostic factor for progression-free survival [11]. Zivanovic et al. [7] combined the decline of serum CA125 with the result of debulking surgery and showed that optimally debulked patients in the “high decline” group (≥80% reduction in CA125 levels) were at lower risk of recurrence than patients with a smaller decline. The multivariate analysis performed by Zivanovic et al. [7] also showed that disease-specific survival had greater prognostic value than the level of residual disease after primary surgery, although they placed little emphasis on this in their report.
Our study confirmed the results of previous reports showing that the outcome of debulking surgery is correlated with disease specific survival [45]. Complete debulking surgery showed an improved disease specific survival when compared to inadequate debulking (HR=0.34, p=0.003). Although not significant, optimal debulking was also related to improved survival (HR=0.70, p=0.201) when compared to inadequate debulking. The fact that the latter was not significant is likely due to the small number of patients assessed in our study. When correlating the changes in perioperative CA125 levels and the outcome of surgery, we found a linear association between the categories of relative perioperative CA125 decline and the outcome of surgery (p=0.035). However, when comparing absolute levels of CA125 decline, this relationship was no longer apparent. The different results obtained when expressing changes in serum CA125 levels on a continuous scale or in relative terms can be explained by the fact that the latter values are inversely associated with the baseline values. In other words, for patients with higher baseline values, any absolute reduction in CA125 levels will always be associated with a lower percentage reduction. Previous studies also showed a relationship between postoperative declines in serum CA125 levels and the level of residual disease after surgery. Rosen et al. [8] found that serum CA125 levels are related to the amount of remaining tumor tissue, and Brand and Lidor [9] and Gadducci et al. [11] reported a greater decline in postoperative CA125 levels in patients with small residual tumors than in those with bulky residual disease. Yedema et al. [10] also examined perioperative changes in serum CA125 levels, but reported the opposite result. The discord between these studies is most obviously explained by differences in the way in which serum CA125 levels were expressed: as absolute levels or in relative terms. Yedema et al. [10] expressed reductions in serum CA125 levels on a continuous absolute scale. When we performed our analyses this way, we either did not found a relationship.
It is worth noting that three of the patients examined in this study showed an increase in CA125 levels after complete cytoreduction. Thus, we agree with Gadducci et al. [11] when they state that a reduction in antigen levels after surgery makes it difficult to predict the amount of residual disease with any accuracy. Nevertheless, we have to realize that intra-abdominal cytoreduction does not account for extra-abdominal tumor remnants. Furthermore, the group of patients with an optimal debulking includes patients with 1 macroscopical tumor spot <1 cm as well as patients with 1,000 of these spots as is the case in some patients with peritoneal carcinomatosis. Finally, the surgeons’ intraoperative assessment of the amount of residual disease is subjective. Indeed, Préfontaine et al. [12] reported significant measurement errors and low inter-observer reliability. They concluded that most surgeons underestimated rather than overestimated the diameter of residual tumors. Chi et al. [13] and Lakhman et al. [14] identified tumors with a diameter greater than 1 cm on CT in almost half of patients deemed to have an optimal outcome after primary surgery. However, postoperative CT does not provide a truly objective assessment.
The present study has several limitations. The first is its retrospective nature. A second is that different assays were used to measure serum CA125 levels in the three hospitals. A third is that around 50% of the initial study population was excluded (n=108) due to a lack of data regarding CA125 levels. Some characteristics of these patients differ from the patients included that may be seen as a potential selection bias. The excluded patients had significantly more non-serous histology and less advanced stage disease. This could mean that our findings should be restricted to EOC (epithelial ovarian cancer) with serous histology and more advanced stage. A fourth is that serum CA125 levels were measured in different postoperative weeks (range 0–5 weeks), which may have influenced the rate of postoperative decline. However, we used a linear regression model to adjust for the potential confounding effects. Despite this, the fact that CA125 levels were measured at different times can still be regarded as a weakness. Indeed, the peritoneum normally forms a barrier to CA125 transport [15], and incision of the peritoneum leads to the release of CA125 into the peritoneal fluid. Thus, peritoneal trauma may cause CA125 release [16], and manipulation of the tumor during surgery may lead to increased shedding of CA125 into the circulation as remaining barriers between tumor and surrounding tissue are disturbed [17]. The removal of tumors and ascites from patients with ovarian cancer leads to a reduction in serum CA125 levels, whereas peritoneal trauma caused by the surgical procedure does the opposite. Evidence suggests that postoperative CA125 levels increase after incision and healing of the peritoneum via de novo synthesis [18]. This increase may mask any decline in perioperative CA125 levels after the removal of tumor tissue and ultimately cause an increase in serum postoperative CA125 levels, as observed in ten of the patients examined in this study. Van der Zee et al. [19] examined the effect of abdominal surgery on serum CA125 levels by measuring postoperative levels in 84 patients with normal preoperative CA125 values (≤16 U/mL) who had malignant and non-malignant disease. The highest level measured in patients who underwent aortic surgery was 215 U/mL (on postoperative day 7). The antigen levels in the entire study population increased from day 3, reaching a maximum on days 7 to 14 before gradually declining to preoperative levels within 8 weeks. If performed prospectively, CA125 measurements should be done at regular intervals up until the start of chemotherapy, and values in different patients should be measured at the same time. In addition, a cutoff preoperative serum CA125 level should be defined and used as a criterion for inclusion in any study. In the present study, only ten patients (8%) showed a postoperative increase in CA125 levels, eight of whom did have a preoperative serum CA125 level <200 U/mL.
In conclusion, the volume of residual tumor after debulking is known as the most important prognostic factor for survival, but it’s intraoperative assessment is rather subjective. We have identified a relationship between the perioperative relative change in CA125 levels and the amount of residual tumor remaining after primary cytoreductive surgery. Less residual tumor was associated with a greater relative decline in serum CA125 levels. Perioperative changes in serum CA125 levels were also associated with disease-specific survival and were a stronger predictor than the estimated amount of cytoreduction at surgery. A decline of ≥80% resulted in an almost 4-fold increase in survival to all patients with advanced stage epithelial ovarian cancer who were treated with primary debulking surgery and adjuvant chemotherapy. If confirmed by prospective studies, the perioperative change in serum CA125 level in response to cytoreductive surgery enables predicting disease-specific survival more specific than the surgeons’ estimation of the residual tumor volume.
 XML Download