

 PDF
PDF Citation
 Print
Print


INTRODUCTION
Despite advances in prevention and early detection, cervical cancer is the most common gynecological cancer worldwide and a public health problem [1]. The type of treatment for cervical cancer depends on the stage of the disease, and different treatment groups with curative intent have been established. According to the classification of the International Federation of Gynecology and Obstetrics (FIGO), stages between IB2 and IVA are defined as locally advanced cervical cancer (LACC) [23]. For this group of patients, treatment is based on a combination of radiotherapy and cytostatics [45], and this regimen has been recommended by the National Cancer Institute (of USA) since 1999 [67]. Changes in therapy should be based on clinical trials that clearly show the effectiveness and prognosis of therapies. Specifically, in a woman newly diagnosed with LACC, the disease is expected to evolve as described in previous studies for each patient's group. Stratified medicine is used to identify groups of women with similar characteristics who may benefit from additional treatments or women who are at a lower risk inherent to the treatment [8]. This method allows the practitioner to orient the therapy and make the best decisions, and it can even be used to improve the design and analysis of randomized therapeutic trials [9].
A prognostic model is a mathematical procedure that estimates the absolute probability of risk for a specific outcome in an individual at a given time by combining different types of information (predictors) on the patient [91011]. Risk stratification can be accomplished based on the probability of absolute risk [812]. To be useful, a predictive model must be clinically credible, accurate, valid anywhere, and provide relevant information for daily clinical practice [10]. In fact, prognostic model is not beneficial if it cannot be generalized or does not influence the physician's behavior [13]. Currently, multiple prognostic models have been developed for LACC in which the outcome measures are predicted in time-dependent manner [14151617181920212223]. However, few prognostic models described to date have been independently validated [172425], which is a necessary condition for their clinical use [10]. The aim of this study was to externally validate the prognostic models for predicting the time-dependent outcome in patients with LACC and who were treated with concurrent chemoradiotherapy in an independent cohort.
MATERIALS AND METHODS
1. Review of the scientific literature
A review of the literature was performed to identify publications in which prognostic models were developed to quantify the probability of a time-dependent outcome (mortality, cause-specific mortality, disease-free survival [DFS], or loco-regional failure) in women with LACC, some or all of whom had received chemoradiotherapy. Articles in which the prognostic models were based on omics data were excluded. The search strategy is detailed in Supplementary 1. The articles were first selected by title and included after reading the entire article.
2. Patient cohort for external validation
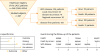
A historical cohort of 346 patients with LACC (FIGO IB1–IVA) diagnosed between July 1999 and September 2014 at the Department of Radiation Oncology of the 12 de Octubre University Hospital (H12O) was examined (Fig. 1). Forty-nine patients were excluded because of the following reasons; 12 had metastatic disease at diagnosis, 5 harbored another synchronous tumor, 6 were pregnant, 6 were positive for human immunodeficiency virus (HIV), 6 had received induction chemotherapy, 10 lacked a health insurance plan to cover cisplatin-based therapy, and 4 exhibited histology that indicated undifferentiated carcinoma. The final study population consisted of 297 patients who were treated with radical-intent chemoradiotherapy.
3. Diagnosis, treatment, and monitoring
All patients were subjected to the following tests: a complete physical checkup, hemogram, biochemistry, squamous cell carcinoma antigen (SCC-Ag) levels and cytokeratin fragment 19 (CYFRA 21-1), chest radiography, and a loco-regional disease study with pelvic computed tomography (CT) and magnetic resonance imaging (MRI). Since 2009, the CT has been replaced by a whole-body positron emission tomography (PET) CT for staging and radiotherapy treatment planning. A para-aortic lymphadenectomy for staging was performed in patients with negative PET-CT. If infiltration to the adjacent organs or a tumor stage >IIB was suspected, the study was completed with a cystoscopy/rectoscopy.
Treatment consisted of 3-dimensional (3D) external beam radiation of the pelvis or pelvis and para-aortic region if the tumor was bulky and/or stage≥IIB and/or lymph nodes involvement. If pathological nodes were >1.5 cm on PET-CT, a simultaneously integrated boost of 55 Gy was performed. Concurrently, the patients received weekly 40 mg/m2 of cisplatin. Subsequently, they underwent brachytherapy, first with a low-rate dose up to 2007 and then with a high-rate dose.
Patients were evaluated every 3 months in the first 2 years, every 6 months for the subsequent 3 years and then annually. Every 6 months for the first 5 years and once a year thereafter, they underwent chest radiography and abdominopelvic CT or PET-CT, as appropriate. The monitoring period of patients for this study ended in March 2015.
4. Information processing
The study was submitted to the Ethics Committee for Clinical Research (ECCR) of H12O (No. CEIC: 15/210) and received a favorable report. The study was carried out in accordance with the ethical principles of the Helsinki Declaration and the Basic Law of Data Protection—Data Protection Act 15/1999.
5. External validation
The following outcomes were evaluated: 1) all-cause mortality after 1, 3, and 5 years; 2) mortality due to cancer after 3 and 5 years; 3) disease recurrence after 1, 2, 3, and 4 years; 4) distant metastasis after 5 years; and 5) para-aortic metastasis after 4 years (Fig. 1).
The data of patients at diagnosis in the validation sample were recoded and homogenized for comparison with the development samples and their use in the models. Lymph node involvement (negative, pelvic, or para-aortic with or without pelvic lymph node involvement) generated the following variables: pelvic lymph node (negative or positive) [161720], para-aortic node (negative or positive) [1417] and major lymph node involvement (negative, pelvic, para-aortic, or supraclavicular) [19]; the variable “nationality” was used to infer race [20]. No method for the imputation of missing data was used. The risk estimate for each individual was obtained using online calculators [1718] or nomograms [26].
The predictive ability of the models was evaluated based on discrimination, calibration, measures of overall performance, and decision curve analysis [112627]. Discrimination describes the ability of prognostic model to distinguish between patients with and those without the outcome. Discrimination ability was estimated with the area under the receiver operating characteristic curve (AUROC) and graphed the sensitivity against 1-specificity for consecutive cutoffs for the predicted probability of an outcome. An AUROC value of 0.5 represents chance and 1 represents perfect discrimination. Calibration refers to the agreement between observed and predicted probability. Calibration of models was assessed graphically and estimated with the intercept and slope calibration. In case of perfect fit of the model to the data, calibration intercept is equal to 0 and slope equal to 1. Measures of overall performance was Nagelkerke R2, the amount of variability in outcomes that is explained by the prediction model, and Brier score, performance measure for the distance between observed and predicted outcome. Decision curve analysis [2627] offers insight into clinical consequences by determining the relationship between a chosen predicted probability threshold and the relative value of false-positive and false-negative results to obtain a value of net benefit of using the model at that threshold. This net benefit is compared with the net benefit strategies of assuming that all or no patient have outcome. The optimal strategy is that with the highest clinical net benefit. Therefore, the threshold of clinical utility (TCU) of a prognostic model is the region where the net benefit of a prognostic model is superior to the net benefit of the strategies of assuming that all or no patients have outcome.
The confidence intervals (CIs) [28] for the evaluation measures were estimated using the bootstrapping technique, simulating 1,000 samples with 297 subjects, as in the external sample. The rms and boot R packages were used (R Foundation, Vienna, Austria; https://www.R-project.org) [29].
RESULTS
1. Description of studies
A total of 203 articles were identified by title. After complete reading, 8 articles were selected (Supplementary 2) that described studies in which all or part of the LACC patient cohort was treated with concurrent chemoradiotherapy (Fig. 2).
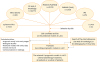 | Fig. 2Search flow.
IBECS, Índice Bibliográfico Español en Ciencias de la Salud; IME, Índice Médico Español; ISCIII, Instituto de Salud Carlos III; ISI, Institute for Scientific Information; LACC, locally advanced cervical cancer; LILACS, Literatura Latino Americana e do Caribe em Ciências da Saúde.
|
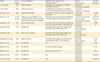
The 8 selected articles included a total of 14 prognostic models, and 13 of these models (Table 1) predict time-dependent events: 2 predict overall survival [OS], 5 predict cause-specific survival [CSS], 3 predict DFS, 2 predict distant recurrence, and 1 predicts para-aortic recurrence. The model of Rose et al. [20] was excluded because it was developed to predict pelvic recurrence at any time. The risk factors considered in the models are described in Supplementary 3.
Table 1
Prognostic models of LACC
| Author | No. of subjects | Outcome definition | Definition of the elapsed time until the outcome | Type of model and tool | ROC area calibration |
|---|---|---|---|---|---|
| Li et al. [30] | 300 | Death by cancer | Period from the completion of treatment until death by cancer | Cox model | - |
| (stratification 3 groups) | |||||
| Li et al. [30] | 300 | Distant recurrence | Period from the completion of treatment until the first diagnosis of distant recurrence | Cox model | - |
| (stratification 3 groups) | |||||
| Shim et al. [14] | 209 | Cause-specific death | Period from the onset of chemoradiotherapy until death | Cox model | 0.690 |
| Nomogram | CG | ||||
| Kang et al. [17] | D: 434 | Distant recurrence defined as the recurrence of the tumor in a location outside the pelvic field of irradiation | Period from the onset of chemoradiotherapy until the first diagnosis of distant recurrence | Competitive risk model | D: 0.700 |
| EV: 115 | Web-nomogram | EV: 0.730 | |||
| (stratification 3 groups) | CG | ||||
| Tseng et al. [15] | 251 | Cause-specific death | Period from the onset of chemoradiotherapy until cause-specific death or last follow-up | Cox model | 0.690 |
| Nomogram | CG | ||||
| Liang et al. [16] | 148 | Disease-free | Period from the onset of the therapy until the final version of the manuscript | Cox model | - |
| Risk stratification | |||||
| (2 groups) | |||||
| Liang et al. [16] | 148 | Para-aortic recurrence | Period from the onset of the therapy until the final version of the manuscript | Cox model | - |
| Risk stratification | |||||
| (2 groups) | |||||
| Polterauer et al. [18] | 528 | Death by cancer | Period from the diagnosis until the date of cause-specific death or last follow-up | Cox model | 0.723 |
| Web-nomogram | CG | ||||
| Kidd et al. [19] | 234 | Not defined | OS | Cox model | 0.658 |
| Nomogram | |||||
| Kidd et al. [19] | 234 | Not defined | Survival to specific disease | Cox model | 0.739 |
| Nomogram | |||||
| Kidd et al. [19] | 234 | Not defined | Recurrence-free survival | Cox model | 0.741 |
| Nomogram | |||||
| Rose et al. [20] | 2,041 | Not defined | OS | Cox model | 0.640/CG |
| Nomogram | |||||
| Rose et al. [20] | 2,041 | Not defined | DFS | Cox model | 0.620/CG |
| Nomogram |
CG, calibration graphic; D, the development sample of prognostic model; DFS, disease-free survival; EV, the external sample of prognostic model; LACC, locally advanced cervical cancer; ROC, receiver operating characteristic; OS, overall survival.
![]()
2. External validation
During follow-up, 93 of 297 died, corresponding to a 5-year OS of 70% (95% CI=65%–76%); 82 patients died due to disease, resulting in a CSS of 71% (95% CI=65%–76%); and 104 women experienced disease recurrence during follow-up, which equates to a 5-year DFS of 64% (95% CI=58%–70%). The reverse Kaplan-Meier estimate of the median follow-up period was 79 months (95% CI=71–89 months).
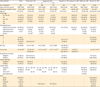
Table 2 shows the characteristics of the patients included in the database for development and validation. The data from Li et al. [30] and Polterauer et al. [18] are not presented because of lacking the variables volume, diameter, and number of affected lymph nodes. They also were not externally validated. The H12O cohort was homogeneous compared to women from other cohorts in terms of age (average age of 50), histological type (over 79% were squamous cell) and Eastern Cooperative Oncology Group (ECOG) scale frequency. However, the FIGO stages of patients from the validation cohort (49% of patients with FIGO IIIA, IIIB, and IVA staging) and Tseng et al. [15] cohort (46%) significantly differed from those of other cohorts (40% maximum) (p<0.050). Furthermore, the involvement of the parametrium also differed between cohorts (78% in the H12O cohort compared to 87% in the cohorts of Shim et al. [14] and Tseng et al. [15]). The percentage of women with hydronephrosis (15%) was similar between all cohorts except for that reported Tseng et al. [15] (36%, p<0.001). The locations of positive nodes in the Kidd et al. [19], Shim et al. [14], and Kang et al. [17] cohorts exceeded 45% and significantly differed from that in the H12O cohort, which was 28%. The race was dependent on the region where the study was conducted. Additionally, Supplementary 4 shows the re-estimated regression coefficients of prognostic variables for OS, CSS, and DFS in validation cohort. The re-estimated prognostic factors in validation samples (FIGO stage, ECOG scale, SCC-Ag, tumor size, parametrium invasion, hydronephrosis, lymph node, and race) were associated with reduction in OS and CSS. ECOG scale had impact on the incidence of the all-cause mortality, mortality due to cancer and disease recurrence.
Table 2
Patient characteristics and clinicopathological variable
| Characteristic | H12O | Shim et al. [14] | Kang et al. [17] | Tseng et al. [15] | Liang et al. [16] | Kidd et al. [19] | Rose et al. [20] | |||||
|---|---|---|---|---|---|---|---|---|---|---|---|---|
| D | EV | |||||||||||
| No. of subjects | 297 | 209 | 434 | 115 | 251 | 148 | 234 | 2,041 | ||||
| Data collection period | 1999–2014 | 1998–2008 | 2001–2009 | 2001–2009 | 1999–2006 | 2001–2006 | 1998–2008 | 1986–2009 | ||||
| Follow up duration (mon) | 79 (71–89)* | 51 (6–151)† | 49 (1–114)‡ | 42 (10–92)‡ | 75.6† | 49 (19–89)† | 41 (5–125)‡ | 28–105§ | ||||
| Age (yr) | 53.9 (13.1) | 55 (26–78) | 54 (27–78) | 54 (32–77) | 48.6 (9.3) | 54 (31–76) | 52 (24–94) | 46.6 (39.0–55.9) | ||||
| FIGO stage | ||||||||||||
| IA1–IA2 | - | - | - | - | - | - | - | - | ||||
| IB1–IB2–IIA | 58 (19.5) | 25 (12.0) | 72 (16.6)ǁ | 8 (7.0)ǁ | - | 28 (19.0)ǁ | 70 (29.9) | 433 (21.2) | ||||
| IIB | 95 (32.0) | 129 (61.7) | 274 (63.1) | 71 (62.8) | 133 (53.0) | 83 (56.1) | 102 (43.6) | 960 (47.0) | ||||
| IIIA–IIIB | 124 (41.8) | 45 (21.5) | 70 (16.1) | 26 (22.6) | 94 (37.5) | 34 (23.0) | 59 (25.2) | 589 (28.8) | ||||
| IVA | 20 (6.7) | 10 (4.8) | 18 (4.2) | 10 (8.7) | 24 (9.5) | 3 (2.0) | 3 (1.2) | 60 (2.9) | ||||
| IVB | - | - | - | - | - | - | - | - | ||||
| Histological type | ||||||||||||
| Squamous carcinoma | 247 (83.2) | 190 (90.8) | 385 (88.7) | 106 (92.2) | 251 (100.0) | 135 (91.2) | 207 (88.0) | 1,811 (88.7) | ||||
| Adenocarcinoma | 45 (15.2) | 13 (6.2) | 29 (6.7) | 4 (3.5) | - | 13 (8.8) | 16 (7.0) | 114 (5.6) | ||||
| Adenosquamous | 5 (1.7) | 4 (1.9) | 17 (3.9) | 2 (1.7) | - | - | 4 (2.0) | 117 (5.7) | ||||
| Others | - | 2 (1.0)¶ | 3 (0.7) | 3 (2.6) | - | - | 7 (3.0) | - | ||||
| ECOG | ||||||||||||
| 0 | 24 (8.1) | - | - | - | - | - | - | 1,473 (72.1) | ||||
| 1 | 227 (76.4) | - | - | - | 179 (71.3)[<2] | - | - | 503 (24.6) | ||||
| 2 | 37 (12.5) | 209 (100.0)[<3] | - | - | 72 (28.7) | - | - | 66 (3.2) | ||||
| 3 | 9 (3.0) | - | - | - | - | - | - | - | ||||
| SCC-Ag | 17.1 (33.6) | 6.4 (0–319) | 4.9 (0–395) | 8.3 (0–402) | 168 (66.8)[<5] | - | - | - | ||||
| 83 (33.0)[≥5] | ||||||||||||
| Tumor size | 5.9 (14.6)** | 75 (36.0)[<4] | 4.5 (1.6–9.0)** | 5.5 (1.5–9.5)** | 49 (19.5)[<4] | 11 (7.0)[<4] | - | 6.0 (5.0–7.0)** | ||||
| 134 (64.0)[≥4] | 202 (80.5)[≥4] | 137(93.0)[≥4] | ||||||||||
| Parametrium invasion | ||||||||||||
| Negative | 65 (21.9) | PET: 28 (13.4) | - | - | 33 (13.1) | - | - | 477 (23.4) | ||||
| Positive | 232 (78.1) | PET: 181 (86.8) | - | - | 218 (86.8) | - | - | 1,565 (76.6) | ||||
| Hidronephrosis | ||||||||||||
| Negative | 245 (82.5) | 174 (83.3) | - | - | 160 (63.7) | - | - | 1,490 (89.2) | ||||
| Positive | 52 (17.5) | 35 (16.7) | - | - | 91 (36.3) | - | - | 181 (10.9) | ||||
| Lymph node | ||||||||||||
| Negative | 166 (55.9) | (1): 111 | (2): 180 | (1): 174 | (2): 346 | (1): 56 | (2): 90 | 142 (56.6) | - | 109 (47.0) | 1,285 (62.9) | |
| Pelvic | 83 (28.0) | (1): 98 | - | (1): 260 | - | (1): 59 | - | 71 (28.3) | - | 125 (53.0) | 286 (14.0) | |
| Para-aortic | 48 (16.2) | - | (2): 29 | - | (2): 88 | - | (2): 25 | 38 (15.1) | - | 41 (18.0) | - | |
| Supraclavicular | - | - | - | - | - | - | - | - | - | 10 (4.0) | - | |
| Race | ||||||||||||
| White | 236 (79.7) | - | - | - | - | - | - | 1,242 (60.8) | ||||
| Black | 7 (2.4) | - | - | - | - | - | - | 459 (22.5) | ||||
| Hispanic | 45 (15.2) | - | - | - | - | - | - | 210 (10.3) | ||||
| Asian | 2 (0.7) | - | 434 (100.0) | 115 (100.0) | - | - | - | 75 (3.7) | ||||
| Others | 6 (2.0) | - | - | - | - | - | - | 56 (2.7) | ||||
CI, confidence interval; D, the development sample of prognostic model; ECOG, Eastern Cooperative Oncology Group; EV, the external sample of prognostic model; FIGO, International Federation of Gynecology and Obstetrics; H12O, 12 de Octubre University Hospital; PET, positron emission tomography; SCC-Ag, squamous cell carcinoma antigen.
*The reverse Kaplan-Meier estimate of the median follow-up period and 95% CI; †The median follow-up period and range; ‡The median survival follow-up time of the censored patients and range; §Length of follow-up period of patients († or ‡) enrolled onto clinical trials; ǁInclude bulky category; ¶Small cells; **Continuos variable: mean (standard desviation), mean (minimum–maximum), or median (interquartile range).
![]()
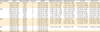
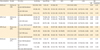
The external validation of the prognostic models at specific time points and the evaluation of the stratification model proposed by Kang et al. [17] are shown in Table 3. The following models were statistically valid: 1) the OS model from Kidd et al. [19] at 3 years with an AUROC=0.69; 2) the DFS models from Kidd et al. [19] at 1 year (AUROC=0.64) and from Rose et al. [20] at 2 years (AUROC=0.70); and 3) the model of distant recurrence by Kang et al. [17] at 5 years (AUROC=0.67). The previous models exhibited good calibration, the CIs of calibration intercept containing to 0 and the CIs of calibration slope to 1. In terms of clinical validity, the analysis of the decision curve showed that the TCU of the OS model at 3 years developed by Kidd et al. [19] ranged from 36% to 50%. The TCU of the DFS model at 1 year from Kidd et al. [19] ranged from 24% to 32% and that of the DFS model at 2 years from Rose et al. [20] ranged from 19% to 58%. The TCU of the model of distant recurrence at 5 years from Kang et al. [17] ranged from 12% to 36%. Box plots of predicted probabilities for patients without and with event, ROC curve with predicted probabilities closest to indifferent thresholds, calibration plot and decision curves of the prognostic models are showed in Supplementary 5. The indifferent thresholds for the choice between to determine all patients as positive for an outcome and to classify patients as positive or negative using a model (net benefit [NB] all=NB threshold), all patients as positive for an outcome and all patients as negative for an outcome (NB all=NB none), and to classify patients as positive or negative using a model and all patients as negative for an outcome (NB threshold=NB none) are characterized in Table 4.
Table 3
External validation measures of prognostic models for LACC
| Characteristic | Model | Outcome/Total | Time (yr) | AUROC | Calibration intercept | Calibration slope | R2N (%) | Brier score |
|---|---|---|---|---|---|---|---|---|
| OS | Rose et al. [20] | 80/216 | 5 | 0.66 (0.59, 0.74) | −0.72 (−1.04, −0.43) | 0.82 (0.43, 1.25) | 10.40 (3.01, 20.71) | 0.21 (0.19, 0.23) |
| Kidd et al. [19] | 9/92 | 1 | 0.67 (0.48, 0.86) | −0.17 (−2.95, 2.32) | 1.01 (−0.30, 2.32) | 5.24 (0.00, 16.82) | 0.09 (0.04, 0.14) | |
| Kidd et al. [19] | 21/53 | 3 | 0.69 (0.54, 0.84) | 0.23 (−0.81, 1.38) | 0.88 (−0.30, 2.17) | 5.32 (0.00, 30.54) | 0.23 (0.20, 0.28) | |
| CSS | Shim et al. [14] | 69/240 | 3 | 0.52 (0.45, 0.60) | −0.89 (−1.44, −0.41) | 0.01 (−0.36, 0.37) | 0.01 (0.00, 0.30) | 0.20 (0.18, 0.23) |
| Shim et al. [14] | 76/213 | 5 | 0.55 (0.47, 0.63) | −0.49 (−0.86, −0.12) | 0.13 (−0.18, 0.53) | 0.39 (0.00, 5.11) | 0.23 (0.21, 0.24) | |
| Tseng et al. [15] | 75/211 | 5 | 0.64 (0.57, 0.72) | −1.30 (−1.94, −0.83) | 0.98 (0.51, 1.66) | 8.59 (1.78, 18.42) | 0.21 (0.19, 0.23) | |
| Kidd et al. [19] | 9/92 | 1 | 0.60 (0.38, 0.82) | −1.37 (−3.66, 0.77) | 0.38 (−0.55, 1.42) | 1.44 (0.00, 17.87) | 0.09 (0.04, 0.14) | |
| Kidd et al. [19] | 20/52 | 3 | 0.58 (0.41, 0.75) | −0.04 (−1.21, 1.14) | 0.31 (−0.43, 1.07) | 1.83 (0.00, 24.87) | 0.23 (0.17, 0.25) | |
| DFS | Rose et al. [20] | 87/264 | 2 | 0.70 (0.63, 0.76) | −0.25 (−0.59, 0.09) | 1.19 (0.75, 1.71) | 14.42 (6.02, 25.17) | 0.20 (0.17, 0.22) |
| Kidd et al. [19] | 26/93 | 1 | 0.64 (0.51, 0.76) | −0.24 (−1.24, 0.82) | 0.57 (−0.12, 1.33) | 4.17 (0.00, 18.27) | 0.20 (0.15, 0.23) | |
| Kidd et al. [19] | 32/58 | 3 | 0.60 (0.45, 0.73) | 0.32 (−0.27, 1.34) | 0.26 (−0.41, 1.45) | 1.23 (0.00, 17.73) | 0.24 (0.20, 0.25) | |
| Liang et al. [16] | 99/236 | 4 | 0.64 (0.59, 0.70) | - | - | - | - | |
| Rd | Kang et al. [17] | 38/163 | 5 | 0.67 (0.58, 0.77) | 0.25 (−0.67, 1.39) | 1.00 (0.34, 1.73) | 7.77 (1.03, 19.64) | 0.17 (0.13, 0.20) |
| Kang et al. [17] | 38/163 | 5 | 0.63 (0.54, 0.72) | - | - | - | - | |
| Rp | Liang et al. [16] | 18/155 | 4 | 0.58 (0.46, 0.69) | - | - | - | - |
The cells show the estimate value and 95% CIs bootstrap estimate value using normal approximation.
AUROC, area under the receiver operating characteristic curve; CI, confidence interval; CSS, cause-specific survival; DFS, disease-free survival; LACC, locally advanced cervical cancer; OS, overall survival; Rd, distant recurrence; Rp, para-aortic recurrence.
![]()
Table 4
Probability threshold of decision curve analysis
| Characteristic | Model | TCU (%) | Sensitivity | Specificity | PPV | NPV | LRP | LRN | NB | |
|---|---|---|---|---|---|---|---|---|---|---|
| All | Threshold | |||||||||
| OS (3 yr) | Kidd et al. [19] | 24 | 100 (100, 100) | 0 (0, 0) | 40 (26, 53) | - | 1.00 (1.00, 1.00) | - | 0.21 | 0.21 |
| NB all=NB threshold | ||||||||||
| 30 | 48 (26, 69) | 78 (64, 92) | 59 (35, 82) | 69 (54, 84) | 2.17 (0.98, 4.81) | 0.67 (0.43, 1.05) | 0.00 | 0.14 | ||
| NB all=NB none | ||||||||||
| 50 | 24 (6, 42) | 88 (79, 99) | 56 (23, 88) | 63 (49, 78) | 1.90 (0.58, 6.29) | 0.87 (0.66, 1.14) | −0.16 | 0.00 | ||
| NB none=NB threshold | ||||||||||
| DFS (1 yr) | Kidd et al. [19] | 24 | 38 (20, 57) | 79 (69, 89) | 42 (22, 61) | 77 (67, 87) | 1.84 (0.94, 3.61) | 0.78 (0.56, 1.08) | 0.06 | 0.06 |
| 25 | 35 (16, 53) | 81 (71, 90) | 41 (20, 61) | 76 (66, 86) | 1.78 (0.87, 3.66) | 0.81 (0.60, 1.10) | 0.04 | 0.05 | ||
| NB all=NB none | ||||||||||
| 32 | 19 (4, 34) | 84 (75, 92) | 31 (9, 54) | 73 (63, 83) | 1.17 (0.45, 3.04) | 0.97 (0.78, 1.20) | −0.06 | 0.00 | ||
| NB none=NB threshold | ||||||||||
| DFS (2 yr) | Rose et al. [20] | 19 | 99 (97, 100) | 3 (1, 6) | 33 (27, 39) | 86 (60, 100) | 1.02 (0.99, 1.06) | 0.35 (0.04, 2.84) | 0.16 | 0.16 |
| NB all=NB threshold | ||||||||||
| 33 | 82 (74, 90) | 42 (35, 50) | 41 (33, 48) | 83 (76;91) | 1.42 (1.21, 1.68) | 0.41 (0.25, 0.68) | 0.00 | 0.08 | ||
| NB all=NB none | ||||||||||
| 58 | 25 (16, 34) | 92 (87, 96) | 58 (42, 74) | 72 (66, 76) | 2.91 (1.59, 5.37) | 0.82 (0.72, 0.94) | −0.61 | 0.00 | ||
| NB none=NB threshold | ||||||||||
| Rd (5 yr) | Kang et al. [17] | 13 | 100 (100, 100) | 0 (0, 0) | 23 (17, 30) | - | 1.00 (1.00, 1.00) | - | 0.13 | 0.13 |
| NB all=NB threshold | ||||||||||
| 23 | 53 (37, 69) | 66 (58, 74) | 32 (21, 44) | 82 (74, 90) | 1.55 (1.05, 2.29) | 0.72 (0.50, 1.02) | 0.00 | 0.05 | ||
| NB all=NB none | ||||||||||
| 36 | 11 (1, 20) | 95 (91, 99) | 40 (10, 70) | 78 (71, 84) | 2.18 (0.65, 7.31) | 0.94 (0.84, 1.06) | −0.19 | 0.00 | ||
| NB none=NB threshold | ||||||||||
The cells show the estimate value and 95% CIs.
CI, confidence interval; DFS, disease-free survival; LRN, likelihood ratio negative; LRP, lihelihood ratio positive; NB, net benefit; NPV, negative predictive value; OS, overall survival; PPV, positive predictive value; Rd, distant recurrence; TCU, threshold of clinical utility.
![]()
DISCUSSION
Eight studies in the scientific literature describe a total of 13 prognostic models developed to predict the mortality, cause-specific mortality, disease recurrence, and distant or para-aortic recurrence in a specific time for patient with LACC treated with chemoradiotherapy. The prognostic factors used by the identified predictive models are the age, race, FIGO stage, histological type, degree of differentiation, lymph node involvement and location, tumor volume, maximum standardized uptake value (SUVmax) of the cervical tumor, ECOG scale SCC-Ag levels, and treatment received. The external validation reveals 4 statistically validated prognostic models for LACC published in the scientific literature. The 4 statistically valid prognostic models showed narrow regions of clinical utility.
The CSS model of Shim et al. [14] lacks discriminative ability and suffers from overestimation problems in calibration.
The OS model of Rose et al. [20] and the CSS model of Tseng et al. [15] also exhibited overestimation problems. This overestimation is related to the absence of some important variable not included in the model's coding (race or adverse lymph node) and the categorization of variables (tumor size and SCC-Ag) as well as the selection of individuals, clinical assay [20], and histological type (squamous cells) [15]). The risk stratification by Liang et al. [16] for DFS, which exhibited good discrimination of para-aortic recurrence, are based on the FIGO stage and involvement of the pelvic lymph nodes.
The distant recurrence model of Kang et al. [17], the models of Kidd et al. [19] for OS at 3 years and DFS at 1 year, and the model of Rose et al. [20] for DFS at 2 years exhibited statistical validity and clinical usefulness, despite variability and changes between development cohorts and validation cohort. For example, contemporary treatment and advanced diagnosis since start to end of accrual dates of validation cohort. In general, the low discriminative capacity and poor calibration of the models negatively impacted the amplitude of the TCUs. The model of Rose et al. [20] for DFS at 2 years presented the best discrimination. Its AUROC increased with respect to the development sample due to the differences between development, data from 6 trials [20], and validation. The CI of the AUROC in the validation sample was compatible with the value observed in the development sample for each of the 4 models [28]. The remaining time points in the evaluated models of Kidd et al. [19] showed no better discrimination than chance or worse discrimination than the development model. The simplified model of Kang et al. [17] discriminates worse than the general model. The previous external validation of the distant recurrence model of Kang et al. [17] carried out by the same investigators at the different institutions exhibited similar statistical validity with respect to the H12O validation cohort.
The external validation study was conducted under a historical cohort design. This proposed study design for external validation is suitable for the longitudinal nature of predictive models [1126] and is the preferred type of design for prognostic research [11]. Its weakness is the retrospective nature of the study. Although it is a simple, flexible, and low-cost method to search and collect patients [1126], it generates a large amount of lost, not collected [1830] and incorrect data, with organized categories that are different from the ones required by the model and may have been obtained with other techniques, procedures, and methods [161720]. These differences directly impact, if not quantify, the estimated survival chances for each specific time.
The most significant weakness of this study is the number of patients from a single center included in the external validation [2631323334]. The literature unanimously recommends samples with a minimum number of 100 events for external validation analyses [31323334]. In our case, the number of patients depended on the patients included in the healthcare database [26]. The number of events for all considered studies was below 100, and fewer than 50 events were considered in the models of Kidd et al. [19] and Kang et al. [17]. Therefore, the validation study is likely to be unreliable, inaccurate and biased [32]. Nevertheless, the CIs were provided to show the set of true but unknown differences that are statistically consistent with the observed differences [28].
The estimation of the predicted probabilities [12] for each individual is a necessary step in external validation analyses, but the accuracy of the estimates depends on having access to the original model [35]. Despite having contacted all corresponding authors, only one [14] provided the exact values of the graphical display. Thus, the probabilities of all other models except for those implemented via the web [1718] were estimated using nomograms [26]. Failure to use the original function or values generated transcription and rounding errors [26]. To avoid estimation discrepancies between subjects with an equivalent profile, the probabilities were calculated using a function programmed in R (R Foundation) [29]. The characteristics of the subjects were retrieved from the articles, and the variable-to-variable comparison between samples required homogenization.
The scientific literature includes reviews that identify models to predict the development of cervical cancer in people without symptoms, such as the study of Stegeman and Bossuyt [36], and to externally validate prognostic models of survival and recurrence in women with early stages of cervical cancer, such the systematic review by Biewenga et al. [37]. The structure of both reviews has elements in common with the one presented here and with the proposal found in the Cochrane manual of systematic reviews of interventions [38]. Other works present validation analyses of prognostic models in patients with early cervical cancer [39], LACC [17], and disseminated cancer [40]. However, only an independent external validation study of 2 predictive models in patients with LACC performed in different population was published [24].
A model for patients with LACC included in routine practice would help the physician to make decisions when cervical cancer is diagnosed [10]. The identification of women at increased risk or likely to benefit the most would allow us to advance treatment to a targeted therapy, improve the information given to the patients over the course of their illness and select patients for inclusion in clinical trials [89]. To lead by example, the distant recurrence model at 5 years from Kang et al. [17] could help select candidates for trials designed to evaluate the efficacy of chemoradiotherapy plus additional chemotherapy in LACC. In meta-analysis study [4], the authors showed that adjuvant chemotherapy improves survival because it reduces distant failure with increased toxicity [417]. It is necessary to be able to identify the patients at higest risk of distant recurrence prior to initiating therapy because it could provide an opportunity for modifying therapy or encouraging enrollment in a clinical trial to evaluate more aggressive therapy only for this high-risk population. The models of Kidd et al. [19] and Rose et al. [20] could be useful in similar scenaries.
Further externally and prospectively validating models developed to predict LACC using the exact formulas that determine these models are essential [26]. To this end, collaboration among the researchers that developed these models is of utmost importance to produce data of clinical utility [27]. Impact-assessment studies are also critical because the extracted evidence [89] will allow us to include the model in actual clinical practice and incorporate it into guidelines and recommendations [9].
 XML Download