

 PDF
PDF Citation
 Print
Print


INTRODUCTION
Lymphedema describes a progressive pathology of the lymphatic system in which there is interstitial accumulation of protein-rich fluid and subsequent inflammation, adipose tissue hypertrophy, and fibrosis [1]. The clinical manifestations of lymphedema occur secondary to the subcutaneous accumulation of edematous fluid and adipose tissue [2]. The clinical staging of lymphedema is based on the Consensus Document of the International Society of Lymphology (ISL) [3]. According to ISL staging, stage 0 refers to a latent or sub-clinical condition where swelling is not yet evident. Stage I represents an early accumulation of fluid that subsides with limb elevation, and pitting may occur. Stage II signifies that limb elevation alone rarely reduced tissue swelling and pitting is manifest. Late in stage II, the limb may or may not pit as excess fat and fibrosis supervenes. Stage III encompasses lymphostatic elephantiasis, where pitting can be absent, and trophic skin changes, such as acanthosis and further deposition of fat and fibrosis. According to the ISL staging of lymphedema, deposition of fat and fibrosis of subcutaneous tissue are crucial [3].
To diagnose and stage lymphedema, various techniques have been used for volume and structural measurements [3]. Tape measurement [4], ultrasound (US) [5], and volumetry [6] can be used for volume measurements, but are unable to identify detailed structural changes in tissues. To measure both the structure and volume of subcutaneous tissues, image analysis via magnetic resonance imaging (MRI) and computed tomography (CT) have been applied [78]. These methods are useful when the onset of spontaneous lymphedema in an adult patient may indicate an underlying malignancy compressing the lymphatic channels, which should be excluded through CT or MRI studies [1]. In a previous study, the classic signs of lymphedema seen in CT and MRI were defined as thickening of the skin, a honeycombed pattern in the subcutaneous tissue, an epifascial fluid lake, and the absence of edema within muscular compartments [78].
In the clinic, CT-based lower extremity venography is often applied when lower leg swelling is found in patients during the management of gynecological cancer, especially after pelvic lymph node dissection and radiotherapy [910] or on regular follow-ups as part of a cancer management program for the differential diagnosis of increased lymphocele, cancer recurrence, or deep vein thrombosis (DVT). Hence, patients presenting for lymphedema evaluation often undergo CT lower extremity venography. However, CT lower extremity venography involves the injection of a radioactive contrast agent.
The aims of our study were to develop an algorithmic quantitative skin and subcutaneous tissue volume measurement protocol for lower extremity lymphedema (LEL) patients using CT, to verify the usefulness of the measurement techniques in lymphedema patients, and to observe the structural characteristics in subcutaneous tissue according to the progression of LEL.
MATERIALS AND METHODS
1. Participants
After obtaining institutional review board approval (National Cancer Center, Korea; NCC2015-0105), we reviewed the medical records of patients who underwent CT lower extremity venography and volumetry for lower extremity swelling and were diagnosed with LEL following treatment for gynecologic cancer between January 2013 and May 2016. The inclusion criteria were as follows: unilateral persistent leg swelling following treatment for gynecologic cancer, a clinical diagnosis of LEL, an interval between CT lower extremity venography and volumetry of ≤14 days, and the absence of DVT, metastatic lymphadenopathy, infection, or other vascular diseases of the lower extremities. The medical records of 25 subjects were reviewed for the study, which we divided into 2 groups: acute lymphedema and chronic lymphedema. The acute lymphedema group consisted of subjects who underwent CT lower extremity venography within 31 days of experiencing lower extremity swelling; the chronic lymphedema group consisted of subjects who underwent CT lower extremity venography ≥1 year after the occurrence of lymphedema. Some LEL patients experienced swelling in both lower extremities; we defined the limb that had persistent swelling as the more-edematous limb, while the limb that had no swelling or swelling that subsided with limb elevation was defined as the less-edematous limb.
2. Algorithmic CT-based quantitative volume measurement
The skin and subcutaneous volume, muscle compartment volume (Fig. 1), and the extent of the peculiar trabecular area with a honeycombed pattern were quantitatively analyzed using the CT images.
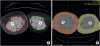 | Fig. 1Algorithmic quantitative skin and subcutaneous tissue volume measurements using CT images. (A) CT scan of the lower limbs. The red and green lines represent the border between the subcutaneous tissue and muscle. (B) The subcutaneous tissue was isolated by subtracting the muscle region, and the volume was calculated by multiplying the x-axis pixel spacing, y-axis pixel spacing, slice thickness, and number of pixels.
CT, computed tomography.
|
First, we set the boundaries for the automated algorithmic volume analyzer. The proximal level was set at the point where the two legs separate and the distal level at 5 cm above the lateral malleolus (Fig. 2). Higher proximal levels and lower distal levels were found to lead to inaccurate measurements.
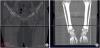 | Fig. 2Boundary levels of the algorithmic CT-based quantitative volume measurement. (A) The proximal level was set at the point where the two legs separate on the CT image. (B) The distal level was approximately 5 cm above the lateral malleolus.
CT, computed tomography.
|
1) Program for algorithmic volume measurement
Total volume
The layers of the leg area consist of skin and subcutaneous fat, muscle, and bone in CT. Among these, subcutaneous fat has the lowest density, normally located in the range of −50–−100 HU in CT. The leg area was imaged by setting the threshold at −200 HU, which is a lower attenuation threshold than the subcutaneous fat from all of the studied CT images. The CT images were segmented according to the respective layers of the leg regions, and the number of pixels in each segment was counted. Total volume was determined by multiplying the x-axis pixel spacing, y-axis pixel spacing, slice thickness, and the number of pixels.
Skin and subcutaneous volume
Subcutaneous fat is located between the skin and muscle in CT images. It is possible to eliminate the skin region by removing the boundary pixels of the segmented leg region through erosion, which is a morphological image processing technique. Muscle has a lower density than subcutaneous fat, generally located in the range of 10–40 HU. Bone located within the muscle has the highest attenuation values in CT imaging. The muscle and skeletal region was obtained by setting a threshold of 10 HU. We then applied a convex hull algorithm to obtain the convex polygon that represents the minimum region that includes the muscle. The subcutaneous fat region could then be isolated by removing the convex polygon from the image. The volume of the subcutaneous fat was calculated in the same fashion as the total volume.
Muscle volume
The muscle volume was calculated by subtracting the subcutaneous volume from the measured total volume.
Extent of peculiar trabecular area with a honeycombed pattern in the subcutaneous tissue
The extent of the peculiar trabecular area of honeycombed pattern in the subcutaneous tissue was calculated as the area with attenuation values between −60 and 10 HU in the subcutaneous tissue. To decide on the range of attenuation values for analysis, we manually analyzed 10 CT lower extremity venography images. We then chose a range in which a color change was visible in the trabecular area with a honeycombed pattern (Fig. 3). The extent of the peculiar trabecular area of honeycombed pattern was determined by multiplying the x-axis pixel spacing, y-axis pixel spacing, slice thickness, and the number of pixels in the segmented region.
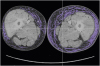 | Fig. 3Representative image of the peculiar trabecular area with a honeycombed pattern in the subcutaneous tissue. This area in the subcutaneous tissue is characterized by attenuation values of −60 to 10 HU. We isolated the trabecular area with a honeycombed pattern and quantified its extent in a similar fashion to the volume calculations.
|
4. Date analysis
SPSS version 18.0 (SPSS Inc., Chicago, IL, USA) was used for the statistical analysis. We compared the values between the more-affected side and the less-affected side and calculated correlation coefficients for the volume, as determined by volumetry and by the CT-based quantitative assessment, using an independent t-test and Pearson's correlation coefficient, respectively. We compared the difference in trabecular area at each limb between the acute lymphedema group and chronic lymphedema group using the Mann-Whitney test. Differences were regarded as significant when the p value was smaller than 0.05.
RESULTS
The medical records of 25 subjects were reviewed; thus, a total of 50 lower extremities were included in this study. The demographic data of the subjects are shown in Table 1. The median age of the patients was 54.2 years (range, 27–72 years). The mean interval between volumetry and CT venography was 4.88 days (range, 0–14 days). Most CT venographies were prescribed in the Center for Gynecologic Cancer, while volumetry procedures were prescribed and performed in the rehabilitation clinic, which is why there was an interval between volumetry and CT venography. All patients had gynecologic cancer: cervical (n=7, 28%), ovarian (n=8, 32%), endometrial (n=9, 36%) and tubal cancer (n=1, 4%). All patients were diagnosed with stage II LEL on the more-edematous limb.
Table 1
Summary of patient characteristics (n=25)

BMI, body mass index; CT, computed tomography; ISL, International Society of Lymphology; SD, standard deviation.
![]()
In 9 of the 25 subjects, information regarding the onset of lower extremity swelling was unavailable. The remaining 16 subjects were divided into 2 groups according to the interval between the occurrence of lower extremity swelling and the CT venography, as described earlier (acute lymphedema, n=11; chronic lymphedema, n=5). The mean interval between the occurrence of lower extremity swelling and CT venography was 9.1 days (range, 0–31 days) in the acute lymphedema group, and 51.8 months (range, 12–84 months) in the chronic lymphedema group.
1. Comparison of the more-edematous and less-edematous sides
According to the volumeter measurements, the mean volume of the more-affected limbs was significantly larger than in the less-affected limbs (p=0.027). The CT-based quantitative assessment found that the more-edematous limbs had a significantly larger total volume, subcutaneous volume, and extent of the peculiar trabecular area with a honeycombed pattern in the subcutaneous tissue, as compared with the less-edematous limbs. There was no significant difference in the muscle volume between the more-affected and less-affected limbs. The mean total volume of the CT-based quantitative assessment was larger than the mean volume as measured by volumetry, for both the more- and less-edematous limbs (Table 2).
Table 2
Comparisons between volume measurements of the more-affected and less-affected limbs

CT, computed tomography; SD, standard deviation.
*p<0.05, significant difference between the more- and less-affected sides.
![]()
2. Correlation coefficients between CT-based quantitative volume and volumetry
The correlations between the volumeter measurements of the total volume and the CT-based measurements of the total, as well as the subcutaneous volume, were strong (correlation coefficients: 0.747 and 0.749, respectively).
3. Quantitative structural characteristics in subcutaneous tissue according to time of occurrence of lymphedema
To observe the structural characteristics of the subcutaneous tissue, we measured the extent of the peculiar trabecular area with a honeycombed pattern in the subcutaneous tissue by CT-based quantitative assessment. The quantitative extent of the trabecular area with a honeycombed pattern in the acute lymphedema group was 177.4 mm3 in the more-edematous limb and 94.5 mm3 in the less-edematous limb; in the chronic lymphedema group, it was 806.9 mm3 and 167.0 mm3, respectively. The chronic lymphedema group had a significantly larger extent of the peculiar trabecular area with a honeycombed pattern within the subcutaneous tissue in the more-edematous limb. There was no significant difference in the less-edematous limb between the acute lymphedema and chronic lymphedema groups (Table 3).
Table 3
Amount of trabecular area of honeycombed pattern of subcutaneous layer according to the time of occurrence of lymphedema

![]()
DISCUSSION
For the ISL staging of lymphedema, an accurate assessment of the deposition of fat and fibrosis of subcutaneous tissue is crucial. In the early phase of lymphedema, the accumulation of fluid may not be clinically evident, or in other words, “lymphedema apparent with subclinical volume accumulation (stage 0)” [1213]. Stage I lymphedema is referred to as “reversible lymphedema” and can be characterized by a lack of fibrosis. Stage II lymphedema is also called “spontaneous irreversible lymphedema” and presents with intradermal fibrosis [1213]. Therefore, it is important to detect and treat lymphedema early, before it progresses to the spontaneous irreversible phase.
For the measurement of limb volume and structural measurement of lymphedema, several methods have been used previously. Tape measurement is the most commonly used method in the clinic. Volumetry and ultrasonography are other objective measurement options. However, tape measurement is prone to technical errors, such as inconsistent tape measurement pressure, inaccurately marked points, or an improper angle relative to the long axis of the limb [1415]. Volumetry demonstrates strong intra-rater and inter-rater reliability, but the cost of the device limits its use to specialized centers and clinical trials [16]. Additionally, tape measurement and volumetry are unable to identify structural changes within the tissue, and can only measure the total volume of the limb (bone, muscle, subcutaneous, and cutaneous tissue). Ultrasonography is capable of measuring the thickness of the soft tissue [15] and give some information about structural changes [1718]. However, none of these methods can accurately evaluate structural changes in addition to measuring volume. MRI and CT are useful tools for measuring both the volume of subcutaneous tissue and structural changes. CT imaging has been shown to have high sensitivity (93%) and specificity (100%) in confirming the diagnosis of lymphedema [8]. Nevertheless, these methods are not routinely applied for the evaluation of lymphedema because of the associated high cost and radiation exposure. However, CT lower extremity venography is often applied to cancer patients with lower leg swelling, so these patients formed a suitable study population for our investigation.
In a previous study, 25% of gynecologic cancer survivors reported swelling of their legs and only 10% of the sample were clinically diagnosed with lower leg lymphedema [19]. Another study found that 40.8% of patients with early ovarian cancer who underwent staging surgery had lower leg edema [20]. For the prognosis of ovarian cancer, lower leg edema as a clinical manifestation of DVT, suggesting a disease burden, might be a poor marker [2122]. Theoretically, lower leg edema could easily develop in patients with DVT from extensive disease and compression of the lymphatic vessels from bulky lymph node metastasis [20]. Therefore, CT lower extremity venography is often applied when lower leg swelling is found in patients during the management of cancer or on regular follow-ups after the cancer management program for differential diagnosis of increased lymphocele, recurrence of a cancer, or DVT.
In this study, we have developed a program for use in lower extremity CT scanning. Using this algorithmic volume measurement, we analyzed the volume of the skin and subcutaneous tissue, muscle, and the extent of peculiar trabecular area with a honeycombed pattern in the subcutaneous tissue. The volume of the skin and subcutaneous tissue was used for volume measurement for LEL and the extent of peculiar trabecular area with a honeycombed pattern in the subcutaneous tissue was used to assess the structural changes of LEL. We found that the subcutaneous tissue volume and the amount of peculiar trabecular area with a honeycombed pattern within the subcutaneous tissue were significantly different, while the muscle volume was not significantly different, between the more-edematous and less-edematous limb. These finding are similar to those of a previous study [8].
The correlations between the values obtained by the algorithmic CT-based quantitative assessment and the limb volume determined by volumetry were strong, which suggests that the algorithmic CT-based volume measurement could be useful for measurements of the volume of subcutaneous tissue. Unlike volumetry, the CT-based quantitative assessment can measure the individual volumes of the cutaneous and subcutaneous tissue, and provide information on changes in the muscle volume due to muscle disuse atrophy. To analyze the largest possible volume of the edematous limbs, we set the proximal boundary level to the highest possible point for the algorithmic CT-based quantitative measurement. Therefore, the mean total volume of the CT-based quantitative assessment was larger than the mean volume as measured by volumetry.
We also found a larger amount of peculiar trabecular area with a honeycombed pattern within the subcutaneous tissue of the more-edematous limb. The chronic lymphedema group had the largest extent of peculiar trabecular area with a honeycombed pattern than the acute lymphedema group in the more-edematous limb of stage II LEL. In a previous study using CT and MRI, the “honeycomb pattern” of the subcutaneous tissue was considered to be due to the presence of fibrotic tissue and fluid surrounding the adipose tissue accumulation. Therefore, we considered that the edematous limb has more fibrotic tissue and adipose tissue accumulation in stage II lymphedema, and the extent of the honeycombed area varies according to the duration of stage II lymphedema. This objective parameter might be more useful in the staging of lymphedema than physical examinations, and may be helpful for treatment planning and predicting treatment efficacy.
However, there are also some limitations to our automated algorithmic volume analyzer. First, CT scans involve radiation exposure, and cannot image soft tissue as well as MRI [1]. However, CT scans may be required to determine the cause of leg swelling, particularly in patients undergoing cancer treatment or in cancer management programs. Second, this study involved only lymphedema stage II patients, so we could not compare the measurements, particularly the extent of tissue with a honeycombed pattern, between different stages. Further studies are required to investigate the extent of the peculiar trabecular area with a honeycombed pattern within the subcutaneous tissue at each stage, and in response to treatment for lymphedema. Third, because this study had a small sample size, we were unable to confirm the feasibility of CT-based quantitative assessment of LEL following treatment for gynecologic cancer.
In conclusion, our newly invented algorithmic CT-based quantitative assessment of subcutaneous volume is useful for the interpretation of LEL in cancer patients. When patients with lower extremity swelling during or after cancer treatment undergo lower extremity CT scans for a differential diagnosis, this approach can provide information not only on DVT, lymphocele, or cancer recurrence, but also on the volume and structural characteristics of subcutaneous tissue for lymphedema. Implementation of an algorithmic CT-based quantitative assessment could be useful for objective volume measurement and could give information about the structural characteristics of subcutaneous tissue in women with LEL.
 XML Download