

 PDF
PDF ePub
ePub Citation
 Print
Print


INTRODUCTION
Cancer stem cells (CSCs) are tumor cells that have the principal properties of self-renewal, clonal tumor initiation capacity, and clonal long-term repopulation potential. CSCs are a distinct cellular subpopulation in colon cancer that is essential for tumor maintenance [12]. Human colorectal CSCs were first isolated on the basis of CD133 expression and were demonstrated to induce tumors in mice that resembled the original malignancy [34]. CSCs have some unexpected properties, including a high degree of heterogeneity and plasticity, capability of metastasis, chemotherapy resistance, and can continually adapt to changing microenvironments [56]. CSCs were initially considered a population with well-defined phenotypic and molecular features. However, accumulating evidence suggests instead that CSCs are a dynamic population continuously shaped by a convergence of genetic, epigenetic, and microenvironmental factors [1].
CSCs reside in niches that are anatomically distinct regions within the tumor microenvironment, which are cellular and noncellular elements surrounding tumors [7]. Interactions between malignant and nontransformed cells create the tumor microenvironment [8]. Nonmalignant cells of the tumor microenvironment including immune cells, tumor vasculatures and lymphatics, as well as fibroblasts, pericytes, and adipocytes have dynamic and often tumor-promoting functions at all stages of carcinogenesis [910]. CD133+ colon cancer cells are reportedly more interactive with the tumor microenvironment than are CD133- cells [11]. HCT116 cell populations are composed mainly of stem-like cancer cells, as demonstrated by their colonosphere forming capability and CD133 expression [1213]. Long-term cultured self-renewing CD133+CD44+ cells enriched in the CD133+CD44 (high) subset, which express the epithelial-to-mesenchymal transition marker, are more invasive in vitro and are solely responsible for liver metastasis in vivo [14]. However, it has not yet been defined whether CD133+ clones of HCT116 cells have distinct molecular signatures compared with CD133- clones in terms of known CSCs properties like sphere forming ability, angiogenesis and vascular niche formation, chemoresistance, radioresistance, and invasive migration for metastasis.
In the present study, we performed whole RNA sequencing in CD133+ and CD133- clones both in attached monolayer cultures and colonosphere forming condition to identify CSC-specific gene expression profiles. Moreover, we also intended to establish in vitro three-dimensional (3D) tumor model consisting of CSCs by applying tumor-sphere formation depending on CD133 expression.
METHODS
Monolayer and tumor spheres cultures
The HCT116 human colorectal cancer cell line was obtained from the American Type Culture Collection (Manassas, VA, USA) Cells were cultured in RPMI 1640 medium (Invitrogen, Carlsbad, CA, USA) supplemented with 10% fetal bovine serum and antibiotics at 37℃ and 5% CO2.
To obtain sphere cultures, monolayer cells were enzymatically and manually dissociated into a single cell suspension using Trypsin-EDTA (0.125%) followed by passage through a 25-gauge needle. Cells were seeded at 5,000 cells/mL into nonadherent plates coated with 1.2% poly-(2-hydroxyethylmethacrylate)/95% ethanol (Sigma-Aldrich, St Louis, MO, USA). Stem cell medium consisted in DMEM/F12 supplemented with B27 (Gibco-Life Technologies, Carlsbad, CA, USA) and MEGM SingleQuots (human epidermal growth factor, insulin, hydrocortisone and GA-100; Lonza, Basel, Switzerland). Tumor sphere cultured (TSC) cells were disaggregated by incubation with the StemPro accutase Cell Dissociation Reagent (Gibco-Life Technologies) until a single cell suspension was obtained. TSC cells were subcultured every 5 to 7 days for up to 5 generations.
Radiosensitivity assay
The association between the expression of monolayer and sphere formed cells and radiation sencitivity was evaluated by sorting and collecting CD133+ and CD133- clones. The cells were pre-plated in a 6-cm diameter culture dish. The following day the cells were exposed to externally applied 0-4 Gray (Gy) γ-irradiation. After 10 days the cells were washed in phosphate-buffered saline and fixed with methanol: acetic acid (3:1) for 10 minutes. The colonies were stained with 5% trypan blue for 10 minutes, rinsed in water, and counted.
RNA sequencing
Transcriptome libraries were prepared following Illumina's TruSeq RNA kit protocol, using 1–2 µg of total RNA. Poly(A)+ RNA was isolated using AMPure XP beads (Beckman Coulter, Brea, CA, USA) and fragmented with the Ambion Fragmentation Reagents kit (Ambion, Austin, TX, USA). cDNA synthesis, endrepair, A-base addition, and ligation of the Illumina indexed adapters were performed according to Illumina's protocol. Libraries were size-selected for 250–300 bp cDNA fragments on a 3% Nusieve 3:1 (Lonza) agarose gel, recovered using QIAEX II gel extraction reagents (Qiagen, Hilden, Germany), and polymerase chain reaction (PCR)-amplified using Phusion DNA polymerase (New England Biolabs, Ipswich, MA, USA) for 14 PCR cycles. The amplified libraries were purified using AMPure XP beads. Library quality was measured on an Agilent 2100 Bioanalyzer for product size and concentration. Paired-end libraries were sequenced with the Illumina HiSeq 2500 (2×100 nucleotide read length). Reads that passed the chastity filter of Illumina BaseCall software were used for subsequent analysis.
RESULTS
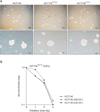
HCT116 cells display colonosphere forming capacity and radioresistance regardless of CD133 expression
In order to identify whether CD133 expression in HCT116 cancer cells is a prerequisite to define CSCs, CD133+ cells were isolated using MACS. Fewer than 1% of HCT116 cells expressed CD133 with the remainder being CD133-. Whole subclones of HCT116 separated by the expression of CD133 formed irregular shaped colonospheres in culture (Fig. 1A). In colon cancer cells, radioresistance is also considered a CSC characteristic [1516]. Appropriately we performed a clonogenic assay using 0–4 Gy γ-irradiation. Interestingly, there were no differences between HCT116 parental and CD133- clones when cells comprised 0.6% of the total cells (Fig. 1B). Only CD133+ clones demonstrated radioresistant changes at 1 Gy γ-irradiation compared with other HCT116 clones. It suggests that whole clones of HCT116 have some CSC properties determined by colonosphere forming capacity, while there is a difference in CD133+ clones with low dose radioresistance. This led us to investigate gene expression profiles of HCT116 subclones, CD133+, and CD133- cells in attached monolayer culture as well as sphere-forming conditions for further characterization.
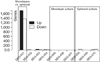
CD133 expression is not a CSC marker in HCT116 cells
Comparison of each subclone of HCT116 in attached monolayer and colonosphere cultures by whole RNA sequencing unexpectedly revealed no significant differences in CD133+ and CD133- clones. The most significant differences were in the comparison of whole spheres and monolayers (Fig. 2). We identified 1,751 coding genes whose expression was increased and 1,384 genes that were downregulated in the spheroidforming cells (1) (Table 1). Consistently, a few genes were differentially expressed in colonosphere culture conditions compared to attached monolayer cultures of each subclones (2–4). There was no difference in gene expression profiles among HCT116 subclones in attached monolayer cultures. Comparison of parental cells and CD133+ clones (5), CD133+ and CD133- clones (6), and parental HCT116 and CD133- clones (7) did not reveal differentially expressed genes were observed. Specifically regulated genes of the CD133+ (8) and CD133- clone (10) were detected in the spheroid-culture condition upon comparison with HCT116 parental cells. However, there was no difference between CD133+ and CD133- clones in colonosphere forming condition (9). The observations suggested that the variations of CD133 expression were not caused by differences of RNA expression. In addition, tumor heterogeneity has been shown to be driven by a combination of genetic, epigenetic, and microenvironmental factors, which together result in functional diversity at the individual, clonal, and intraclonal levels.
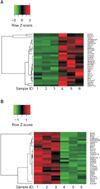
CD133- HCT116 spheroid cells acquire CSC-like properties
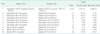
Spheroid cultures of cells derived from primary or metastatic tumors have been widely used to isolate and expand colorectal CSCs. Comparison of whole RNA expression profiles between spheroid cells and monolayer cultured cells revealed up-regulation of 1,751 coding genes and down-regulation of 1,384 genes in the spheroid cells. The 50 most frequently up-regulated and down-regulated genes are listed in Tables 2, 3, respectively. Heatmap analysis of the top 30 up-regulated and down-regulated genes in colonosphere culture conditions discriminated spheres and monolayers of each HCT116 subclone (Fig. 3).
We further analyzed these up-regulated genes by grouping of known CSC properties in the known categories of CSCs, which included control of stemness, chemodrug resistance, and tumor microenvironment vascular and metastatic niches of angiogenesis and metastasis, respectively (Table 4). Unexpectedly, sphere forming ability was not correlated with up-regulation of stemness-related genes aldehyde dehydrogenase family 1 member A3 (ALDH1A3) [1718], which was -2.3 folds down-regulated. However, spheroid cell formation was associated with up-regulation of enhanced vasculogenesis mediated by ANGPTL, ankyrin repeat domain 37 (2.0 folds), SEMA3D, sema domain, immunoglobulin domain (Ig), short basic domain, secreted, (semaphorin) 3D (1.8 folds), SBSN, suprabasin (1.8 folds), and FGFBP1, fibroblast growth factor binding protein 1 (1.8 folds). In addition, spheroid cell upregulation was noted in several gene implicated in chemodrug resistance properties and survival of CSCs under nutrientrestricted conditions, including SLC2A3 (solute carrier family 2; facilitated glucose transporter member 3) (1.9 folds) and SLC30A1 (solute carrier family 30, zinc transporter member 1; a transporter for glucose and zinc) (1.5 folds). The encoded SLC proteins function in the transporter of anticancer agents into cancer cells and mediate the uptake of essential nutrients for tumor growth and survival [1920]. Concerning metastasis, expression of the gene encoding MACC1 (metastasis-associated in colon cancer protein 1) was up-regulated 1.5 folds and that encoding SOCS1 (suppressor of cytokine signaling 1) was up-regulated 1.9 folds in spheroid cells, but MALAT1 (metastasis-associated lung adenocarcinoma transcript 1) was down-regulated 1.4 folds in spheroids. Increased SOCS1 in spheres represented a less aggressive phenotypic change than monolayer cultured HCT116 cells [21]. This pathway may be associated with colonization by metastatic clones. Colonospheres formed by colon cancer cell lines are highly enriched in CSCs and the Wnt/β-catenin pathway plays a critical role in growth and maintenance of CSCs. In addition, FGF, Notch, Hedgehog, and TGF/BMP signaling networks have been implicated in the maintenance of the survival and expansion of CSCs [22]. However, in our gene expression profiles of stem cell signaling network, DKK4 (dickkopf homolog 4), which is an antagonist for Wnt/β-catenin signaling, was up-regulated up to 5.4 folds while DKK1 was down-regulated up to 1.4 folds; overall Wnt/β-catenin signaling was attenuated. Similarly, FGF22 was down-regulated up to 1.8 folds. However, transforming growth factor-beta (TGF signaling was enhanced by the 1.4 folds reduced expression of inhibitory SMAD6. TGF signaling is key in the interactions between metastatic features of single tumors [23]. In this context, TGF acts as tumor suppressor during the initial transformation and has a predominant oncogenic role during tumor progression. In addition, differential expression of several genes encoding transcription factors related to regulation of growth and differentiation of CSCS were presently noted in spheroid cells. The up-regulated genes were the ets domain transcription factor ELF5 (E74-like factor 5; 2.3 folds), SOX6 (SRY, sex determining region Y-box 6; 1.9 folds), ZNF573 (zinc finger protein 573; 1.5 folds), and ZNF714 (zinc finger protein 714; 1.5 folds). Down-regulated genes were SIX2 (SIX homeobox 2; 2.3 folds), KLF9 (Kruppel-like factor 9; 2.1 folds), and GATA2 (GATA binding protein 2; 1.5 folds). Thus, sphereforming HCT116 clones displayed CSCs properties and similar phenotypic changes into CSCs occurred even in cells derived from CD133- clones.
Gene expression profiles in sphere-forming HCT116 clones are associated with CSCs properties
We further analyzed the top 50 differentially expressed genes with already known gene expression omnibus (GEO) profiles and classified them into 6 distinct categories: colon cancer progression in SW480/SW620, CD133+ clones in CRCs, STAT5b-/- colon cells, colonospheres of HT29, snail overexpression in SW480, methotrexate-resistant HT20, and peroxisome proliferator-activated receptor-gamma (PPAR-/- in colon cells (Table 5). Based on the analysis of the colon GEO repository, 12 genes were determined to be up-regulated in sphere forming cells compared to monolayer cells. Among these, 4 genes (DKK4, SLC2A3, DDT4, and CXCR4) were inversely correlated with colon cancer progression. The remaining 8 genes (PEG10, ANGPTL4, NR4A3, SOX6, GRHL3, ACAP1, FGFBP1, and GAD1) were strongly associated with colon cancer progression. In case of CD133+ clones in CRCs, 3 genes were over-expressed: MYO3B, DCD, and GAD1. None of the down-regulated genes were detected in CD133+ CRC clones. In case of STAT5b-/- in colon cells, 5 genes were over-expressed: SPARCL1, FRY, TMC1, EPGN, and FGFBP1. However, FRY showed an opposite correlation. It was expected that most of genes would overlap with sphere-derived cells of whole HCT116 subclones. However, only 5 genes were: ANKRD22, SP5, DCD, MYO3B, and SLC30A1. Among them, SP5 showed a reverse correlation. In case of snail overexpression in SW480 metastatic clones or CSCs, 3 genes (NR4A3, DKK4, and ZNF573) showed correlation. SOCS1 was inversely correlated with spheroid HCT116 cells. Comparison of gene expression patterns in methotrexate-resistance HT29 cells with sphere-derived cells revealed consistent expression of 5 genes (KRT2, CXCR4, PEG10, VSNL1, and SCN9A) in spheroid cells.
Down-regulated genes in spheroid cultures also demonstrated similar properties of CSCs in seven categories (Table 6). Related to colon cancer progression, only TMEM160 was down-regulated in sphere-forming cells compared to monolayer cells. No differentially regulated genes were detected in CD133+ clones. In case of STAT5b-/- colon cells, 3 genes were down-regulated (TEX19, SERTAD4, and HPD), with expression of TEX19 being inversely correlated. Fifteen genes displayed similar expression patterns in HT29 colonospheres (CYP24A1, ALDH1A3, DMC1, TEX19, HAR1A, KLF9, CNTNAP3, SSTR5-AS1, SETMAR, IMMP1L , MMP7, FCGRT, CBR3, GATA2, and MALAT1). Among them, CBR3 and MALAT1 showed a reverse correlation. Nine genes were implicated in snail overexpression in SW480 representing metastatic clones or CSCs: KRT7, SIX2, BST2, IMMP1L, GATA2, RNASEH2C, MSRB3, CST6, and DKK1). GATA2, RNASEH2C, MSRB3, and CST6 were inversely correlated with sphere-derived cells in HCT116. Comparison of gene expression patterns in methotrexate-resistant HT29 cells with sphere-derived cells revealed consistent expression of 3 genes (BST2, SMAD6, and RPL13) and an inverse correlation in the expression of 4 genes (SSTR5-AS1, SERTAD4, LMCD, and DKK1). Thus, sphere forming HCT116 clones showed more primitive phenotypes in CSCs, similar to other stem cells, characterized by slow growth, reduced progression in colon cancer, and high vascular forming capability. However, these cells produced proteins relevant to metastasis and reconstituted metastatic niches.
DISCUSSION
In the present study, we examined CD133+ cells in attached monolayer culture and spheroid forming HCT116 cells including CD133- cells, defined as CSCs in colon cancer. Whole RNA sequencing of each HCT116 subclone in attached monolayer cultures did not show any differences, but colonosphere formation of each subclone was associated with distinct gene expression profiles. Especially, spheroid HCT116 subclones, parental, CD133+, and CD133- cells displayed up-regulation of 1,761 coding genes and down-regulation of 1,384 genes related to CSC self-renewal and survival. This offers strong evidence that spheroid HCT116 cells expand colorectal CSCs rather than clonal expansion depending on CD133 expression. This is consistent with a previous analysis of sphere-derived lung tumor cells in which cells enriched for CSC properties were impaired in metastatic activity [24]. However, acquired CSC properties of CD133- clones may result from spheroid-culture conditions like suspension and epidermal and fibroblast growth factors added during culture, rather than the expansion of CD133- clones. In the analysis of attached monolayer cultures with spheroid-forming cultures of each HCT116 subclone, genes were uniformly up-regulated and down-regulated (Supplementary Table 1). Thirteen of these genes were among the 50 most frequently up-regulated gene in whole sphere culture conditions of HCT 116 clones (FRY, DCD, PEG10, ERICH2, ELF5, DDIT4, VSNL1, ANGPTL4, SLC2A3, FGFBP1, KRT4, MACC1, and SCL30A1). PEG10 (parentally expressed 10) was detected in whole subclones and both genes, VSNL1 and FGFBP1 were shared between CD133- and CD133+ clones, visinin-like 1and fibroblast growth factor binding protein 1, respectively. Among the top 50 down-regulated genes, eight were shared in whole HCT116 clones (CYP24A1, ALDH1A3, PADI3, TM, KLF9, MALAT1, RPL13, and DKK1). Among them, CYP24A1 (cytochrome P450, family 24, subfamily A, polypeptide 1) was commonly down-regulated in whole subclones of HCT116 cells and PADI3 (peptidyl arginine deiminase, type III) was found in the parental and CD133+ clones of HCT116 cells.
A fundamental aspect of stem cell dynamics is plasticity—the capability of cells to shift between different functional states including quiescence/proliferation, drug sensitivity/resistance, symmetric/asymmetric division, epithelial-mesenchymal/ mesenchymal-epithelial transition, and stem/nonstem state [7]. CSCs are no exception to this rule; they have been shown to be plastic with regard to drug resistance, asymmetric division, and differentiation state.
 XML Download