

 ePub
ePub Citation
 Print
Print


INTRODUCTION
Colorectal cancer (CRC) is the third most common cancer and the fourth most frequent cause of cancer deaths worldwide. Surgical resection remains the cornerstone of management for patients with stage I to III disease; however, a considerable number of patients will ultimately relapse and die from their disease. The main prognostic factor for survival or relapse after surgery of localized disease is tumor stage. Accordingly, whereas stage I CRC is usually cured by surgery alone, adjuvant chemotherapy is currently recommended for stage III and high risk stage II cancers [1,2].
In a metastatic setting, patients are treated with two standard first- and second-line chemotherapy regimens (in either order): 1) FOLFOX, consisting of 5-fluorouracil (5-FU), which blocks thymidylic acid formation and therefore DNA biosynthesis, with leucovorin (LV; a folate that stabilizes binding of 5-FU to thymidylate synthase) and oxaliplatin; and 2) FOLFIRI, consisting of 5-FU/LV with irinotecan [3]. Oxaliplatin is a platinum derivative that exerts antitumor activity against colon carcinomas by virtue of its cytotoxic effects, and irinotecan is a topoisomerase inhibitor that ultimately leads to inhibition of both DNA replication and transcription. Recently, the molecularly targeted drugs bevacizumab and cetuximab have been used in combination with FOLFOX and FOLFIRI in metastatic CRC, providing novel targets for cancer therapy.
Bevacizumab is a monoclonal antibody that binds and sequesters vascular endothelial growth factor (VEGF); cetuximab, also a monoclonal antibody, blocks the ligand-binding site of the epidermal growth factor receptor (EGFR) thereby inhibiting EGFR-mediated intracellular signal transduction.
In metastatic CRC, these molecularly targeted agents are being developed for their effects on pathways characteristic of tumors, including those that regulate cell growth, the cell cycle, apoptosis, angiogenesis, and invasion [4,5]. Angiogenesis -the formation of new capillaries from the preexisting one- is an essential requirement of solid tumor growth and metastasis. Accordingly, inhibition of angiogenesis has been explored as an antitumor treatment strategy, reflecting the expectation that poorly vascularized tumors would have limited growth potential and restricted metastatic capacity. VEGF, a specific mitogen for endothelial cell proliferation is probably the key mediator of tumor angiogenesis [6,7].
The extracellular matrix (ECM) acts as both a physical scaffold for cells and a repository for growth factors. Structural changes in ECM proteins accomplished by a complex process controlling the expression and activities of matrix metalloproteinases (MMPs), are a prerequisite for cell migration during tissue remodeling. Overexpression of MMPs leads to degradation of the ECM, an essential step for tumor invasion and metastasis. Particular groups of MMPs, notably gelatinases A and B, also known as 72 and 92 kDa type IV collagenases or MMP-2 and MMP-9, respectively, are of particular interest with respect to their roles in the development and progression of CRC [8-10].
Cell death can be divided into two categories: apoptosis and necrosis. Apoptosis, or programmed cell death, represents a cell-intrinsic "suicide" mechanism that is regulated by a variety of cellular signaling pathways. In many cases, tumors can be difficult to eliminate because cancer treatments often act by damaging cells with radiation or chemicals, and cause mutations in the apoptotic pathway. Understanding how apoptosis is regulated in cancer is therefore a major issue in the development of treatments for this disease [11,12]. Autophagy, a lysosome-based mechanism responsible for the degradation of cellular components, including organelles, might act as a balancing mechanism between cell survival and cell death. Caspases and autophagy are involved in complementary death pathways in cells: in cases where caspases are inhibited, autophagy is required for cell death. In addition, signals such as steroids in flies and tumor necrosis factor-related apoptosis-inducing ligand (TRAIL) in human cells activate an autophagic cell death process that involves both active caspases and autophagy [13,14].
There is a need for a clinically useful chemosensitivity assay that helps to individualize the treatment delivered to cancer patients. Collagen sponge-gel supported histoculture, which maintains cellular heterogeneity and an intact cyto-architecture, has been utilized to develop the histoculture drug response assay (HDRA) for individualized chemotherapy. The three-dimensional collagen-based HDRA uses the 3-(4,5-dimethylthiazolyl-2) 2,5-diphenyltetrazolium bromide (MTT) assay as a readout for the effectiveness of chemotherapeutic agents [15]. The results obtained using HDRA are highly correlated with clinical drug response, resistance, and survival in advanced CRC. However, because HDRA uses only MTT assay as an additional means to objectively validate drug efficacy are needed.
The goal of the current study was to examine the efficacy of conventional monotherapy regimens and combination therapies incorporating molecular-targeted drugs, using effects on various biological behaviors of CRC cells as endpoints.
METHODS
Cell lines
Twelve human CRC cell lines, specifically RKO, SW48, HT29, SW480, and HCT116 from the American Type Culture Collection (Rockville, MD, USA); KM12c, WiDr, DLD1, HCT15, Caco2 and LoVo from the Korean Cell Line Bank (Seoul, Korea); and AMC5, established in our laboratory, were used in these studies. Cell lines were maintained in their respective media supplemented with 10% fetal bovine serum and antibiotics using standard protocols.
Anti-cancer drugs and combinations
The regimens examined included FOLFOX and FOLFIRI, established for colorectal cancer, and their combinations with biologically targeted drugs. The targeted drugs used were bevacizumab (Avastin; Genetech Inc., San Francisco, CA, USA), a VEGF receptor antibody, and cetuximab (Erbitux; Merck, Darmstadt, Germany), a chimeric monoclonal antibody that competitively inhibits ligand binding to the EGFR.
Drug concentrations
Cytotoxicity was assessed using the CellTiter 96 Non-Radioactive Cell Proliferation Assay (Promega, Madison, WI, USA), which is based on the metabolic reduction of the tetrazolium compound MTT by viable cells. Drug concentrations were initially established to largely coincide with clinical doses and results of empirical assays reported previously. Concentrations for drug combination studies were based on IC50 values (i.e., concentrations that inhibit cell growth by 50%). The final concentrations of single agents and combinations used to distinguish in vitro sensitivity from resistance were 50 µg/mL for 5-FU, 10 µg/mL for leucovorin, 20 µg/mL for irinotecan, 40 µg/mL for oxaliplatin, and 20 µg/mL-for bevacizumab and cetuximab. These final values were obtained by selecting median values close to the clinical and preclinical doses that produced minimal toxicity in vivo.
Detection of apoptosis by flow cytometry
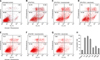
The apoptotic effects of the respective drug regimens were studied using an Annexin V and propidium iodide (PI) double-labeling technique. In the early stages of apoptosis, the cell membrane remains intact and is impermeable to the DNA binding dye, PI. At this same stage, the phosphatidylserine residue to which Annexin V specifically binds is translocated to the extra cellular leaflet of the membrane, making it accessible to Annexin V. In contrast, during necrosis, cells take up PI because the cell membrane is ruptured. Thus, cells which take up both fluorochromes are a mixture of apoptotic and necrotic cells, whereas cells that exclude PI but bind Annexin V are (early) apoptotic cells. Apoptosis of CRC cells was studied by plating 5 × 10⁵ cells on 6-well plates and culturing with chemotherapeutic regimens for 4 hours. The medium was then removed and replaced with fresh medium, and cells were cultured for 24 hours. After removing the medium and washing with phosphate-buffered saline, cells were resuspended in 200 µL binding buffer and incubated with 5 µL Annexin V-FITC (fluorescein isothiocyanate) and 5 µL of PI (BD Annexin V-FITC Apoptosis Detection Kit 1, Becton Dickinson, Franklin Lakes, NJ, USA) and kept in the dark for 15 minutes. Cells were then analyzed using a FACScan flow cytometer (Becton Dickinson).
Caspase-3 activity
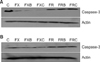
Caspase-3 is responsible for the cleavage of key cellular proteins, such as cytoskeletal proteins, that leads to the typical morphological changes observed in cells undergoing apoptosis. As such, it is a critical executer of apoptosis. Activation of caspase-3 requires proteolytic processing of its inactive zymogen into activated p17 and p12 fragments. Cleavage of caspase-3 was measured by Western blot analysis. Samples were extracted in 2 × Laemmli sample buffer (62.5 mM Tris-HCl, 25% glycerol, 2% sodium dodecyl sulfate [SDS], 5% 2-mercaptoethanol, 0.01% Bromophenol Blue; Bio-Rad Laboratories Inc., Hercules, CA, USA), separated by SDS-polyacrylamide gel electrophoresis, and transferred to polyvinylidene fluoride membranes. After blocking with skim milk in TBST (10 mM Tris-HCl, 0.1 M NaCl, 0.1% Tween 20, pH7.4), membranes were sequentially incubated with anti-caspase-3 antibody (Cell signaling Technology, Beverly, MA, USA) and horseradish peroxide-conjugated anti-mouse secondary antibody (Pierce, Rockford, IL, USA).
VEGF mRNA expression
Total RNA was prepared from control and treated cell lines using Tri reagent (Molecular Research Center, Cincinnati, OH, USA), according to the manufacturer's instructions. cDNA was synthesized from total RNA by amplification with random primers and SuperScript II RT (Invitrogen, Grand Island, NY, USA). The number of VEGF gene copies was analyzed by real-time reverse transcription-polymerase chain reaction (RT-PCR), using the primer pair 5'-TTG CCT TGC TGC TCT ACC TCC A-3' (forward) and 5'-GAT GGC AGT AGC TGC GCT GAT A-3' (reverse). The housekeeping gene glyceraldehyde 3-phosphate dehydrogenase (GAPDH) used as an internal control, was amplified with the primers 5'-AGG GCT GGT TTT AAC TCT GGT-3' (forward) and 5'-CCC CAC TTG ATT TTG GAG GGA-3' (reverse). Quantitative real-time RT-PCR was performed on a LightCycler (Roche, Mannheim, Germany) using the Fast Start DNA Master SYBR Green I kit, according to the manufacturer's instructions. Down-regulation by chemotherapy treatment was defined as a level of mRNA expression less than 1-fold that in untreated controls.
Gelatin zymography assay
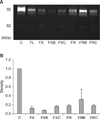
MMP-2 and MMP-9 activities in culture media were examined by gelatin zymography. Concentrated conditioned medium (×10) mixed with sample buffer was electrophoresed under non-reducing conditions at 125 V for 2 hours on a 10% SDS-polyacrylamide gel containing 0.1% gelatin (Invitrogen), incorporated as a substrate for gelatinolytic proteases. The gel was incubated at 37℃ for 16 hours in fresh developing buffer, and stained with 0.5% Coomassie brilliant blue R-250 (Bio-Rad Laboratories Inc.). Bands on gels were quantified by densitometry analyses (Bio-Rad Laboratories Inc.).
Autophagy assay
Autophagic activity was measured by detecting the conversion of the non-autophagic form of microtubule-associated protein 1 light chain 3 alpha (LC3-I) to the autophagic membrane recruited form (LC3-II) by Western blot analysis using an anti-LC3 antibody (Novus, Littleton, CO, USA).
Statistical analysis
All values for apoptosis and angiogenesis were presented as means ± standard errors. Comparisons among the values for respective drug regimens were performed using analysis of variance with least-squares deviation verification. In each case, a P-value < 0.05 was considered statistically significant, and all calculations were performed using IBM SPSS ver. 18.0 (IBM Co., Armonk, NY, USA).
RESULTS
Effect of chemotherapeutic regimens on apoptosis
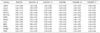
The FOLFOX regimen was more effective in promoting apoptotic cell death, measured by flow cytometry, than FOLFIRI (Table 1). In particular, some cells showed statistically significant differences. The FOLFOX was significantly more effective than FOLFIRI in HT29 and LoVo cells (P = 0.019 and 0.042, respectively). The bevacizumab-containing FOLFOX was significantly more effective than bevacizumab-containing FOLFIRI in LoVo, SW48, and SW480 cells (P = 0.010, 0.044, and 0.030, respectively). Cetuximab-containing FOLFOX was also more effective than cetuximab-containing FOLFIRI in LoVo cells (P = 0.030). Chemosensitivities to the respective regimens varied greatly among cell lines. SW480 and HCT116 cells were significantly more sensitive to cell death induced by all drug regimens compared to other cell lines, especially AMC5 and Caco2 cells, which showed low sensitivity. In SW480 and HCT116 cells, bevacizumab-containing regimens exhibited greater apoptosis, whereas cetuximab-containing regimens showed reduced apoptosis (Fig. 1). Unlike DLD cells, SW480 cells treated with oxaliplatin regimens showed prominent activation of caspase-3, a prevalent caspase that is ultimately responsible for the majority of apoptosis processes (Fig. 2).
Effect on angiogenesis
The effects of drug regimens on vascular endothelial growth factor A (VEGFA) mRNA levels were analyzed by quantitative real time RT-PCR. VEGFA mRNA levels were variably affected in the different cell lines (Table 2). The FOLFOX regimen was more effective than FOLFIRI in HCT116 and WiDr cells (P = 0.026 and 0.049, respectively). The bevacizumab-containing FOLFOX was significantly more effective than bevacizumab-containing FOLFIRI in HCT116 cells (P = 0.001). While in HCT15 cells, FOLFIRI effect was more significant (P = 0.001). Bevacizumab, an anti-VEGF receptor antibody, produced a moderate angiogenesis-blocking effect in most cell lines when added to FOLFIRI/FOLFOX regimens. In particular, the effect of combination with FOLFOX was more statistically significant in HCT15 and SW480 cells (P = 0.003 and 0.021, respectively).
Invasion assay
MMP-2 and MMP-9 activities were assayed by quantitative zymography. Both MMP-2 and MMP-9 activities were remarkably reduced in SW480 cells treated with all drug regimens, whereas the response of other cells varied according to regimens (Fig. 3). In addition, the FOLFOX regimen more effectively reduced MMP-2 and MMP-9 activities in SW480 cells than did the FOLFIRI regimen.
Autophagic cell death
Autophagic activity was detected by measuring changes in the electrophoretic mobility of LC3 protein in Western blots. This characteristic indicates a conversion of LC3 protein from the non-autophagic form (LC3-I) to the autophagic membrane-recruited form (LC3-II). None of the drug regimens caused a change in LC3 conversion in any of the cell lines tested.
DISCUSSION
Several lines of evidence indicate that tumorigenesis in humans is a multistep process in which the various steps reflect genetic alterations that drive the progressive transformation of normal human cells into highly malignant derivatives. Six essential alterations in cell physiology collectively underline malignant growth: self-sufficiency with respect to growth signals, insensitivity to growth-inhibitory signals, evasion of apoptosis, unlimited replicative potential, sustained angiogenensis, and tissue invasion and metastasis. In each case, these physiologic changes correspond to successful efforts on the part of cancer cells to surmount anticancer defense mechanisms that are "hardwired" into normal cells. In general, the effectiveness of conventional anticancer chemotherapy is thought to reflect direct cytostatic and cytotoxic effects on tumor cells [16].
Until the turn of the century, treatment options for CRC patients were limited, both in metastatic and adjuvant settings. For more than 40 years, 5-FU/LV was the standard care for metastatic CRC and node-positive CRC patients. The addition of irinotecan to the 5-FU/LV backbone in the first-line setting improved outcomes in two randomized trials, one using bolus 5-FU and the other using combined bolus and infused 5-FU [17]. In both trials, the addition of irinotecan improved the response rate and the median overall survival and progression-free survival times; thus, the combination of irinotecan with a 5-FU-based regimen replaced 5-FU/LV as the standard first-line therapy for metastatic CRC. More recently, the use of biologically targeted drugs, such as bevacizumab and cetuximab, has been shown to provide additional clinical benefits for patients with metastatic CRC [18,19]. In our study, monotherapy using bevacizumab and cetuximab did not induce significant tumor inhibition, but treatment with these agents in combination with FOLFOX and FOLFIRI led to significantly higher response rates than was observed with FOLFOX and FOLFIRI alone.
Many chemotherapeutic agents mediate their cytotoxic effects by inducing apoptosis, which is generally thought to be a non-inflammatory, non-immunogenic process. However, it has recently been suggested that apoptosis can follow biochemically distinct subroutines, some of which may result in immunogenic cell death, despite the morphological uniformity of apoptotic cell death [20,21]. In this context, oxaliplatin induces immunogenic apoptosis accompanied by exposure of calreticulin; oxaliplatin implantation chemotherapy of CRC mice relies on an intact immune system including the presence of toll-like receptor 4 (TLR4); and advanced CRC patients bearing a loss-of-function TLR4 allele have a lower progression-free survival after oxaliplatin-based chemotherapy than control patients with a wild-type allele [22-24]. In the current study, treatment combinations containing oxaliplatin led to significantly higher apoptosis rates with concurrent activation of caspase-3 than those containing irinotecan in the SW480 cells. These results suggest that oxaliplatin induces apoptotic cell death of CRC cells, and that this effect determines its therapeutic efficacy in CRC patients.
In our study, SW480 cells were the most sensitive to drug-induced apoptosis and invasion. The SW480 cell was derived from a primary Dukes' stage B (colon adenocarcinoma) tumor from a 50-year-old Caucasian male [25,26]. SW480 cells are considered functionally p53-deficient because the endogenous p53 protein contains two point mutations, R273H and P309S, which result in an abnormal p53 protein [27]. A study by Toscano et al. [28] reported that oxaliplatin enhances TRAIL-induced apoptosis in p53-mutant CRC cell lines, including SW480 cells [2]. In addition, SW480 cells show a microsatellite-stable and hMLH1-proficient profile. Fujita et al. [29] demonstrated that treatment of hMLH1-deficient cells with 5-FU resulted in 34 to 45% less apoptosis than treatment of hMLH1-proficient cells, and clinical investigations have shown that patients with microsatellite-stable cancers are more sensitive to 5-FU.
In this study, SW480 and HCT116 cells were more resistant to apoptosis when treated with regimens containing cetuximab than when treated with regimens containing bevacizumab. This finding is related to the fact that both cell lines harbor a KRAS mutation, with SW480 and HCT116 cells expressing G12V and G13D KRAS mutants, respectively. The finding that KRAS mutations are associated with resistance to cetuximab, reported here, is consistent with the results of previous clinical studies [30]. KRAS mutation status might allow the identification of patients who are likely to benefit from cetuximab, and avoid the costly and potentially toxic administration of this treatment in nonresponder patients.
HDRA uses cancer tissue fragments in a three-dimensional matrix that maintains intercellular contact and interactions with stromal cells. The advantage of HDRA is its ability to assess the sensitivity of tumor cells to anti-cancer drugs under conditions similar to those in vivo. However, HDRA is limited in that it relies solely on MTT assays to assess drug sensitivity. Therefore, we sought to validate that conventional drug regimens, with and without molecular-targeted therapeutics, are associated with apoptotic and autophagic cell death pathways, as well as angiogenesis and invasion. In this study, all of the chemotherapeutic regimens tested were associated with apoptotic cell death and invasion. Autophagy and anti-angiogenensis parameters were less closely linked to CRC cell death.
In conclusion, the present results suggest that apoptosis and invasion responses were the main indicators of drug sensitivity in CRC, highlighting the value of in vitro assays capable of assessing these parameters. Because HDRA maintains an in vivo-mimetic context, it is concurrently useful for evaluating the sensitivity of chemotherapeutic regimens. Thus, the MTT-based HDRA and apoptosis and invasion assays are valuable tools for assessing chemosensitivity in the context of CRC.
 XML Download