

 ePub
ePub Citation
 Print
Print


INTRODUCTION
When chemosensitivity testing is performed for chemotherapy in patients, the interpretation of it is usually done on day 2 to 7 after test [1-5]. This is just considering inhibition percentage (%inhibition) of cancer cells at one point in the lifetime of the cancer cells; however, the inhibition rates of cancer cells in vivo may differ depending on the characteristics of the cancer cell, which might cause some unexpected results in practice. If unexpected behaviors relating to genetic characteristics are observed in cancer cells after chemosensitivity tests have been completed, it might be dangerous to treat patients according to the results of the test. Here, the author intends to suggest a likely problem in chemosensitivity testing performed in practice and speculates on practicable measures for more accurate chemosensitivity evaluation.
METHODS
Cancer cell and chemical
Three kinds of cancer cells (RSC, RRC1, and RRC2) were derived from SNU-C2A and SNU-C1 colorectal cancer cell lines purchased from the Korean cell line bank. The cancer cells were cultured in Dulbecco's Modified Eagle's Medium (Invitrogen, Carlsbad, CA, USA) containing 10% fetal bovine serum (Invitrogen), 50,000 U/L penicillin (Invitrogen), 80 µM streptomycin (Invitrogen), and 0.25 µg amphotericin B (Invitrogen) in a humidified incubator (Sanyo, Gunma, Japan) at 37℃ with an atmosphere of 10% CO2. 5-fluorouracil (5-FU) was used as a cancer drug. 50 µg/mL was used as 100% treatment dose of 5-FU.
Culture and treatment
Cancer cells were cultured in 96-well plates for chemosensitivity and 6-well plates for mRNA quantitation. Cancer cells were treated with serially diluted 5-FU from 0 (no drug) to 200% treatment dose. Each cancer cell line was plated in a 96-well plate at a density of 5 × 10³ cells/well and in a 6-well plate at a density of 8 × 10⁴ cells/well, respectively. Negative control (no cell) was also included in each evaluation plate. Inhibition percentage of cancer cell and relative quantitation of thymidylate synthase (TS) mRNA were measured in each 96-well plate and 6-well plate on day 2 (D2), day 5 after 70% media replacement on day 2 (D2+5), day 7 (D7), and day 3 after 100% media replacement on day 7 (D7+3), respectively. Here, media replacement was intended to induce regrowth of cancer cells.
Chemosensitivity evaluation
The effect of the drug on cell viability was tested using a CellTiter 96 Aqueous non-radioactive cell proliferation assay kit (Promega Co., Madison, WI, USA). After incubating the test plate with reagents of the assay kit for 2 hours at 37℃ in a humidified 5% CO2 atmosphere, absorbance at 490 nm was measured using a microplate reader. Tests were repeated three times, and the means of the test results were used for analyses. Inhibition percentage of cancer cell line was calculated using the following equations:
T/C = Absorbance of cultured cancer cell treated with 5-FU / Absorbance of cultured cancer cell not treated with 5-FU
%inhibition of cancer cell = (1-T/C) × 100 [6]
Median-effect dose (Dm), the dose that produces 50% effect, was calculated with CalcuSyn (Biosoft, Cambridge, UK).
Relative quantitation of TS mRNA
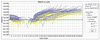
RNA was extracted from cancer cell using the Absolutely RNA Microprep kit (Stratagene, La Jolla, CA, USA). Quantitative real-time polymerase chain reaction (PCR) was performed with the One Step PrimeScript RT-PCR kit (Takara Bio Inc., Shiga, Japan); transcription of cDNA and quantitation of TS mRNA with TaqMan TS mRNA gene expression assay kit (Applied Biosystems, Foster City, CA, USA) were performed in the ABI prism 7700 (Applied Biosystems). TaqMan glyceraldehyde-3-phosphate dehydrogenase (GAPDH) (Applied Biosystems) was used as an internal control. Relative quantitation of TS mRNA was calculated with TS mRNA and GAPDH (Fig. 1).
Statistical analysis
TS mRNA levels in each cancer cell on four evaluation days were compared by Mann-Whitney U test. To analyze the difference of TS mRNA quantitation according to the change of 5-FU concentration on each evaluation day, the correlation between TS mRNA level and 5-FU concentration was evaluated with Kendall's tau-b. Statistical significance was established at the P < 0.05 level for each analysis.
RESULTS
Chemosensitivity evaluation
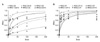
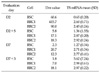
RSC was the most sensitive on all evaluation days (Table 1, Fig. 2). RRC1 was the most resistant against 5-FU on D2 and D7. Dm values of RRC1 were 6.9 times and 4.6 times higher than RSC and RRC2 on D2, respectively, and those of RRC1 on D7 were 9 times and 1.7 times higher than RSC and RRC2 on D7, respectively. RRC2 was the most resistant on D2+5 and D7+3. Dm values of RRC2 were 3.1 times and 1.1 times higher than RSC and RRC1 on D2+5, respectively, and those of RRC2 on D7+3 were 10.1 times and 2.6 times higher than RSC and RRC1 on D7+3, respectively.
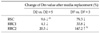
Dm values on D2 decreased after media replacement on D2+5 (9.6%, 4.1%, and 20.3% in RSC, RRC1, and RRC2, respectively). Dm values on D7 decreased after media replacement on D7+3 (78.3% and 33.8% in RSC, RRC1, respectively), on the other hand, Dm value on D7 increased in RRC2 after media replacement on D7+3 (147.2%) (Table 2).
Relative quantitation of TS mRNA
Mean TS mRNA levels in RSC in tested 5-FU concentrations were lower than those of RRC1 and RRC2 on D2, D2+5, and D7; however, TS mRNA value of RSC was higher than those of RRC1 and RRC2 on D7 (Table 1).
Mean TS mRNA levels of RSC on D2 and D7 were significantly lower than those of RRC1 and RRC2, respectively (P = 0.004, P = 0.004 on D2; P = 0.010, P = 0.006 on D7).
Correlation between TS mRNA values and 5-FU concentrations
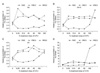
TS mRNA levels in RRC1 were significantly reversely correlated with 5-FU concentrations on D2 (correlation coefficient, r = -0.867). On the other hand, correlations were not significant in RRC2 (r = 0.067) (Fig. 3). Those correlations in RSC were not as strong on D2 (r = 0.600) but significantly strong on D7 and D7+3 (r = 0.867, r = 1.000, respectively).
DISCUSSION
In Table 1 and Fig. 2, chemosensitivity against 5-FU on D7 indicated that RSC was the most sensitive and RRC1 was the most resistant among tested cancer cells. RRC1 is more resistant to 5-FU than RRC2 on D7, but %inhibition in RRC1 and RRC2 showed some changes on D7+3. Dm value increased from 12.3 to 18.1 in RRC2 while decreasing continuously in RRC1 (Tables 1, 2). If the chemosensitivity is decided on D7, RRC1 is definitely the most resistant among tested cancer cells in this study. However, the most resistant to 5-FU is RRC2 on D7+3. If this happens in patients, it would be difficult to decide whether or not to accept the results of chemosensitivity on D7. This also raises the question of whether the chemosensitivity test measuring %inhibition of cancer cells at one point of their lifetime could completely guarantee the destination of cancer cells after chemotherapy in vitro.
Here, the author evaluated %inhibition of cancer cells before and after media replacement intended to help regrowth of cancer cells after chemotherapy. This was also an attempt to make a cultural environment closer in similarity to in vivo status, because less damaged cancer cells would normally obtain enough nutrients from the body after the direct effects of chemotherapy ended. As a result, evaluating %inhibition of cancer cells before and after media replacement seemed to be helpful to better differentiate between sensitive and resistant cancer cells in this study.
When 5-FU is administered to patients, its metabolite, 5-fluoro-2'-deoxyuridine-5'-monophosphate, binds to TS involved in DNA synthesis [7-9]. Significant relations between TS levels and 5-FU sensitivity have been reported [10,11]. Although the correlation between TS mRNA and protein expression is not always significant [12], TS mRNA levels are known to be higher in the 5-FU resistant cancer group compared to the 5-FU sensitive group [13-15].
In Table 1, mean values of TS mRNA in RSC on D2 and D7 showed significantly low values compared to those in RRC1 and RRC2, respectively (P = 0.004, P = 0.004 on D2; P = 0.010, P = 0.006 on D7). On D2+5 and D7+3, relative quantitations of TS mRNA at 100 and 200% treatment dose of 5-FU in RSC were very high compared to those at other concentrations. After all, these increased levels are thought to make it difficult to differentiate between RSC and RRC1 or between RSC and RRC2 on D2+5 and D7+3.
TS levels as determined by enzyme activity assays, immunohistochemistry and mRNA expression were reported to be initially decreased by 5-FU treatment, which were followed by induction of TS [16]. When patients with colorectal cancer were given one presurgery bolus of 5-FU, TS mRNA expressions in primary cancer cells of exposed patients were higher than in those of unexposed patients [17]. These studies indicate that 5-FU exposure can affect TS mRNA expression levels in cancer cells. However, the correlations between TS mRNA levels and 5-FU concentrations are not well known.
In Fig. 3, significant correlation between TS mRNA levels in RRC1 and 5-FU concentrations were observed on D2 (correlation coefficient, r = -0.867), but such significant correlations were not found in RRC2 (r = 0.067) (Fig. 3). And those correlations in RSC were also significantly strong on D7 and D7+3 (r =0.867, r = 1.000, respectively). Correlations between TS mRNA values and 5-FU concentrations, as well as mean values of TS mRNA in Table 1, combine to be able to differentiate among RSC, RRC1, and RRC2 in this study. Although TS enzyme activity was not measured in this study, changes in TS mRNA expression levels to 5-FU concentrations seem to affect the response of cancer cells against 5-FU treatment.
Each cancer cell has its own genetic characteristic reported to cause different responses against the same chemotherapeutic environment [18-20]. And chemotherapy itself is a very invasive procedure compared to antibiotics treatment in patients, which makes physicians very careful and sometimes hesitant to treat patients according to the chemosensitivity results. Therefore, various approaches to provide more accurate chemosensitivity have to be developed for practical application.
In Korea, two assay methods for chemosensitivity, histoculture drug response assay and adenosine triphosphate-based chemotherapy response assay are being used in practice [4,5]. As previously mentioned, those tests only evaluate %inhibition of cancer cell at one point after chemotherapy, which might not always predict the destination of cancer cells due to different characteristics of individual cancer cells.
Chemosensitivity tests measuring inhibition of cancer cells do not evaluate pharmacokinetic and pharmacogenetic processes significantly affecting chemosensitivity in the body. An integrated approach based on a pharmacokinetic analysis combined with dihydropyrimidine dehydrogenase genotyping and/or phenotyping has been suggested to be a safer strategy for optimizing the administration of 5-FU [21]. And a combination of germline TS polymorphisms was reported to be an independent prognostic marker in selecting colorectal cancer patients with poor prognosis [22]. However, commercially available chemosensitivity tests measuring cancer cell survival have excluded these pharmacokinetic and pharmacogenetic perspectives until now.
Although more numbers of cases showing conversion of Dm values as seen in this study are needed to make conclusive results more concrete, evaluating %inhibition of cancer cells at one point in a chemosensitivity test seems to be insufficient to determine chemotherapeutic regimens. Multilateral approaches, such as trials in this study evaluating cancer cell survival before and after media replacement and correlations between TS mRNA levels and 5-FU concentrations, need to be implemented for the practical application of chemosensitivity testing.
 XML Download