

 ePub
ePub Citation
 Print
Print


INTRODUCTION
The incidence of thyroid carcinoma is rapidly increasing in Korea and in several regions of the world [1-3]; most of the increase is due to the early detection of small papillary thyroid carcinoma (PTC). In Korea, PTCs comprise approximately 95% of thyroid carcinomas and 90% are PTCs of the classic type [4].
Although fine needle aspiration biopsy (FNAB) is the choice of diagnostic tests for most thyroid nodules, an indeterminate (10 to 20%) and inadequate (10 to 15%) diagnosis imposes a dilemma for clinicians and undermines the diagnostic value of FNABs. In this context, several molecular diagnostic techniques focusing on the detection of genetic alterations have been designed, but this approach also has limitations because genetic alterations are not found in all thyroid carcinomas. Thus, there is a hope that detection of differential gene expression profiling (GEP) of thyroid carcinomas can be used as a diagnostic marker and improve the diagnostic value of FNABs of thyroid nodules.
Paik et al. [5] proposed that GEP of 21 genes selected from previous published microarray analyses can accurately predict the prognosis of patients with breast cancer. It is also possible that the accumulation of microarray and clinic-pathologic data will facilitate the use of GEP in estimating the prognosis of thyroid carcinomas.
Furthermore, analyzing the pattern of GEP in PTCs will shed light for identifying a molecular target of treatment and the adoption of personalized molecular medicine in treatment.
In this study we determined the global GEP of PTCs in Korean patients compared to normal thyroid gland tissues using oligonucleotide microarray, which contains 24,000 transcripts. We also tested five up-regulated genes to validate the microarray technique.
METHODS
Tissue samples
The samples for this study were randomly selected and obtained from 19 PTCs and 7 controls of normal thyroid tissue from contra-lateral lobes (all paired with PTCs) at the time of surgery from patients who underwent total thyroidectomies at the National Cancer Center between December 2006 and December 2007. All contra-lateral lobes were normal on preoperative ultrasound imaging. Gross specimens were carefully examined to reduce the chance of including occult carcinoma in control samples. The tissues were immediately snap-frozen and stored at -80℃ until use. The purity of the samples was confirmed by microscopic examination under frozen section before RNA extraction. All carcinoma samples contained pure carcinomas and normal thyroid tissue. The medical records were reviewed to define the clinical features of each case. Informed consent was obtained from all patients. This study was approved by the Institutional Review Board of the National Cancer Center.
RNA preparation
Total RNA was extracted using Trizol (Invitrogen, Carlsbad, CA, USA) and purified using RNeasy columns (Qiagen, Hilden, Germany) according to the manufacturers' protocols. After processing with DNase digestion and clean-up procedures, RNA samples were quantified, aliquotted, and stored at -80℃ until use. For quality control, RNA purity and integrity were evaluated by denaturing gel electrophoresis (OD 260/280 ratio) and analyzed on an Agilent 2100 Bioanalyzer (Agilent Technologies, Santa Clara, CA, USA).
Oligonucleotide microarray analysis
Total RNA was amplified and purified using the Ambion Illumina RNA amplification kit (Ambion, Austin, TX, USA) to yield biotinylated cRNA according to the manufacturer's instructions. Briefly, 550 ng of total RNA was reverse-transcribed to cDNA using a T7 oligo(dT) primer. Second-strand cDNA was synthesized, in vitro-transcribed, and labeled with biotin-NTP. After purification, the cDNA was quantified using a ND-1000 Spectrophotometer (NanoDrop, Wilmington, DE, USA). Labeled cDNA (750 ng) samples were hybridized to each Illumina Human-8 Expression Bead Chip (Illumina Inc., San Diego, CA, USA) for 16 to 18 hours at 58℃ according to the manufacturer's instructions. The Human-8 Expression Bead Chip microarray contains 23920 probes derived from the National Center for Biotechnology Information Reference Sequence (NCBI RefSeq) database (Build 36.2, Release 22). Detection of the array signal was carried out using Amersham fluorolink streptavidin-Cy3 (GE Healthcare Bio-Sciences, Piscataway, NJ, USA) following the bead array manual. Arrays were scanned with an Illumina BeadArray Reader (Illumina Inc.) confocal scanner according to the manufacturer's instructions.
Data analysis
Array data export processing and analysis was performed using Illumina BeadStudio ver. 2.1.12 (Illumina Inc.). The quality of hybridization and overall chip performance were monitored by visual inspection of both internal quality control checks and the raw scanned data. Raw data were extracted and filtered by a detection P-value < 0.05 (similar to signal-to-noise) in at least 50% of the samples; a filtering criterion for data analysis was applied and a higher signal value was required to obtain a detection P-value < 0.05. The selected gene signal value was transformed by logarithm and normalized by the quantile method. The comparative analysis between PTCs and controls (normal thyroid gland) was carried out using a t-test (|fold|>3) and an adjusted Benjamini-Hochberg false discovery rate (FDR) P-value < 0.01 [6].
Hierarchical cluster analysis was performed using complete linkage and Euclidean distance as a measure of similarity. Classifications were made using a support vector machine (SVM) algorithm in ArrayAssist (Stratagene, La Jolla, CA, USA); 16 samples (10 PTCs and 6 controls) were used by training, and 10 samples (9 PTCs and 1 control) were validated. All data analysis and visualization of differentially expressed genes was conducted using ArrayAssist. Biological pathway and gene function-based analysis were performed by using the protein analysis through evolutionary relationships (PANTHER) database (http://www.pantherdb.org). The PANTHER classification system is a resource that classifies genes by function using published scientific experimental evidence and evolutionary relationships to predict function even in the absence of direct experimental evidence.
Quantitative reverse transcription-polymerase chain reaction (QRT-PCR)
A TaqMan real-time RT-PCR kit (Applied Biosystems, Foster City, CA, USA) was used to detect and quantify specific mRNA expression in PTCs and controls. Briefly, a 2-µg aliquot of RNA was converted to cDNA using a high capacity cDNA reverse transcription kit (Applied Biosystems). The cDNA products are diluted and an aliquot of cDNA equivalent to 10 ng of total RNA was used for quantitative real-time PCR performed using primers and TaqMan probes supplied from Applied Biosystems. The assays include cadherin 3, type 1, P-cadherin (CDH3, NM_001793.3), neuronal guanine nucleotide exchange factor (NGEF, NM_019850.1), met proto-oncogene (MET, NM_000245.2), protein S (PROS1, NM_000313.1), and transforming growth factor alpha (TGFA, NM_003236.1).
Glyceraldehyde-3-phosphate dehydrogenase (GAPDH) was used as an endogenous control for normalizing the RNA concentration. Real-time PCR was performed with the ABI 7700 sequence detection system.
Standard thermal cycling cycle threshold (CT) values for each gene were obtained for each sample. Differences in the CT values between a test gene and endogenous controls (GAPDH) (ΔCT) were calculated and used for statistical analyses.
RESULTS
Patient characteristics
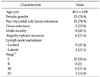
Nineteen classic PTC samples were collected and the normal thyroid glands of the contra-lateral lobe were gathered from seven out of nineteen patients for controls. The mean age of the patients was 48.3 years (range, 29 to 78 years) and 78.9% of the patients (15/19) were females. The clinical characteristics of the patients with PTCs are presented in Table 1.
Differentially-expressed genes in PTCs and normal thyroid glands
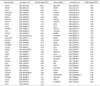
To identify the genes that were differentially-expressed between PTCs and normal thyroid gland tissues, we applied a strict threshold in comparative analysis (a t-test |fold| >3 and an adjusted Benjamini-Hochberg FDR P-value < 0.01). In the comparison analysis between 19 PTCs and 7 controls, 70 genes were identified as up-regulated and 9 genes as down-regulated in PTCs according to the criteria (Table 2).
When we classified 79 differentially-expressed genes according to their biological process and molecular function using the PANTHER database, the highest involved biologic process was signal transduction (38%, 30/79) followed by the developmental process (19%, 15/79), protein metabolism/modification (16%, 13/79). According to molecular funtion classification, the receptor (14%, 11/79) is the leading functional class of differentially-expressed genes, followed by transcription factor (10%, 8/79), cell adhesion molecule (10%, 8/79), Detailed distributions of the differentially-expressed genes are displayed in Fig. 1A, B.
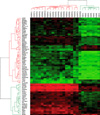
Hierarchical cluster analysis showed that PTCs were well-discriminated from controls, with the exception of one case which showed overlap between PTCs and controls, indicating the possibility of selecting a group of genes for the diagnosis of PTCs. Detailed results of hierarchical cluster analysis is shown in Fig. 2. Data from one PTC sample which showed no discrimination is excluded in this figure.
Validation of the microarray-derived data by quantitative RT-PCR
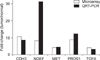
To verify the reproducibility of these genes, we performed QRT-PCR using the same RNA used for microarray analysis (Fig. 3). The following five representative genes were used: CDH3 (NM_001793.3), NGEF (NM_019850.1), MET (NM_000245.2), PROS1 (NM_000313.1), and TGFA (NM_003236.1). GAPDH expression was analyzed as a control. The QRT-PCR showed consistent results with those obtained from the oligonuleotide microarray, except that QRT-PCR showed a 3.9-fold increased expression compared to oligonucleotide microarray data for non-equilibrium Green's function (NEGF).
Classification by the SVM algorithm
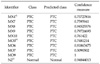
Classification model by SVM algorithm was constructed to differentiate PTC from normal thyroid tissue. Ninety gene probes were selected from raw data with arbitrary criteria of a FDR adjusted P-value < 0.01 and an absolute fold-change >3. A training classification model was formed according to the SVM algorithm from 10 PTCs and 6 controls. Probability of error was expected less than 0.01 when confidence measure was more than 0.5. Training model discriminated PTC from normal thyroid tissue with 100% of accuracy. Then with this 90 probe classification model, remaining samples from 9 PTCs and 1 control were used to validate possible prediction of PTC. This validation test revealed also 100% accuracy in discriminating PTCs and normal thyroid gland (Table 3).
DISCUSSION
In this study, we performed GEP analysis using oligonucleotide microarray and identified 79 differentially-expressed genes (70 up-regulated and 9 down-regulated) between PTCs and normal thyroid glands which could serve as potential diagnostic and therapeutic targets in the management of PTCs in Korean patients. This study also demonstrated the possibility of using differential gene expression in the molecular diagnosis of PTCs using a classification model designed by the SVM algorithm. This GEP analysis was performed with Illumina's Human-8 Expression Bead Chip, which contains 23920 probes derived from the NCBI RefSeq database. This oligonucleotide microarray has never been used for thyroid carcinomas. Furthermore, the criteria of selection for differentially-expressed genes were rather strict that the absolute fold-change >3 and a FDR adjusted P-value < 0.01 were adopted, whereas many other studies about microarray analysis of thyroid carcinomas used a 2-fold change and a P-value < 0.05 [7-9].
Genes associated with signal transduction were the most common up-regulated genes. This finding seems to be reasonable because the RAS-BRAF-MAPK and PI3K-AKt pathways are the most important molecular mechanisms in the carcinogenesis of PTCs [10]. However, cross-talking between other signal transduction pathways may be present because several genes associated with other signal transduction pathways were found in our analysis.
A large-scale meta-analysis of cancer microarray data is known to differentiate important genes from false-positive genes in a large number of candidate gene lists from DNA microarray data [11]. In that context, Griffith et al. [12] conducted a comprehensive meta-analysis of thyroid carcinoma GEP studies in 2006 to identify meaningful biomarkers. Griffith et al. [12] reviewed 21 published studies, in which 34 comparisons were performed from 10 different expression platforms of microarrays and showed that 39 genes (23 up-regulated and 16 down-regulated in thyroid carcinoma) showed the same expression patterns among thyroid carcinoma, regardless of the tumor type, in an overlap of 3 or more studies. Among the 23 up-regulated genes in thyroid carcinoma from their study, 7 genes (MET, TGFA, PROS1, PSD3, SDC4, TUSC3, and P4HA2) were also selected as members of 70 up-regulated genes in our study. Recently, Kim et al. [13] reported gene expression profiling of Korean PTCs. Their results showed different up-regulated or down-regulated genes with our results. Discordance between similarly designed studies may be caused from technical error or difficulties of reproducibility in microarray experiment. However, the present study included greater number of sample size and decreased chance of including parenchyma cells using microscopic exam of tumor samples before RNA preparation.
MET oncogene encodes the c-MET protein. c-Met protein is a hepatocellular growth factor receptor and is known to be responsible for the motility and mitogenesis of epithelial cells, including cancer cells [14]. Several studies reported c-MET protein expression in thyroid carcinoma as a useful diagnostic and prognostic marker [15]. Increased c-MET expression has been associated with a higher risk for metastasis [3] and recurrence [3,5] of PTCs. TGFA encodes transforming growth factor alpha protein. TGFA stimulates the growth and proliferation of cells and its over-expression has been correlated with patient survival in a variety of tumors. TGFA is closely related to epidermal growth factor (EGF) and binds to the EGF receptors (EGFR) as a ligand. TGFA is reported to be up-regulated in some human carcinomas [16]. Bergstrom et al. [17] proposed that increased expression of TGFA may cause aberrant activation of EGFRs and ultimately led to over-expression and activation of c-MET. PROS1 codes for the vitamin-K-dependent plasma protein (protein S), which is an essential anticoagulant and multifunctional protein [18]. The association of protein S and thrombosis is well-established, but its role in cancer is not studied. The up-regulation of PROS1 was eminent in the meta-analysis of Griffith et al. [12] and our study also showed a marked increase of PROS1 transcripts in microarray (9-fold) and QRT-PCR (12-fold) among PTCs compared to normal thyroid gland. PSD3 is located in chromosome 8p21. A meta-analysis of gene expression in breast carcinomas showed that PSD3 is down-regulated in metastasizing tumors and was identified as a candidate metastasis suppressor gene [19]. However, there are no reports about its role in thyroid carcinomas. SDC4 is found on chromosome 20 and encodes a transmembrane (type I) heparan sulfate proteoglycan that functions as a main cell adhesion receptor involved in focal adhesion formation and is required for cell migration [20]. Tumor suppressor candidate 3 (TUSC3) is a candidate tumor suppressor gene and is located on chromosome 8p22, which is a homozygous-deleted region of a pancreatic cancer [21]. It is interesting that TUSC3 is up-regulated in PTCs, whereas it is down-regulated by chromosomal deletion in pancreas cancer. Prolyl 4-hydroxylase, alpha polypeptide II (P4HA2) is located in 5q31 and encodes a component of prolyl 4-hydroxylase, a key enzyme in collagen synthesis composed of two identical alpha subunits and two beta subunits [22]. Prolyl 4-hydroxylase catalyzes the formation of 4-hydroxyproline, which is essential to the proper three-dimensional folding of newly synthesized procollagen chains. Teodoro et al. [23] reported that p53-mediated inhibition of angiogenesis in cancer is thorough via up-regulation of P4HA2.
In addition to the 7 genes in agreement with the meta-analysis of Griffith et al. [12], we focused on two more genes which showed increased up-regulation in this microarray experiment (CDH3, 10.6-fold; NGEF, 8.1 fold). CDH3 is the highest up-regulated gene in this microarray analysis. This gene is located on chromosome 16q22 and is a classical cadherin from the cadherin superfamily and encodes P-cadherin, which is a membrane glycoprotein that functionally mediates tumor cell adhesion [24]. P-cadherin over-expression is strongly associated with tumor aggressiveness and a poor prognostic marker in breast cancer [25]. Furthermore, monoclonal antibody (PF-03732010) against P-cadherin has anti-tumor and anti-metastatic activity in a tested xenograft model and is now in a Phase 1 clinical trial [26]. If PTCs overexpress P-cadherin, P-cadherin also could be a candidate for this kind of therapy in intractable cases with PTCs. NGEF is located on 2q37 and functions as a guanine nucleotide exchange factor for the Rho-type GTPases. Although NGEF showed transforming potential in cell culture and was able to induce tumors in nude mice [27], further studies are lacking and its role in carcinogenesis needs to be clarified in the future. Interestingly, NEGF expression was more prominent in validation experiment using quantitative RT-PCR. This suggests that NEGF expression plays more important role in PTC because quantitative RT-PCR is more sensitive method to detect gene expression than microarray.
The diagnosis of PTC based on FNAB has limitations because of "indeterminate" results, which accounts for 15 to 20% of FNAB results [10]. Molecular diagnostic markers could be helpful to discriminate malignant thyroid nodules from benign nodules. Our GEP analysis using a SVM algorithm successfully discriminated PTCs from normal thyroid tissues. SVM algorithm is a powerful method to classify differences between two groups with large number of data. Yukinawa et al. [28] reported feasibility of GEP based diagnosis using SVM algorithm in thyroid tumors even though the accuracy was 85.7%. However, future study should select a more concise gene cluster to analyze it from FNAB samples because diagnosis of thyroid nodule are made by FNAB mostly [29].
There were some limitations in this study. First, although GEF is a powerful technique that is capable of providing new leads in the understanding of molecular mechanisms of PTCs, there still exists the possibility of false-positive discovery in the 79 selected genes of our study. Thus, the selected genes from our study need to be clarified about its role in carcinogenesis of PTCs through further studies. Second, we used mRNA from bulk tumors, which could contain inflammatory cells, stroma cells, endothelial cells, and fibroblasts in addition to cancer cells. To reduce the bias from the contamination of the other aforementioned cells, Nikolova et al. [30] used a laser microdissection technique to enrich the tumor cell population in their microarray study. Although we did not use a microdissection method for the samples in this study, we checked every sample before mRNA extraction so that every tumor specimen should contain >90% of tumor cells. Thus, we think that this approach will reduce the chance of contamination from various cells other than PTCs.
In conclusion, we investigated GEP of PTCs compared with normal thyroid gland and identified 70 up-regulated and 9 down-regulated genes in PTCs. A disease classification model using the SVM algorithm showed excellent accuracy in diagnosing PTCs only by GEP.
We anticipate that the results of this study involving GEP will shed light on a better understanding of PTCs in Korea and lead to discover novel diagnostic molecular tests of PTCs.

 XML Download