

 PDF
PDF ePub
ePub Citation
 Print
Print


Introduction
Menopause is the permanent cessation of the menstrual cycles following the loss of ovarian reproductive function and is a natural physiological process related to aging.1 The postmenopausal period is clinically and retrospectively diagnosed with the following amenorrhea for more than 12 months.
There is evidence of a worsening quality of life (QOL) after menopause, especially in relation to the presence of climacteric symptoms, their frequency and intensity.1 Among the climacteric symptoms that affect QOL are insomnia (INS) and musculoskeletal pain (MSP).
Epidemiological investigations focusing on the postmenopause stage worldwide show an alarming prevalence of MSP2 and INS,3 although the different methods used to evaluate INS and the frequent lack of a clinical diagnosis hamper the comparison among the studies. As women age, both sleep disturbances and pain complaints tend to increase.
INS seems to influence the onset and level of MSP in different populations,4 although most studies focus on both sexes and different age ranges, rather than specifically in postmenopausal women. The co-occurrence of poor sleep quality, pain, and mood symptoms, such as anxiety and depression is evidenced in the literature and presented as a cluster of symptoms in women.5 However, there is no evidence in the literature about the association between chronic MSP complaints and INS in postmenopausal women and its characteristics regarding MSP, menopausal and mood symptoms, sleep and and QOL. We also aimed to examine the predictor factors for menopausal symptoms and QOL.
Materials and Methods
1. Ethical aspects
The present study was approved by the Ethics Committee of the Universidade Federal de São Paulo (CEP/UNIFESP #786.299/2014). Recruitment of general women took place between February 2015 and October 2016.
2. Recruitment criteria
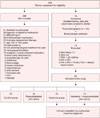
A total of 355 women were assessed for eligibility to take part in the study, with 62 being selected after the evaluation of the inclusion and exclusion criteria (Fig. 1). The inclusion criteria consisted of being women aged 50 to 65 years; present at least 1 year of amenorrhea; follicle-stimulating hormone concentrations ≥30 mIU/mL; undergo a clinical consultation for confirmation of menopause diagnosis; to not have taken hormonal therapy in the previous 6 months; and to not be obese (body mass index [BMI] <30 kg/m2). As exclusion criteria, we considered: high risk for sleep disordered breathing, assessed by the Stop-Bang questionnaire;6 self-report of uncontrolled clinical; major neurologic, orthopedic and rheumatologic diseases, autoimune disorders or conditions that could influence pain; psychiatric disorders; use of psychoactive drugs such as hypnotic, antidepressants, anxiolytics, benzodiazepines and central nervous system stimulants; attending psychotherapy, physiotherapy or treatments for INS or pain; shift work; illiteracy; and the presence of other sleep disorders diagnosed by polysomnography (PSG) exam (narcolepsy, obstructive sleep apnea evidenced by an apnea-hypopnea index (AHI) ≥15/hr, periodic limb movements (PLM) index ≥15/hr and parasomnias).
3. Sociodemographic and clinical assessment
Participants provided sociodemographic data and reported any comorbidities on their first visit. Weight and height were assessed in the first visit, allowing for the calculation of BMI (Kg/m2). All volunteers completed questionnaires upon enrollment. On their second visit, volunteers underwent a laboratory PSG exam on a scheduled night followed by a blood sample collection in the following morning. On the third visit, volunteers with an INS Severity Index ≥157 had a clinical consultation to confirm their INS diagnosis.
4. Postmenopausal assessment
The postmenopausal stage was classified according to Stages of Reproductive Aging Workshop (STRAW) criteria into early, which covers the first 8 years since menopause; and late, which covers the subsequent period.8
5. Questionnaires
Brief Pain Inventory - MSP severity and MSP interference with daily function.
This questionnaire was used to evaluate the severity and interference of MSP.9 The answers are distributed on a numerical scale from 0–10, with 0 representing “does not interfere” and 10 representing “interferes completely”.
6. Pain visual analog scale (VAS) - pain intensity
Participants completed 3 times a day over 10 days a pain diary, composed of an average pain rating on a VAS (0 “no pain”, 10 “worst pain imaginable”).10 VAS scores were averaged across days for each period to assess the intensity of chronic MSP during the day.
7. Menopausal symptomatology
The Menopause Rating Scale accessed menopausal symptoms in 3 domains: somatic, psychological and urogenital.11
8. Quantification of vasomotor symptoms
Participants reported the number of hot flashes and night sweats before going to bed of the previous night daily during 10 days. The number of vasomotor symptoms was averaged across days.
9. QOL
The World Health Organization QOL Questionnaire, brief form (WHOQOL-BREF) assesses the individual's perception in a general index, independently of its 4 domains: physical, psychological, social relations and environment. The score ranges from 0 to 100, the closer to 100, the better is QOL perception.12
10. Mood symptoms
The Beck Anxiety Inventory investigates common symptoms of anxiety, and results range from 0 to 63: 0 to 7 is interpreted as a “minimal level of anxiety”; 8 to 15 as “mild"; 16 to 25 as “moderate”; and 26 to 63 as “severe anxiety symptoms”.13
The Beck Depression Inventory examines episodes of depression. It ranges from 0 to 63; 0 to 9 is interpreted as a “no depression symptoms or minimal”; 10 to 18 as “mildmoderate”; 19 to 29 as “moderate to severe”; 30 to 63 as “severe depression symptoms”.14
11. Sleep quality and daytime sleepiness
The Pittsburgh Sleep Quality Index (PSQI) is a self-rated questionnaire that assesses sleep quality and disturbances over a 1-month period. A PSQI ≤ 5 indicates good sleep quality, while > 5 is associated with poor sleep quality, and > 10 indicates sleep disturbances.15
Epworth Sleepiness Scale was used to evaluate excessive daytime sleepiness. The score ranges from 0 to 24, and 0 to 9 indicates “no sleepiness symptoms”, while > 9 may be “suggestive of daytime sleepiness”.16
12. PSG
We used PSG for assessment of objective sleep patterns and to exclude volunteers with other comorbid sleep disorders from the study. All participants underwent a basal PSG, performed using a digital system (EMBLA® N7000; Embla Systems Inc., Broomfield, CO, USA) during their usual sleep time. The following physiological variables were evaluated: electroencephalogram (EEG), electrooculogram (bilateral), electromyogram, electrocardiogram (derivation D2 modified), airflow detection by a thermocouple and by nasal pressure, respiratory effort using thoracic and abdominal x-trace belts, snoring and body position by EMBLA sensors, percutaneous oxygen saturation (SpO2) and pulse rate by an EMBLA oximeter. All PSG were visually scored by a registered and trained PSG technologist, blinded to group allocation. All sleep stages, EEG arousals, leg movements and respiratory events were scored according to the guidelines of the American Academy of Sleep Medicine.17
13. Definition of groups
Participants were categorized into 4 groups: control, postmenopausal healthy controls without MSP and INS; MSP, volunteers presenting chronic MSP pain complaints without INS, assessed using the Nordic Musculoskeletal Questionnaire; 18 INS, participants presenting an INS disorder diagnosis without MSP (ISI ≥ 15 had a clinical consultation to confirm the INS diagnosis according to the Diagnostic and Statistical Manual of Mental Disorders, Fifth Edition criteria19), and INS + MSP, volunteers having both conditions.
14. Sample size calculation
The sample size was calculated for 80% power, an effect size of 0.72 with Cohens' d and an α error of 0.05. For the subjective parameters (pain VAS as outcome), the required sample size was 12 per group and a total of 48 volunteers. The sample size calculation was made using G * Power software version 3.1.9.2 (Franz Faul; Universitat Kiel, Kiel, Germany).
15. Statistical analysis
Continuous variables were analyzed through a two-way analysis of variance (ANOVA). The distributions were evaluated for normality and homogeneity of variances by Shapiro-Wilk and Levene's test, respectively. Based on this assessment, the following variables were square root transformed, to satisfy the models' normality assumptions of distributed residuals: time since menopause, pain interference, sleep latency, rapid eye movement (REM) sleep latency, wake after sleep onset (WASO), sleep efficiency, non-REM (NREM; NREM stage N1 sleep, NREM stage N2 sleep, arousal index, respiratory disturbance index, AHI, PLM and number of vasomotor symptoms. Pearson's χ2 test was used to verify associations between categorical variables. Generalized linear models with Gamma or Tweedie distributions were used to assess the associated factors for menopausal symptomatology and QOL continuous variables, and was followed by Sidak post hoc analysis when necessary. All analyses were conducted using SPSS version 18 software (SPSS Inc., Chicago, IL, USA). Statistical significance was set at P ≤ 0.05
Results
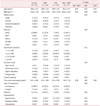
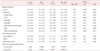
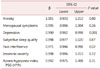
From a total of 75 women who entered the protocol, 62 were eligible and were allocated into 4 groups: control, MSP, INS, and INS + MSP (Fig. 1). The sample was homogeneous as demonstrated in Table 1, except for age, with the INS group being older than all other groups (F = 3.88, df = 1, P = 0.05), and the presence of hypertension in the INS group was significantly higher compared to the other groups (χ2 = 9.1; df = 1;P = 0.03)
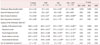
INS and MSP were individually and independently associated with higher MSP severity (F = 10.31, df = 1, P = 0.002; F = 15.27, df = 1, P = 0.000; respectively, Table 2). A similar pattern was observed for the interference of pain with daily function (F = 10.53, df = 1, P = 0.005; F = 26.96, df = 1, P = 0.000) and its domains, such as general activity (F = 5.4, df = 1, P = 0.02; F = 12.01, df = 1, P = 0.001), mood (F = 8.23, df = 1, P = 0.006; F = 8.86, df = 1, P = 0.004), walking ability (F = 5.03, df = P1, = 0.03; F = 7.85, df = 1, P = 0.007), sleep (F = 5.41, df = 1, P = 0.02; F = 18.72, df = 1, P = 0.00) and ability to appreciate life (F = 10.89, df = 1, P = 0.002; F = 6.99, df = 1, P = 0.01). For the working ability and relationships with other people domains, we observed an association with MSP only, worsening these domains (F = 7.86, df = 1, P = 0.007; F = 12.71, df = 1, P = 0.001; respectively, Table 2).
Regarding the intensity of pain recorded in a 10-day pain diary, as expected the presence of MSP, independently of INS, was associated with increased pain intensity in all 3 periods evaluated: upon waking (F = 20.33, df = 1, P = 0.000), at midday (F = 20.13, df = 1, P = 0.000) and before going to bed (F = 27.24, df = 1, P = 0.000). At midday, the INS groups presented increased pain compared to non-INS groups (F = 5.22, df = 1, P = 0.02; Table 2). Additionally, the INS + MSP group presented a higher frequency of women reporting 3 or more pain sites (88.2%) compared to all the other groups (Table 2). MSP was a result of the following disorders: plantar fasciitis, elbow and shoulder tendinitis, hip and shoulder bursitis, carpal tunnel syndrome, low back pain, cervical spine pain, ankylosing spondylitis, temporomandibular disorder, and hand, shoulder, arm, back, knee, hip, leg and foot pain.
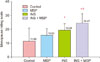
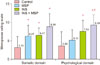
INS with MSP and INS alone were associated with higher menopausal symptoms (F = 10.76, df = 3, P = 0.000; Fig. 2). In relation to the Menopause Rating Scale domains, the somatic (F = 10.52, df = 3, P = 0.000), and the psychologic (F = 9.98, df = 3, P = 0.000) domains presented the same pattern (Fig. 3). We found no significant statistical difference among groups in the urogenital domain (F = 1.19, df = 3 , P = 0.32)
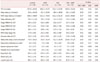
In relation to mood symptoms, INS alone (F = 9.20, df = 1, P = 0.04) and MSP alone increase anxiety symptoms (F = 5.33, df = 1, P = 0.02). Regarding depression symptoms, no statistical differences were observed among the groups (F = 0.53, df = 1, P = 0.47; Table 3).
No significant differences were observed among the groups regarding vasomotor symptoms (F = 0.67, df = 1, P = 0.42; Table 3).
In relation to sleep, a significant interaction between INS and MSP was also observed for sleep quality (F = 83.06, df = 1, P = 0.001), as the INS group presented worse sleep quality compared to all other groups. No statistical differences were found for daytime sleepiness among the groups (F = 0.06, df = 1, P = 0.81; Table 3)
A significant interaction effect between INS and MSP was observed for PLM (F = 4.20, df = 1, P = 0.05), showing that the INS group had the highest PLM index compared to other groups. The presence of INS was associated with increased WASO and AHI, and decreased mean SpO2, independent of chronic MSP (F = 5.61, df =1, P = 0.02; F = 7.16, df = 1, P = 0.001; F = 4.85, df = 1, P = 0.03; respectively Table 4).
Regarding QOL, the results showed that INS alone (F =14.08, df = 1, P = 0.00) and an MSP aonle (F = 4.18, df = 1, P = 0.05) worsened QOL general index. The physical domain of QOL followed the same pattern as INS (F = 20.13, df = 1, P = 0.00) and MSP (F = 13.22, df = 1, P = 0.01) were independently associated with worse QOL. The presence of INS alone was associated with decrease in both psychological and environmental domains of QOL (F = 8.01, df = 1, P = 0.01; F = 5.28, df = 1, P = 0.02; respectively, Table 3).
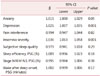
As shown in Table 5, the generalized linear model showed increased symptoms of anxiety and depression, as well as INS severity, were positively associated with higher menopausal symptoms. Each 1-unit increase in anxiety symptoms score was associated with a 50% addition in the menopausal symptoms score. Each 1-unit increase in depressive symptoms score and INS severity score were associated with a 2.1-fold and 3.6-fold increase of menopausal symptoms score, respectively.
Regarding the predictor factors of QOL in the whole sample of women included in the current study, the results showed that each 1-unit increase of depressive symptoms score was associated with a 10% decrease in QOL. Additionally, each 1-unit increase in pain interference score was associated with a 30% decrease in QOL (Table 6).
Discussion
This is the first study, to the best of our knowledge, to show the characteristics of INS + MSP combined on increased anxiety, worse MSP severity and higher interference with daily function, more MSP intensity at midday, increased number of MSP sites, more sleep fragmentation (WASO) and worse QOL in postmenopausal women.
There is strong evidence about the sleep-pain interaction and its bidirectionality in the general population. INS, independently of MSP, has been shown to be associated with MSP severity and MSP interference in most of its domains. Chronic MSP conditions have been linked to disturbed sleep1011 and short sleep duration (<360 min).4
INS alone was associated with increased pain intensity at midday. A study by Tang and colleagues,20 in the general population, showed that sleep helped to reduce pain intensity. A possible hypothesis for this is that sleep deprivation increases plasma levels of cortisol which is responsible for increased pain sensitivity. Cortisol concentrations start to decline from midday and reach their lowest concentrations in the late evening and during the early part of the sleep period.21 In addition, the presence of restorative sleep seems to reduce chronic generalized pain22 and in our sample, this restorative sleep “acted” only until midday, as our INS + MSP group complained of worse MSP intensity at midday.
Another hypothesis is related to the midday body temperature decline. The body temperature is a biologic rhythm closely associated with the circadian rhythm of sleepiness.23 The thermoregulatory mechanism that lowers body temperature and the decline in cortisol concentrations can promote sleep. We speculate that both could have influenced the increased perception of MSP at midday, so the relief of pain generated by sleep was evident only until the first half of the day. Moreover, our sample did not present daytime sleepiness.
Both INS and MSP are core symptoms of menopause. INS influences the perception of other menopausal symptoms24 such as MSP in our investigation. This finding, especially in relation to the somatic and psychological domains, is corroborated by another study that found INS symptoms as more correlated with psychological than with somatic symptoms.25 Vasomotor symptoms, considered the hallmark indicator of menopause, represent a possible sleep interference. No statistical differences among groups in vasomotor symptoms were found in our sample.
Although no statistical difference was found in relation to depressive symptoms, they were, together with anxiety symptoms, predictive factors for menopausal symptomatology. Anxious people, in general, are more likely to have INS symptoms and individuals with INS appear to have a 17-fold increased chance of experiencing anxiety.26
The INS groups presented higher sleep fragmentation (WASO). Sleep fragmentation was the most common alteration of sleep in chronic pain patients.27 We observed increased AHI and decreased mean SpO2 in the sample of women with INS, but despite the statistical significance of these findings, they do not have clinical relevance, being within the normal range of reference parameters. MSP did not influence objective sleep parameters in our investigation.
Our postmenopausal women had impaired sleep with a short sleep duration of < 360 minutes on the PSG exam; poor sleep efficiency below 85% indicating non-restorative sleep; increased N1 sleep stage, indicating more superficial sleep; and increased WASO, evidence of sleep fragmentation. Lowest SpO2 was under the reference values in 90% of our sample.
INS alone worsened QOL in our sample. INS may produce conditions that impair QOL such as fatigue, physical tiredness, mental exhaustion, irritability28 and also MSP.20 MSP alone was associated with lower QOL in the physical domain in our investigation. We found depression and pain interference as predictor factors for worse QOL. Menopausal symptoms have been shown to affect QOL in other studies, particularly in the physical domain, the highest rates of complaints being muscle and joint pain.29 Sleep is an essential component of good QOL.30
There are some limitations in this study that should be considered. First, this was a cross-sectional design, which does not allow the establishment of causality between factors. Second, the MSP was assessed through self-reported data while combined subjective and objective data may be more suitable for research (e.g., Quantitative Sensory Testing). Third, the information about comorbidities was based on the participants' self-reports. Lastly, there was no night of adaptation for the PSG exam, w hich may decrease overall the sleep quality of the participants from all groups.
The present results demonstrate that INS + MSP combined was related to higher menopausal and anxiety symptoms, more sleep fragmentation, more complaints of MSP severity and interference, more pain sites and worse QOL. The presence of INS was associated to more MSP intensity and interference on daily function. However, the presence of MSP was not associated with sleep. This indicates that in the bidirectional association between INS and MSP in postmenopausal women, INS seems to play a major role, but investigations of the direction are warranted. Sleep management is essential in women who have developed chronic MSP to improve QOL and reduce the possible development of comorbidities, such as anxiety, depression and INS.
 XML Download