

 PDF
PDF ePub
ePub Citation
 Print
Print


Introduction
The prevalence of low bone mineral density (BMD) and risk of fracture are increased among patients with end-stage renal disease,1 but the effects of mild-to-moderate renal insufficiency on BMD have been less widely studied.2 Separately, studies have reported conflicting data. In one matched case-control study, patients with kidney disease had lower BMD,3 but in another study, kidney function did not predict lower BMD after adjusting age, gender, and weight.4 This discrepancy could have been attributable to the characteristics of the study populations such as race and age, and the degree of decreased renal function could have affected the results. The relationship between renal function and BMD could differ by degree of renal function.
Another possible cause of this conflicting result is the use of different renal function markers. A number of markers have been used to estimate renal function estimation, most widely, creatinine. However, creatinine levels are influenced partly by muscle mass, which is associated with age, gender, and weight.5 Although estimated glomerular filtration rate (eGFR) can be used as an improved marker of renal function, it is also calculated from serum creatinine. Cystatin C (Cys-C) is a member of the human cysteine superfamily and is an extracellular inhibitor of cysteine proteases; it can be used to represent the changes in the GFR, similar to serum creatinine. Serum Cys-C was found to be a better marker than serum creatinine and also a better representative of GFR than serum β2-microglobulin.678 In addition, serum Cys-C is known not to be influenced by body mass or age.9 Cys-C may be a better marker than traditional ones, but its correlation with BMD is still unclear.
In this study, we evaluated the correlation between BMD and renal function with multiple markers in Korean women without overt nephropathy.
Materials and Methods
1. Study population and anthropometric measurements
This study include 1,093 women aged 50 to 70 years old who completed our self-report questionnaires without exception among 3,670 women who visited the health promotion center at Pusan National University Hospital from January 2011 to December 2014. We obtained information on menstrual history, operative history, and disease history in addition to medical history, medication use, and lifestyle using self-report questionnaires and interviews with healthcare providers. Using a standing stadiometer, we measured body weight and height with light clothing while the subjects were barefoot and rounded the values to the nearest 0.1 kg and 0.1 cm. We calculated body mass index (BMI) as the weight in kilograms divided by the height in meters squared.
In order to apply this study to the normal population group, we set the exclusion criteria as follows: 1) patients with overt nephropathy; 2) patients whose blood test results raised the suspicion of renal disease (creatinine level higher than 1.5 mg/L, an eGFR less than 60 mL/minute/1.73 m2); 3) patients who had received hormone therapy within the previous 12 months; and 4) patients who were currently undergoing chemotherapy or radiation therapy.
2. Blood sampling and laboratory analysis
Blood was drawn at the antecubital vein from all subjects between 8:30 and 10:00 am following at least eight hours of fasting, and we analyzed Cys-C using turbidimetric immunoassay. The liver and renal function tests included alanine aminotransferase, aspartate aminotransferase, lipid profiles, blood urea nitrogen (BUN), serum creatinine, and total bilirubin as well as others, all of which we measured using the Toshiba TBA200FR (Toshiba Co., Tokyo, Japan).
3. BMD measurement
We measured BMD by dual energy X-ray absorptiometry (Hologic QDR-4500A; Hologic Inc., Bedford, MA, USA) at the lumbar spine (L1-L4), femur neck, and femur total and classified the results according to World Health Organization (WHO) criteria as normal BMD: T-score ≥ -1 or osteopenia or osteoporosis: -2.5 < T-score < -1 or T-score ≤ -2.5, respectively).
4. Statistical analysis
We used SAS 9.3 (SAS Institute, Inc., Cary, NC, USA) for the statistical analysis, entering all data into a database for verification by an independent person. We divided the study population into two groups by body area: osteopenia-osteoporosis and normal BMD in the lumbar and femur regions, respectively. We investigated the basic characteristics of the groups using the χ2 test, independent t-test, or Wilcoxon rank sum test, and we compared the relationship between renal function and BMD using a logistic regression model.
Results
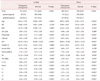
The basic characteristics of our study groups are presented in Table 1. Between women with osteopenia-osteoporosis and women with normal BMD in the lumbar region, there were more postmenopausal women in the osteopenia-osteoporosis group; serum phosphate, alkaline phosphatase (ALP), insulin, and homocysteine were also significantly higher in the osteopenia-osteoporosis group. The results for the femur region were similar except there was no difference in insulin level.
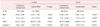
Table 2 shows the correlations between BMD and the renal function markers. In the lumbar region, BUN and Cys-C were significantly higher in the osteopenia-osteoporosis group, but creatinine was lower in this group. The femur region showed the same results.
Table 3 shows the logistic regression analysis results for BMD and the renal function markers. The odds radios of BUN and Cys-C were statistically significant in both regions with unadjusted analysis; however, once we adjusted for age, menopausal status, and BMI, there was no statistical significance for either. Creatinine showed negative correlations in lumbar BMD, and eGFR showed positive correlations with femur BMD after adjustment.
Discussion
In this study, BUN, creatinine, and Cys-C were correlated with BMD in both the normal and osteopenia-osteoporosis groups. In logistic regression analysis, BUN and Cys-C were correlated with lumbar and femur BMD, but after we adjusted for age, menopause, and BMI, only creatinine showed a negative correlation with lumbar BMD and eGFR was related positively with femur BMD.
Generally, it is known that decreased renal function is associated with decreased BMD. Decreasing GFR is associated with increased parathyroid hormone secretion and fibroblast growth factor 23 signaling, which leads to decreased vitamin D synthesis, which is then associated with bone loss.1011 However, many studies found no relationship between renal function and BMD. The reasons for this disagreement might be the degrees of diminished renal function and the renal function markers that were used for the analyses.
Patients with end-stage renal disease (ESRD) have a higher prevalence of low BMD and a higher risk of fracture.1 The mechanism of low BMD in ESRD patients is multifactorial.12 Metabolic bone disease, β2-microglobulin-related amyloidosis, hypogonadism, avascular necrosis, and chronic acidosis in ESRD patients could all be associated with increased bone loss,13 and conversely, osteoporosis and fracture can accelerate the development of ESRD.
Decreasing GFR is associated with increased parathyroid hormone secretion, which leads to decreased vitamin D synthesis, which is then associated with bone loss. In our data, calcium and vitamin D were not different between osteopenia/osteoporosis and normal BMD. So we assume that difference in BMD may be caused by other factors partly. Osteoporosis is characterized by long-term chronic inflammation and microvascular disease that could enhance the deterioration of renal function. Additionally, acute inflammatory response in bone healing following fracture might further deteriorate renal function.14
In patients with mild-to-moderate chronic renal disease, the relationship between renal function and BMD could be different from that in ESRD patients. Kong et al.15 reported that mild-to-moderate chronic renal disease was not independently associated with decreased BMD, but Kaji et al.16 reported that postmenopausal women with mild renal dysfunction were at increased risk for BMD decrease and vertebral fractures. This discrepancy is probably due to the difference in gender and age between the two studies. In the report of Kong et al.15, both men and women were included and the mean age was 49.9 years. However in the report of Kaji et al.16, only women were included and the mean age was 64.5 years.
Osteoporosis is an age-related disease with several gender-specific differences. Bisphosphonate and hormone therapy are used for the treatment of osteoporosis, and cell therapy is also being studied recently.17 Its prevalence is higher in women than in men. Due to their larger bones, men have greater bending strength than do women.18 In addition, the effect of estrogen has to be considered. It is well-known that estrogen has a positive effect on BMD. Hypoestrogenism induced by gonadopin-releasing hormone agonist can cause low BMD status that need treatment.19 Moreover, multiparity and prolonged lactation have negative impact on BMD.20 Additionally, many studies suggest that estrogen has a nephroprotective effect.212223 Menopause can cause a decrease in estrogen, which affects both the bone and the kidney. Therefore, health care through comprehensive screening including renal function at the time of menopause is necessary. There is a possibility of predictive role of renal function test in BMD to some extent.
In a population without overt nephropathy, Huh et al.24 reported that serum creatinine reflected muscle mass, and low serum creatinine was independently associated with low BMD, and these results correspond with those of our study. Reduced muscle mass, or sarcopenia, is a well-known risk factor for osteoporosis; it affects balance and thereby increases the risk of falls and subsequent fractures.25 Serum creatinine reflects physical activity levels as well as skeletal muscle mass, and both are important for maintaining bone health.26 Because creatinine degradation is stimulated by reactive oxygen species, decreased serum creatinine may reflect increased oxidative stress, which may consequently deteriorate BMD via this oxidative stress.27
The serum creatinine cut-point for the presence of sarcopenia was suggested to be below 0.7 mg/dL in postmenopausal women.24 In our study, mean creatinine was 0.7 ± 0.13 mg/dL in the lumbar region and 0.71 ± 0.18 mg/dL in the femur region in the osteopenia-osteoporosis group, both of which were lower than the levels in the normal BMD group.
Renal function should be analyzed differently according to presence or severity of renal dysfunction. In ESRD, renal function is highly correlated with low BMD, and renal function markers could predict osteoporosis or fractures. However, in patients with normal renal function, lower serum creatinine is associated with lower BMD in relation to sarcopenia. In mild-to-moderate renal disease, the correlation of renal function and BMD is controversial.
Regarding the renal function markers, creatinine is a better marker for BMD. Cys-C is a good marker for renal function, but it has limited value in reflecting BMD because BMD is determined by multiple factors.
This study has a number of limitations. First, we did not evaluate body mass, which is important in estimating the relationship between renal function and BMD. Second, we used only participants who had attended the health promotion center, and this population might have tended to care more about their health. Third, we did not analyzed data as subgroups of renal dysfunction degree. Despite these limitations, this study has value in showing the clear correlation between decreased creatinine and lower BMD in healthy Korea women.

 XML Download