

 PDF
PDF ePub
ePub Citation
 Print
Print


INTRODUCTION
Ferritin is a universal intracellular protein that stores iron and releases it in a controlled fashion. Ferritin is essential for the regulation of iron homeostasis, and it reflects body iron stores and systemic inflammation [1]. Ferritin is found in most tissues as a cytosolic protein, but small amounts are secreted into the serum and function as an iron carrier. Serum ferritin (SF) serves to store iron in a non-toxic form, to deposit it in a safe form, and to transport iron to areas where it is required [2]. Free iron is toxic to cells because it acts as a catalyst in the formation of free radicals from reactive oxygen species via the Fenton reaction [3].
Ferritin levels usually have a direct correlation with the total amount of iron stored in the body. Taken together with serum iron and total iron-binding capacity (TIBC), SF is used as a diagnostic marker for iron-deficiency anemia [1]. Transferrin saturation (TSAT) is the ratio of serum iron and TIBC; this value indicates how much serum iron is actually bound. For example, a value of 15% TSAT means that 15% of transferrin iron-binding sites are being occupied by iron. In addition, ferritin levels may be artificially high in cases of chronic disease where ferritin is elevated in its capacity as an inflammatory acute phase protein and not as a marker for iron overload [1]. Thus, ferritin is also used as a marker for iron overload disorders, such as hemochromatosis or hemosiderosis, hemophagocytic lymphohistiocytosis, and Still's disease, in which ferritin levels may be abnormally elevated [1].
Recently, we reported that ferritin levels are associated with metabolic syndrome in children and adolescents [4]. In adults, ferritin levels are independently associated with a high prevalence of dyslipidemia [5], non-alcoholic fatty liver disease [6], insulin resistance [7], and stroke [8]. In addition, some studies have suggested that SF also has a role in the development of central obesity [9], hypertension [10], type 2 diabetes mellitus [11], and coronary artery disease [12]. Thus, establishing hematologic reference values, including those of ferritin, is critical to assessing the individual risk of these diseases.
The objectives of this study were as follows: 1) to establish normal reference values of SF and TSAT for healthy Korean children and adolescents; and 2) to determine changes in other confounders, such as iron intake, serum iron, hemoglobin, obesity, anemia, and menarche status, according to age, in a Korean national representative population.
MATERIALS AND METHODS
Study population and data collection
This study was based on data obtained from the Korea National Health and Nutrition Examination Survey (KNHANES-V; 2010–2012). KNHANES is a cross-sectional and national representative survey conducted by the Division of Chronic Disease Surveillance of the Korea Centers for Disease Control and Prevention (KCDCP). All participants underwent a health interview based on a standard questionnaire and laboratory examination, after providing informed consent in accordance with the National Health Enhancement Act. The Institutional Review Board of the KCDCP approved the KNHANES (No: 2010-02CON-21-C, 2011-02CON-06C, 2012-01EXP-01-2C).
The standardized questionnaire included data such as disease status (e.g., diagnosis and medication status), lifestyle variables (e.g., frequency and amount of alcohol consumption, smoking status), food intake (e.g., iron intake), and menarche status. Health examinations, including laboratory examinations, were conducted by trained medical staff and have been described elsewhere. In brief, weight was determined to the nearest 0.1 kg using a medical balance scale (GL-6000-20; CAS, Seoul, Korea); height was measured to the nearest 0.1 cm with a wall-mounted stadiometer (Seca 220; Seca, Hamburg, Germany). Body mass index (BMI) was calculated by dividing weight (kg) by height squared (m2). BMI ≥95th percentile or BMI value ≥25 was used to diagnose obesity.
Blood samples were drawn by a skilled nurse after participants had fasted overnight, and all samples were transported daily to the Central Laboratory (NEODIN Medical Institute, Seoul, Korea). SF levels were measured using an immunoradiometric assay with a 1470 WIZARD gamma counter (Perkin-Elmer, Turku, Finland). Serum iron levels were determined using a bathophenanthroline direct method, and TIBC was measured with a Hitachi Automatic Analyzer 7600 (Hitachi, Tokyo, Japan). The percentage transferrin saturation (TSAT) was calculated as the level of iron divided by the TIBC, multiplied by 100. Hemoglobin (Hb) levels were determined using the sodium lauryl sulfate-hemoglobin (cyanide-free) method. Anemia was defined as follows: Hb levels <11.5 g/dL for male and female participants aged <12 years; Hb levels <12 g/dL for male and female participants aged between 12 and 15 years; Hb levels <12.0 g/dL for female participants aged >15 years; and Hb levels<13 g/dL for male participants aged >15 years [13].
In this study, we selected participants aged 10–20 years with available laboratory test data (N=2,671). We excluded those with acute inflammatory status (WBC>11,000, N=13) and high ferritin (>300 ng/mL for males and 200 ng/mL for females, N=2). We also excluded participants with chronic diseases such as cancer, epilepsy, congenital heart disease, renal failure, tuberculosis, or hepatitis (N=13); current smokers more than 7 days/month (N=100); and alcohol drinkers more than 2 days/week (N=56). Thus, a total of 2,487 participants (1,311 males) were included in our final analysis.
Statistical analysis
All data are presented as mean±standard deviation (SD) for continuous variables and frequency percentage for categorical variables. To compare the means by gender and among age groups, the Student's t-test and ANOVA were used. Differences in the prevalence of confounders such as obesity and anemia were assessed using chi-square tests. First, we plotted mean serum values of iron intake, serum iron, hemoglobin, ferritin, TIBC, and TSAT for each gender, according to age. Age 10 years includes ages 10.00–10.99 years. Second, we calculated age- and gender-stratified means, SD, and percentile values for SF concentration and TSAT. Statistical analyses were performed using SPSS 17.0 for Windows (SPSS Inc., Chicago, IL, USA). P-values <0.05 were considered significant.
RESULTS
Characteristics of the study population
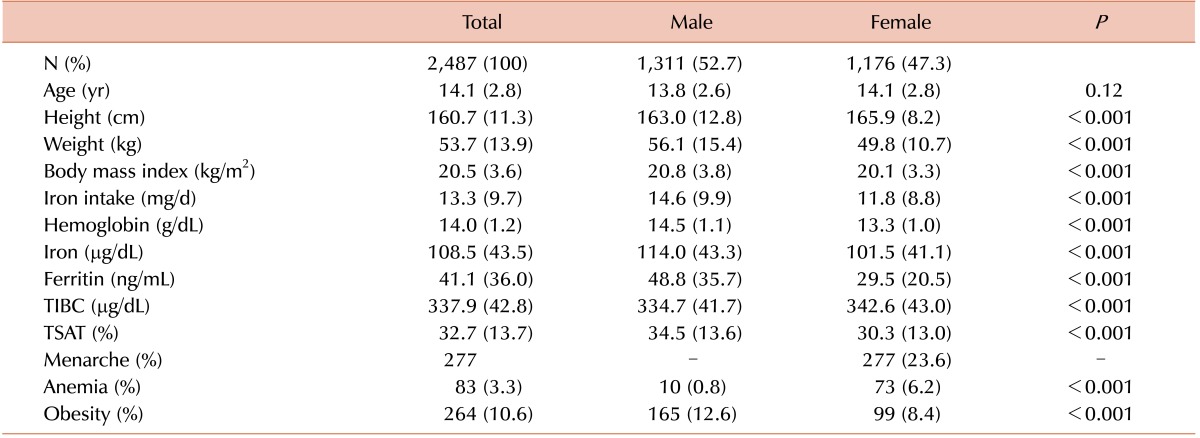
The anthropometric and laboratory characteristics of the study participants are summarized in Table 1. Overall, 2,487 participants (1,311 males and 1,176 females) were included in the present study. Mean height, weight, BMI, and iron intake among males was higher than those among female participants (all, P<0.01). Male participants also had higher values of Hb, serum iron, ferritin, and TSAT (all, P<0.01). Only TIBC among female participants was higher than that among males (P<0.01). There were 165 male participants with obesity and 99 females (P<0.01). Ten male participants had anemia, as did 73 females (P<0.01). There was a higher prevalence of obesity among male participants and higher prevalence of anemia among females (all, P<0.01). A total 277 (23.6%) female participants were post-menarche.
Serum iron, ferritin, total iron binding capacity, and percentage of transferrin saturation according to age and gender
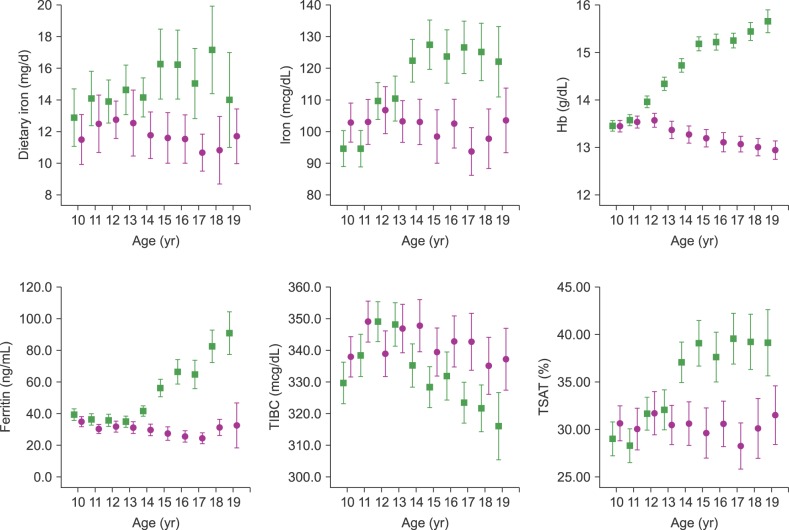
Changes in iron intake, serum iron, Hb, ferritin, TIBC, and TSAT according to age group, by gender, are presented in Fig. 1. Iron intake showed an increasing tendency according to age in male participants; there was no increasing tendency among females. There was no statistically significant difference according to age in both genders (P=0.461). Serum iron levels rose sharply after age 11 years and plateaued after age 14 years in males whereas iron levels remained constant or even decreased in females after age 14 years. Hb levels rose sharply after age 11 years and plateaued after age 15 years in males. In females, Hb levels were stable by age 12 years and decreased thereafter, with nadirs at ages 18 and 19 years. By contrast, SF levels exhibited a steep rise after age 14 years in males but remained constant until age 14 years and decreased thereafter in females. Thus, a significant gender difference for ferritin exists from age 14 years. Moreover, ferritin levels in male participants were approximately three times higher than those for females at age 19 years. TIBC was relatively stable, with peaks at 11 years in females and 12 years in males, and decreasing slightly thereafter. TSAT values in males increased significantly after age 14 years whereas they remained relatively constant in females. Thus, a significant gender difference for TSAT exists from age 14 years.
Impact of obesity, anemia, and menarche status on serum indices
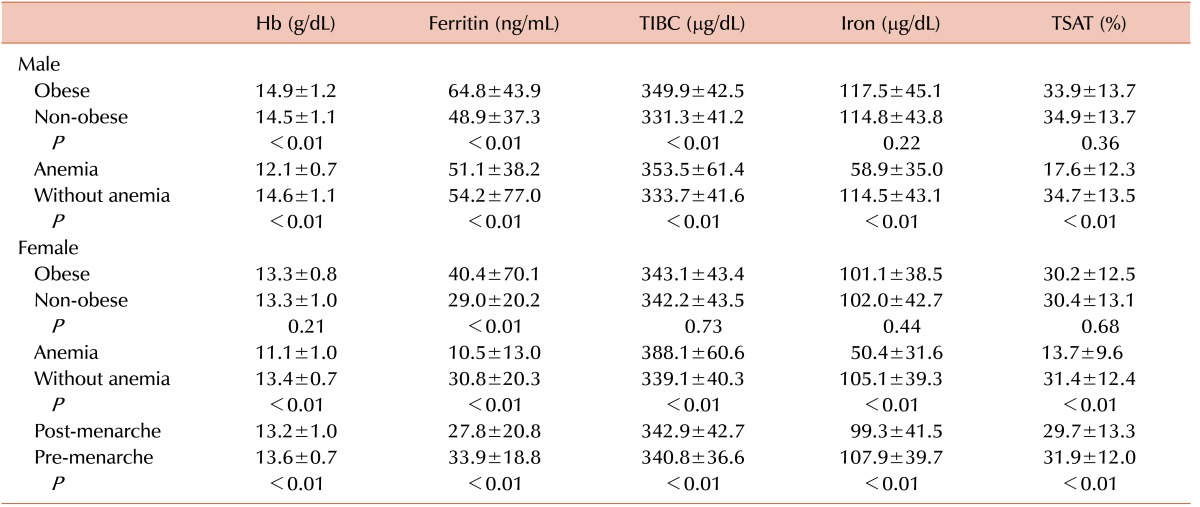
The impact of obesity, anemia, and menarche status on serum Hb, ferritin, TIBC, iron, and TSAT is presented in Table 2. Levels of Hb (14.9±1.2 vs. 14.5±1.1 g/dL), ferritin (64.8±43.9 vs. 48.9±37.3 ng/mL), and TIBC (349.9±42.5 vs. 331.3±41.2 µg/dL) in obese male participants were higher than those in non-obese males (all, P<0.01). Only ferritin levels were higher in obese than in non-obese female participants (40.4±70.1 vs. 29.0±20.2 ng/mL). Levels of Hb (13.3±0.8 vs. 13.3±1.0 g/dL) and TIBC (343.1±43.4 vs. 342.2±43.5 µg/dL) were nearly the same in obese and non-obese females. Iron intake, serum iron, and TSAT were not significantly different according to obesity status (iron intake: 15.4±12.2 vs. 14.6±9.9 mg/d, 11.5±6.9 vs. 11.9±8.9 mg/d; serum iron: 117.5±45.1 vs. 114.8±43.8 µg/dL, 101.1±38.5 vs. 102.0±42.7 µg/dL; TSAT: 33.9±13.7 vs. 34.9±13.7%, 30.2±12.5 vs. 30.4±13.1% in obese and non-obese males and females, respectively).
Levels of Hb (12.1±0.7 vs. 14.6±1.1 g/dL), iron (58.9±35.0 vs. 114.5±43.1 µg/dL), and TSAT (17.6±12.3 vs. 34.7±13.5%) in male participants with anemia were lower than in those without anemia (all, P<0.01). Levels of Hb (11.1±1.0 vs. 13.4±0.7 g/dL), iron (50.4±31.6 vs. 105.1±39.3 µg/dL), ferritin (10.5±13.0 vs. 30.8±20.3 ng/mL), and TSAT (13.7±9.6 vs. 31.4±12.4%) in females with anemia were lower than in those without anemia (all, P<0.01). TIBC levels were higher in both male (353.5±61.4 vs. 333.7±41.6 µg/dL, P<0.01) and female (388.1±60.6 vs. 339.1±40.3 µg/dL, P<0.01) participants with anemia than in those without anemia.
Levels of Hb (13.2±1.0 vs. 13.6±0.7 g/dL), iron (99.3±41.5 vs. 107.9±39.7 µg/dL), ferritin (27.8±20.8 vs. 33.9±18.8 ng/mL), and TSAT (29.7±13.3 vs. 31.9±12.0%) in female participants who were post-menarche were lower than in those who were pre-menarche (all, P<0.01). TIBC levels did not differ according to menarche status (342.9±42.7 vs. 340.8±36.6 µg/dL).
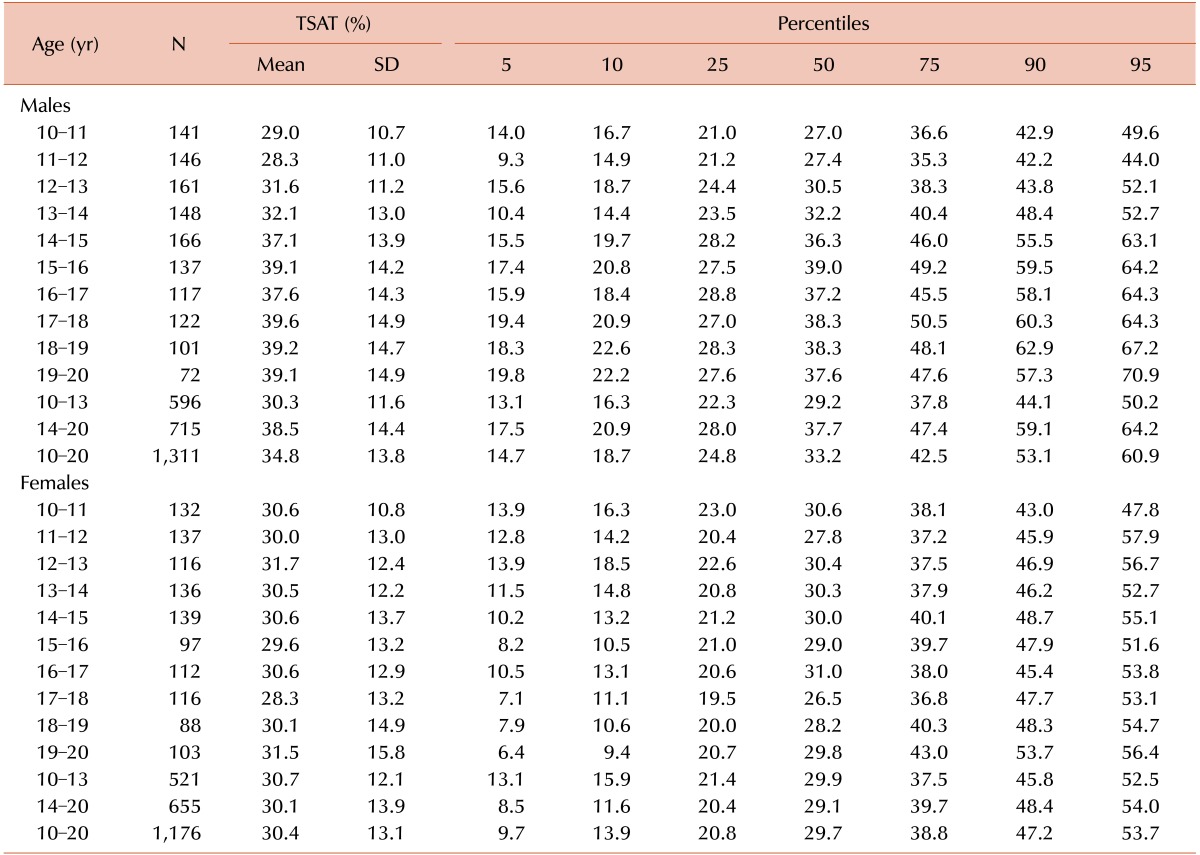
Reference percentiles for serum ferritin (SF) and percentage transferrin saturation (TSAT)
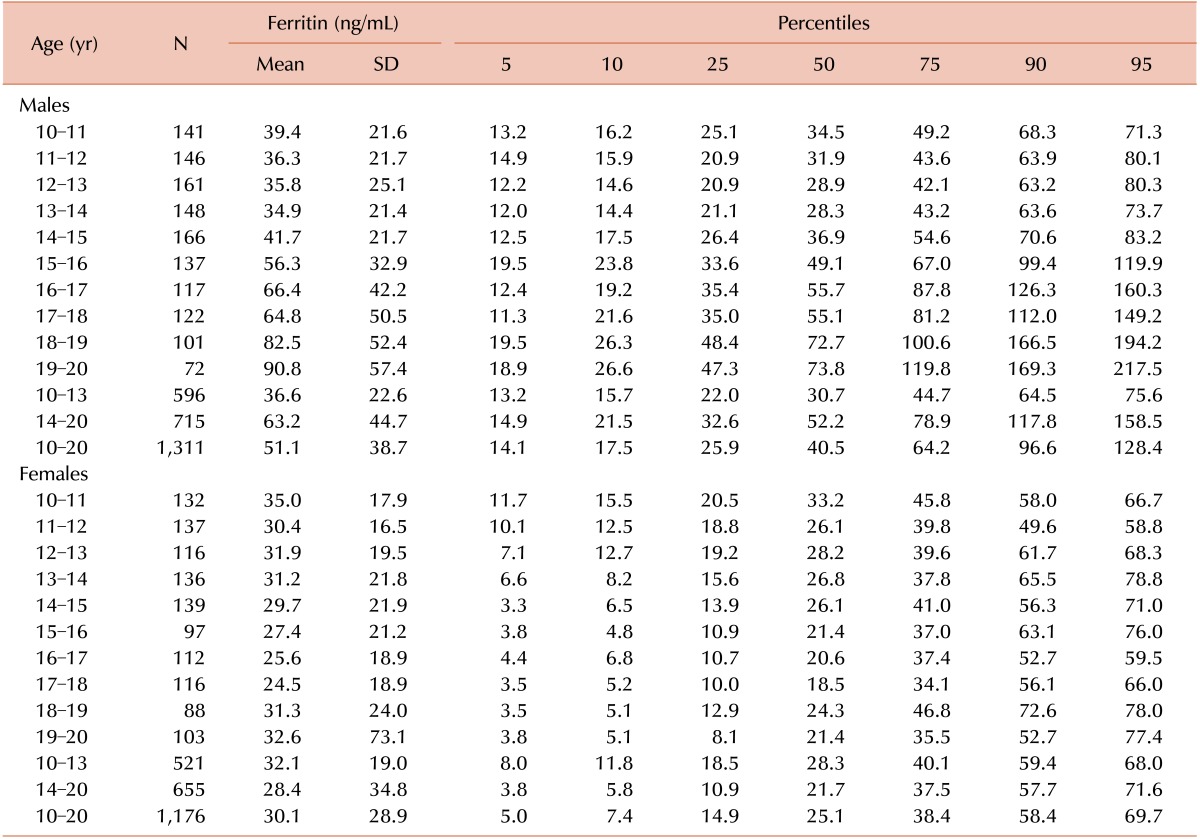
Age- and gender-stratified means, SD, and percentile values for SF concentration are presented in Table 3. The centiles tended to be relatively constant for males aged 10–14 years and trended upward thereafter. On the other hand, the centiles trended downward in females up to age 15 years and remained constant thereafter. Age- and gender-stratified means, SD, and percentile values for TSAT are presented in Table 4. We refer to age groups 10–13 years and 14–20 years separately because there was no statically significant difference within each age group. The mean and higher centiles of TSAT values tended to increase slightly with increasing age after 14 years in males and remained constant in females. The lower centiles tended to be stable in both genders.
DISCUSSION
In this study, we constructed reference centiles for serum ferritin (SF) and percent of transferrin saturation (TSAT) in healthy Korean children and adolescents aged 10 to 20 years. We found that differences in SF and TSAT levels between males and females begin during this period. In male participants, SF levels tended to increase sharply with progression to puberty. In contrast, SF levels remained constant until age 14 years in female participants, and decreased thereafter. We also found that other confounders such as obesity, anemia, and menarche might influence SF levels.
A reference range for hematologic variables is useful to characterize the health status of a population and to assess individual values relative to a reference population. However, hematologic variables, such as SF and TSAT levels, differ according to age, gender, race, ethnicity, and lifestyle [14]. Thus, appropriate hematologic reference values should be established using a healthy population of a specific ethnicity, particularly for children and adolescents. Studies among adults have reported that SF levels increase with age from the 20s to 50s in men, and these levels abruptly increase in women after menopause [15161718]. In the National Health and Nutrition Examination Survey (NHANES) II and III, SF levels were found to be higher in males than in females for all age groups [14]. In men, SF rose sharply and reached maximum levels in the 30- and 40-year-old age group [17]; thereafter, levels plateaued until approximately age 70 years, after which they declined. In women, ferritin levels remained relatively low until menopause, after which they rose but not to levels as high as in men [18]. Chełchowska et al. reported that the lowest values of SF in women were observed under the age of 52 years and subsequently between the ages of 25 and 35 years [16]. Mean ferritin levels in males are always higher in blacks than in whites or Hispanics. For Asian people, Hughes [19] reported differences in SF levels among Chinese, Malay, and Indian populations aged 30–69 years, in descending order of SF concentration. Compared with our study, the SF concentrations in the Korean population are lower than those in the above three Asian populations.
In our study, we found that clear gender differences begin around age 14–15 years. SF levels exhibited a steep rise after age 14 years in male participants until age 19 years. TSAT values in males increased significantly after age 14 years but remained relatively constant in females, indicating a significant gender difference of TSAT beginning at age 14 years. Our finding agrees with that of Milman et al. [20] in a population survey comprising 436 Danish schoolchildren (219 boys, 217 girls) aged 7 to 17 years. Median ferritin values were similar in boys and girls aged 7–13 years, but boys aged 14–17 years had significantly higher values than girls of similar age. Danish boys had stable median ferritin values from age 7–15 years, after which a significant increase was seen. Danish girls had unchanged median ferritin values from age 7–11 years, after which a significant decrease was observed from age 12–17 years.
The exact mechanism of the gender difference in ferritin level is unknown. The most frequently proposed mechanism is related to the high prevalence of iron deficiency in premenopausal women and deficient iron intake among teenage girls [2122]. In our study and others, women had relatively low iron intake and low serum iron levels after menarche. Premenopausal women have low iron levels caused by menstrual blood loss and pregnancy [1823]. We also previously proposed a relationship between vitamin D deficiency and iron-deficiency anemia. Low vitamin D level is independently associated with an increased risk for anemia and iron deficiency [24]. Female participants had a higher prevalence of vitamin D deficiency than male participants; in addition, the odds ratios for iron-deficiency anemia for participants with low vitamin D levels were significant only in female participants; therefore, gender differences exist for this association. Although the exact reason for these differences is not known, gender hormones may play a role through hepcidin, a recently discovered peptide hormone produced by the liver that regulates the absorption, tissue distribution, and extracellular concentration of iron by suppressing ferroportin-mediated export of cellular iron [25]. Therefore, high hepcidin levels cause decreased serum iron levels. Hepcidin expression has been found to be higher in females than in males; the expression of hepcidin is reinforced by estrogen whereas testosterone suppresses hepcidin via testosterone-induced erythrocytosis [2627].
We note some limitations to this study. First, the participants included in the study were limited to children and adolescents aged 10–20 years. Second, ferritin should be adjusted by C-reactive protein as ferritin is an acute phase reactant. Instead, we adjusted by WBC level, and most participants in KNHANES were healthy. Lastly, the exclusion criteria may not have completely excluded individuals with hereditary hemochromatosis. Further studies are needed to establish hematologic reference values for children younger than 10 years and to identify genetic variations.
In conclusion, we established age- and gender-specific reference values for ferritin and TSAT levels, using data from the KNHANES-V. Our results are based on a comprehensive and representative sample comprising Korean children and adolescents and therefore could be used as a national reference standard, considering the distinctive characteristics observed in this study.
 XML Download