Abstract
Background
Anemia of chronic disease (ACD) and iron deficiency anemia (IDA) are the two most prevalent forms of anemia having interrelated characteristics. Hepcidin, a newly introduced biomarker for assessment of iron status, is a homeostatic regulator of iron metabolism. We investigated the role of hepcidin and other conventional iron parameters to assess iron status among children with ACD and IDA. We also identified children with ACD who developed iron deficiency (ID).
Methods
The study was undertaken in anemic children with 30 cases each of ACD and IDA along with 30 age and sex-matched controls. The ACD cases were subdivided into pure ACD and ACD with coexistent ID. All cases were subjected to following tests: complete blood count with peripheral smear, serum C-reactive protein, serum interleukin-6, iron studies, serum soluble transferrin receptor (sTfR), and serum hepcidin.
Results
The mean serum hepcidin concentration was significantly increased in pure ACD patients (143.85±42.76 ng/mL) as compared to those in IDA patients (6.01±2.83 ng/mL, P < 0.001) and controls (24.96±9.09 ng/mL, P <0.001). Also, compared to pure ACD patients [normal sTfR levels (<3 µg/mL)], the serum hepcidin concentration was reduced significantly in ACD patients with ID [high sTfR levels (≥3 µg/mL)] with a mean of 10.0±2.97 ng/mL.
Anemia of chronic disease (ACD) and iron deficiency anemia (IDA) are the two most common types of anemia worldwide. ACD is more prevalent among hospitalized patients. Both ACD and IDA are characterized by hypoferremia. The functional iron deficiency (ID) present in patients with ACD can be complicated by true ID. Differentiation between ACD and ACD with coexistent ID is important clinically because iron supplementation is beneficial for ACD with coexistent ID while it may be deleterious for anemic patients with underlying infections [1]. However, in clinical practice, it is difficult to differentiate between ACD, IDA, and ACD with coexistent ID by routine conventional laboratory tests. Serum ferritin, which has been used traditionally to diagnose iron deficiency as its concentration is proportional to iron stores, has no lower reference limit mentioned for diagnosing coexisting ID in ACD patients. Also, soluble transferrin receptor (sTfR) reflects iron stores proportional to the degree of iron demand by erythroblasts but has not been widely used in clinical practice [1]. Hence, there is a clear need for accurate, non-invasive, and less laborious biomarkers.
Hepcidin is the key regulator of systemic iron homeostasis. It is also a type II acute phase peptide encoded by the human antimicrobial peptide (HAMP) gene [2]. It was discovered in 2000 by Krause et al. [3] and named hepcidin by Park et al. [4] in the same year. Hepcidin affects cellular iron homeostasis after binding to the iron export protein ferroportin, resulting in its degradation, thereby causing blockage of iron absorption from enterocytes and release of iron from monocytes/macrophages to circulation [5]. This effect is further aggravated in inflammatory conditions by the stimulation of hepcidin production by increased cytokines, prominently interleukin (IL)-6 [67]. Chronic hepcidin-mediated iron restriction underlies the pathogenesis of ACD. This study assessed the utility of hepcidin to detect iron status among ACD and IDA patients and to identify patients with ACD and coexistent ID.
The study was conducted in the Department of Pathology, Lady Hardinge Medical College, and the Department of Paediatrics, Kalawati Saran Children Hospital, New Delhi. The study group comprised of children 6 months to 17 years of age diagnosed with anemia, based on World Health Organization (WHO) criterion (2001) [8].
Thirty cases of anemia of chronic disease with evidence of the chronic infection or autoimmune disease for more than one month and increased serum C-reactive protein level (CRP >10 mg/L) were included (Group A). None of these patients had received treatment with iron, blood transfusions, or recombinant human erythropoietin for at least four months before study entry.
Patients with ACD were further divided into two subgroups based on their sTfR levels. ACD with normal sTfR values (<3 µg/mL) was defined as subgroup A1 (i.e., pure ACD patients) while ACD with high sTfR values (≥3 µg/mL) was grouped into subgroup A2 (i.e., patients with ACD and coexistent iron deficiency) [910].
A similar number of cases of iron deficiency anemia with serum ferritin concentration less than 12 µg/dL (for children <5 yr) and less than 15 µg/dL (for children >5 yr) were enrolled (Group B). Patients who had received blood transfusions, were on hematinics, with any history suggestive of inflammatory conditions, or CRP level >10 mg/L were excluded.
Finally, 30 age and gender-matched controls were enrolled. Comparisons were made between four groups: pure ACD (subgroup A1), ACD with coexistent ID (subgroup A2), IDA, and controls. Overnight fasting blood samples were placed in ethylenediaminetetraacetic acid vials (2 mL) and iron-free plastic tubes (4–5 mL). Serum was separated and stored in aliquots at -70℃. Both cases and controls underwent the following tests: complete blood count with red cell indices using a Sysmex KX21 (Kobe, Japan) autoanalyser and peripheral smear, serum CRP by enzyme-linked immunosorbent assay (ELISA) (Calbiotech, CA) and serum IL-6 by ELISA (GENPROBE, France) along with iron studies (serum iron and total iron binding capacity [TIBC] by colorimetric method [Giesse Diagnostics, Italy] and serum ferritin by ELISA [Calbiotech, CA]). sTfR and serum hepcidin concentrations were measured using ELISA (DRG kits, Germany).
Statistical analysis was performed using SPSS Statistics for Windows, version 17.0. Continuous variables were presented as mean±SD, while categorical variables were presented as absolute numbers and percentage. Normally distributed continuous variables were compared using analysis of variance (ANOVA). Kruskal-Wallis tests were used to assess those variables that were not normally distributed and further comparisons were made by Mann-Whitney U tests. Categorical variables were analyzed by chi-square tests. Spearman's Correlation was also used among various variables. For all statistical tests, P-values less than 0.05 were taken to indicate a significant difference.
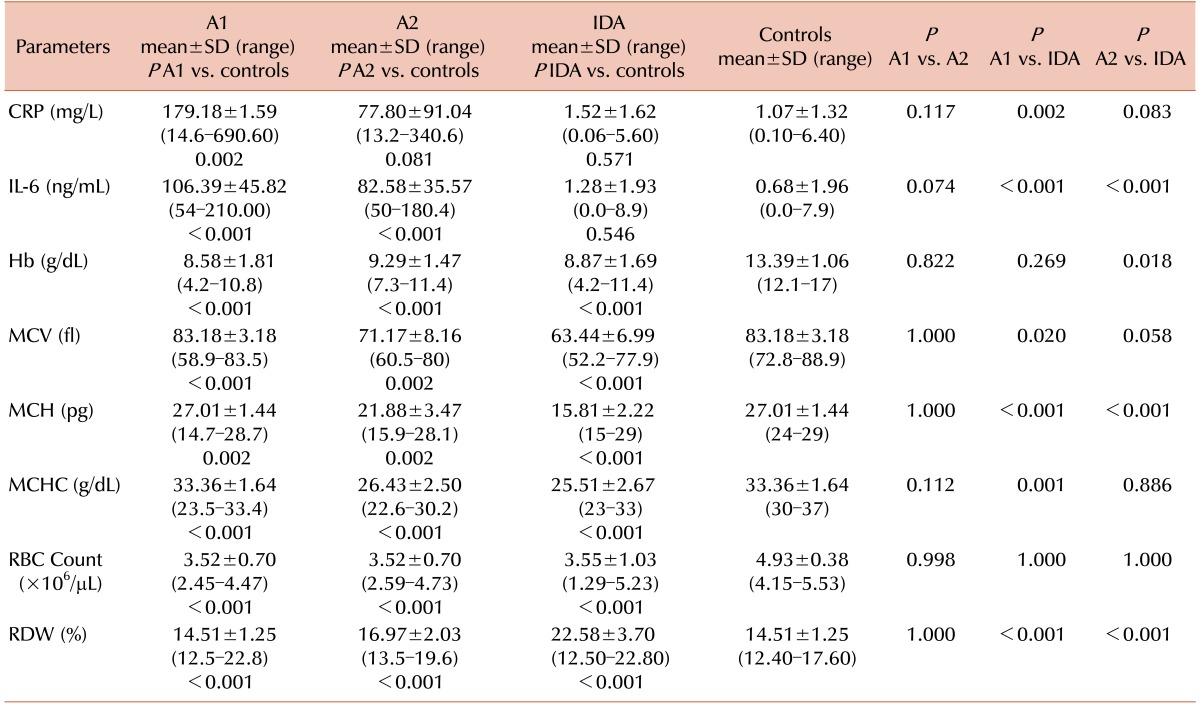
A total of 90 patients were included in our study. The mean ages of the pure ACD, ACD with coexistent ID, IDA, and control groups were 5.89±5.44, 6.54±4.31, 5.39±5.14 and 7±4.04 years, respectively. Mean CRP level was significantly higher in patients with pure ACD (213.23±204.06 mg/L) compared to those in the controls (1.07±1.32 mg/L) (P <0.001) and IDA patients (1.52±1.62 mg/L) (P <0.001) (Table 1). However, CRP levels in pure ACD patients did not show a statistical difference from that in ACD patients with coexistent ID. Mean IL-6 levels were also higher in the pure ACD group (122.27±45.78 ng/L) compared to those in the IDA (1.28±1.93 ng/L) and control (0.68±1.96 ng/L) groups, a statistically significant difference (Table 1). ACD patients with coexistent ID had mean IL-6 levels of 82.58±35.57 ng/L, which did not differ significantly compared to that in patients with pure ACD (P =1.000).
The hematological parameters and results of iron studies of healthy subjects and cases are shown in Tables 1 and 2. Hemoglobin (Hb), mean cell volume (MCV), mean cell hemoglobin (MCH), mean cell hemoglobin concentration (MCHC), and red blood cell (RBC) count were significantly lower in the pure ACD, ACD with coexistent ID, and IDA group compared to those in controls (P <0.001), while red cell distribution width (RDW) was increased compared to that in controls (P <0.001). MCV, MCH, and MCHC were more significantly decreased in the IDA as compared to the pure ACD groups (P <0.05). The RDW increased much more in the IDA patients as compared that in those with pure ACD and ACD with coexistent ID (P <0.001) (Table 1).
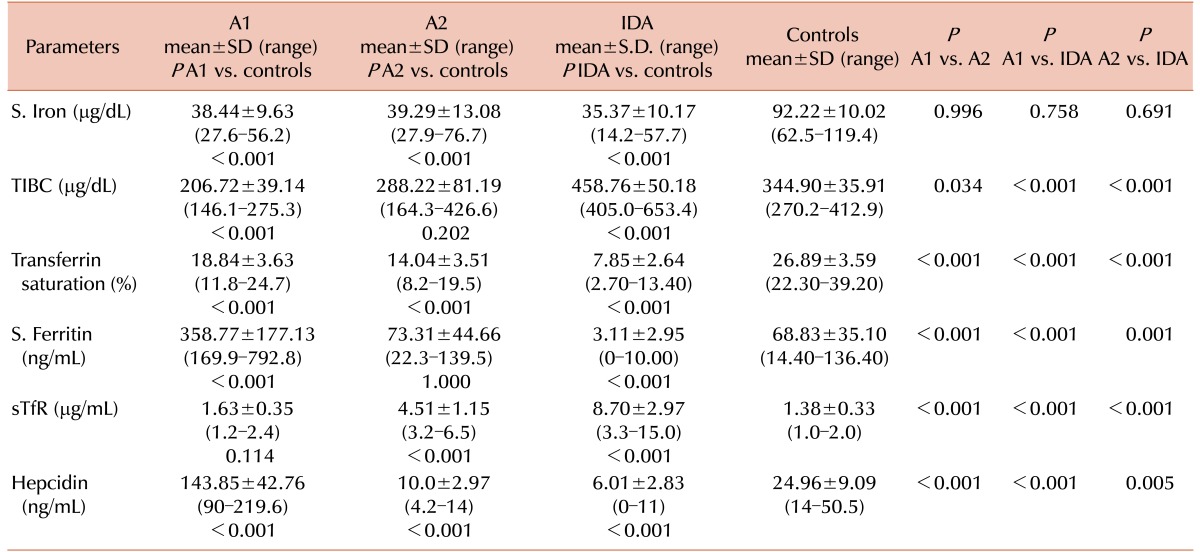
Serum iron concentrations were lower in the pure ACD, ACD with coexistent ID, and IDA groups compared to that in the control group (P <0.001). Although the difference was greater in the IDA as compared to the pure ACD and ACD with coexistent ID groups, the difference was not statistically significant (P =0.756 and 0.691, respectively). TIBC was significantly lower in the pure ACD group compared to that in the control group (P <0.001), while it was significantly higher in the IDA groups. Transferrin saturation (TS%) was lower in the pure ACD, ACD with coexistent ID, and IDA groups but the difference was greater in the IDA group compared to those in the pure ACD and ACD with coexistent ID groups (P <0.001). The serum ferritin concentration was higher in the pure ACD and ACD with coexistent ID groups as compared to that in the IDA group (P <0.001). The serum ferritin concentration was significantly higher in the pure ACD group as compared to that in the ACD with coexistent ID groups (P <0.001). In cases of ACD with coexistent ID, serum ferritin concentrations ranged from 22.3–139.5 ng/mL, which did not differ statistically from those of the controls (P =1.000) (Table 2).
The mean sTfR concentration in children with pure ACD was 1.63±0.35 µg/mL, significantly higher than that in the controls (1.38±0.33 µg/mL, P <0.001). In IDA and ACD patients with coexistent ID, the mean sTfR concentrations were 8.70±2.97 and 4.51±1.15 µg/mL, respectively, significantly higher than those in the controls (P <0.001) and pure ACD patients (P <0.001) (Table 2)
The serum hepcidin concentrations in the pure ACD group varied from 90–219.6 ng/mL with a mean value of 143.85±42.76 ng/mL. The mean hepcidin levels in the control group ranged from 14–50.5 ng/mL (mean 24.96±9.09 ng/mL), a statistically significant difference (P <0.001). Serum hepcidin levels in the IDA group ranged from 0–11 ng/mL with a mean value of 6.01±2.83 ng/mL, which was significantly lower than those of the control, pure ACD, and ACD with coexistent ID groups (P <0.05) (Table 2). The mean hepcidin levels in the ACD with coexistent ID group was 10.0±2.97 ng/mL, significantly different from those of the pure ACD patients (P <0.001) (Table 2). All 12 patients with ACD and coexistent ID had significantly lower hepcidin levels compared to those in the controls (P <0.001).
In the IDA group, hepcidin levels were positively correlated with MCV (r=0.058, P =0.761) and serum iron concentration (r=0.136, P =0.473), and negatively correlated with RDW (r=-0.056, P =0.770) and TIBC (r=-0.033, P =0.864). Similarly, in pure ACD patients, hepcidin levels were negatively correlated with RDW (r=-0.056), serum iron concentration (r=-0.223), and TIBC (r=-0.142), but the differences were not statistically significant.
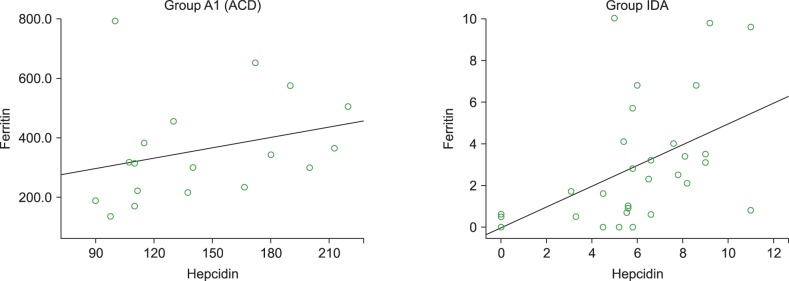
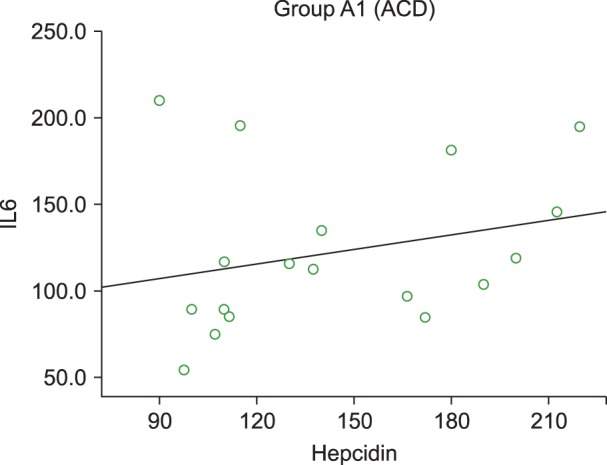
Serum hepcidin levels were positively correlated with serum ferritin levels in the pure ACD (r=0.415) and IDA (r=0.552) groups (Fig. 1) but the difference was statistically significant only in the IDA group (P =0.002). In the pure ACD group, hepcidin levels were negatively correlated with sTfR (P =0.06, r=0.451). In the IDA group, hepcidin levels were lower while sTfR was higher, but no significant correlation between hepcidin and sTfR was observed (P =0.121). Serum hepcidin levels were also positively correlated with IL-6 concentration in the pure ACD group (P =0.156, r=0.349) (Fig. 2) but negatively correlated in the IDA group, although the association was not statistically significant (P =0.495, r=-0.13).
Hepcidin is a key regulator of systemic iron homeostasis. Its expression is induced by inflammatory stimuli and suppressed in iron deficiency. This study evaluated the usefulness of hepcidin assays for the assessment of iron status in patients with ACD and IDA. Hepcidin levels were significantly higher in pure ACD and lower in IDA as compared to controls. Our results were in concordance with previous studies [1112]. However, Geerts et al. [13] did not observe a significant difference between two groups. The reason for this was not clear, although an assay-related problem or a study group comprising vulnerable geriatric patients could explain these results. Casals-Pascual et al. [14] found increased levels of serum hepcidin in children infected with acute malaria and Hb of 7.0–9.9 g/dL. Children with Hb <5.0 g/dL had reduced serum hepcidin levels compared to those in children with Hb >5.0 g/dL (P <0.05). Malaria infection stimulates hepcidin, which is associated with a reduced reticulocyte response due to iron restriction in the developing erythroid precursors. However, hepcidin secretion is blunted in severe malarial anemia due to ineffective erythropoietic response along with hypoxemia, which might have contributed to a further decrease in hepcidin concentration.
Hepcidin levels were positively correlated with IL-6 levels in patients with pure ACD, thus proving the role of IL-6 in the stimulation of hepcidin production. Nemeth et al. [6] found that chronic stimulation of the IL-6–hepcidin axis by inflammation is responsible for iron-restricted erythropoiesis. Similar findings were reported by Suega [15], who found that IL-6 could influence the development of anemia through hepcidin.
In the present series, hepcidin levels were positively correlated with serum ferritin concentrations and significantly negatively correlated with sTfR in both pure ACD and IDA patients. Also, hepcidin levels were negatively correlated with TIBC in both pure ACD and IDA patients. Choi et al. [16] observed a significant positive correlation between log hepcidin levels and log ferritin and a significant negative correlation between TIBC and sTfR in children with ID (P <0.0001). Elgari et al. [17] reported a positive correlation between serum hepcidin and serum ferritin levels.
The detection of absolute iron deficiency in ACD patients is a clinical challenge since conventional iron status parameters; e.g., TIBC and serum ferritin, are influenced by acute-phase responses. The TIBC in the ACD with coexistent IDA patients varied from 164.3–426.6 µg/dL, with 16.7% (3/18) of patients having overlapping values with those of the controls (270.2–412.9 µg/dL). The TIBC levels in patients with pure ACD (146.1–275.3 µg/dL) overlapped with those of controls in 50% (6/12) of cases. Similarly, the serum ferritin concentrations in ACD patients with coexistent IDA ranged from 22.3-139.5 ng/mL, which did not differ significantly from those of the controls (14.4–136.4 ng/mL, P =0.995). However, serum hepcidin concentrations in pure ACD patients ranged from 90-219.6 ng/mL and from 4.2–14 ng/mL in patients with ACD and coexistent IDA (controls, 14–50.5 ng/mL). There was no overlap in the hepcidin levels in both ACD subgroups and controls, making it a more reliable marker for diagnosing ID in ACD patients compared to TIBC and ferritin levels. Similar findings were observed by Theurl et al. [1] and van Santan et al. [12]. Hepcidin levels may, therefore, be more useful than the standard iron parameters in distinguishing patients with pure ACD from those with combined ACD and IDA. The detection of iron deficiency in patients with ACD is of clinical relevance; since IDA is treatable, diagnosis may preclude the need for further investigations into the cause of the anemia, and it may prevent unnecessary prescription of iron supplementation.
sTfR reflects iron stores linearly to the degree of iron demand of erythroblasts, but inflammatory stimuli might suppress its concentrations by inhibiting erythropoietic activity [18]. Therefore, hepcidin might be a better indicator of iron deficiency in ACD patients, which may help in personalizing iron therapy to avoid delays or unnecessary/harmful treatment [19]. Also, interventions targeting the hepcidin IL-6 pathway could offer novel therapeutic opportunities for iron disorders [52021].
In conclusion, hepcidin is a promising tool to be included in the present battery of diagnostic tests for iron status. It has a definitive role in identifying an iron deficiency in ACD patients and in differentiating ACD from IDA patients. In addition, newer drugs that target the hepcidin ferroportin axis or cytokines which stimulate hepcidin transcription might be useful for the treatment of anemia of chronic disease.
References
1. Theurl I, Aigner E, Theurl M, et al. Regulation of iron homeostasis in anemia of chronic disease and iron deficiency anemia: diagnostic and therapeutic implications. Blood. 2009; 113:5277–5286. PMID: 19293425.

2. Kemna EH, Tjalsma H, Willems HL, Swinkels DW. Hepcidin: from discovery to differential diagnosis. Haematologica. 2008; 93:90–97. PMID: 18166790.

3. Krause A, Neitz S, Mägert HJ, et al. LEAP-1, a novel highly disulfide-bonded human peptide, exhibits antimicrobial activity. FEBS Lett. 2000; 480:147–150. PMID: 11034317.

4. Park CH, Valore EV, Waring AJ, Ganz T. Hepcidin, a urinary antimicrobial peptide synthesized in the liver. J Biol Chem. 2001; 276:7806–7810. PMID: 11113131.

5. D'Angelo G. Role of hepcidin in the pathophysiology and diagnosis of anemia. Blood Res. 2013; 48:10–15. PMID: 23589789.
6. Nemeth E, Rivera S, Gabayan V, et al. IL-6 mediates hypoferremia of inflammation by inducing the synthesis of the iron regulatory hormone hepcidin. J Clin Invest. 2004; 113:1271–1276. PMID: 15124018.

7. Wrighting DM, Andrews NC. Interleukin-6 induces hepcidin expression through STAT3. Blood. 2006; 108:3204–3209. PMID: 16835372.

8. World Health Organization. Iron deficiency anaemia assessment, prevention, and control: A guide for programme managers. Geneva, Switzerland: World Health Organization;2001.
9. Jain S, Narayan S, Chandra J, Sharma S, Jain S, Malhan P. Evaluation of serum transferrin receptor and sTfR ferritin indices in diagnosing and differentiating iron deficiency anemia from anemia of chronic disease. Indian J Pediatr. 2010; 77:179–183. PMID: 20091370.

10. Marković M, Majkić-Singh N, Subota V. Usefulness of soluble transferrin receptor and ferritin in iron deficiency and chronic disease. Scand J Clin Lab Invest. 2005; 65:571–576. PMID: 16271988.

11. Demirag MD, Haznedaroglu S, Sancak B, et al. Circulating hepcidin in the crossroads of anemia and inflammation associated with rheumatoid arthritis. Intern Med. 2009; 48:421–426. PMID: 19293540.

12. van Santen S, van Dongen-Lases EC, de Vegt F, et al. Hepcidin and hemoglobin content parameters in the diagnosis of iron deficiency in rheumatoid arthritis patients with anemia. Arthritis Rheum. 2011; 63:3672–3680. PMID: 22127690.

13. Geerts I, Vermeersch P, Joosten E. Evaluation of the first commercial hepcidin ELISA for the differential diagnosis of anemia of chronic disease and iron deficiency anemia in hospitalized geriatric patients. ISRN Hematol. 2012; 2012:567491. PMID: 22461996.

14. Casals-Pascual C, Huang H, Lakhal-Littleton S, et al. Hepcidin demonstrates a biphasic association with anemia in acute Plasmodium falciparum malaria. Haematologica. 2012; 97:1695–1698. PMID: 22689680.

15. Suega K. Role of hepcidin in mechanism of anemia chronic disease patients. Bali Med J. 2014; 3:89–96.
16. Choi HS, Song SH, Lee JH, Kim HJ, Yang HR. Serum hepcidin levels and iron parameters in children with iron deficiency. Korean J Hematol. 2012; 47:286–292. PMID: 23320008.

17. Elgari MM, Al-Oufi F, alSalmi M, Kurdi M, Ibrahim NA, Elmugadam A. Role of serum hepcidin levels in the diagnosis of iron deficiency anemia in children in Saudi Arabia. Am J Res Commun. 2015; 3:24–30.
18. Pasricha SR, McQuilten Z, Westerman M, et al. Serum hepcidin as a diagnostic test of iron deficiency in premenopausal female blood donors. Haematologica. 2011; 96:1099–1105. PMID: 21508121.

19. Girelli D, Nemeth E, Swinkels DW. Hepcidin in the diagnosis of iron disorders. Blood. 2016; 127:2809–2813. PMID: 27044621.

20. Song SN, Tomosugi N, Kawabata H, Ishikawa T, Nishikawa T, Yoshizaki K. Down-regulation of hepcidin resulting from long-term treatment with an anti-IL-6 receptor antibody (tocilizumab) improves anemia of inflammation in multicentric Castleman disease. Blood. 2010; 116:3627–3634. PMID: 20644113.

21. Sasu BJ, Cooke KS, Arvedson TL, et al. Antihepcidin antibody treatment modulates iron metabolism and is effective in a mouse model of inflammation-induced anemia. Blood. 2010; 115:3616–3624. PMID: 20053755.

Table 1
Comparison of inflammatory markers and hematological parameters in pure ACD (A1), ACD with coexistent ID (A2), IDA, and controls.

Abbreviations: ACD, anemia of chronic disease; CRP, C-reactive protein; Hb, hemoglobin; IDA, iron deficiency anemia; IL, interleukin; MCH, mean cell hemoglobin; MCHC, mean cell hemoglobin concentration; MCV, mean cell volume; RBC, red blood cell; RDW, red cell distribution width; SD, standard deviation.


 PDF
PDF ePub
ePub Citation
 Print
Print


 XML Download