

 PDF
PDF ePub
ePub Citation
 Print
Print


INTRODUCTION
Since the discovery of the ABO blood group by Landsteiner, different blood typing systems have been devised. Blood group antigens are integrated parts of the red blood cell (RBC) membrane and have many essential functions (membrane transporters and protein canals, ligand receptors, adhesion molecules, enzymes, and structural proteins). These surface antigens also have different biochemical compositions [1].
According to The International Society of Blood Transfusion (ISBT), there are 287 antigens within the 33 blood group systems and 42 antigens in Collections (low and high incidence antigens) [2]. The knowledge of RBC antigen phenotype frequencies in a population is helpful in terms of their ethnic distribution, in creating a donor data bank for the preparation of indigenous cell panels and for providing antigen-negative compatible blood to patients with multiple alloantibodies [3].
Although blood transfusions can be life saving for a number of patients, they are not without risks. In addition to risks such as transfusion-transmissible diseases (TTD) caused by donor viruses, parasites, or bacterial contaminants of blood products, there is also a risk of alloimmunization due to donor-recipient antigen phenotype disparity. Still, RBCs for blood transfusion are mostly only matched for the major antigens, ABO and D, an approach that is considered safe and cost-effective, except in chronic transfusion recipients (e.g. thalassemia), who additionally require extended matching for minor antigens.
Proper selection of mandatory and additional blood grouping tests should consider the local needs based on the local antigenic profile and pathology of the population. Antigenic frequencies in Indian donors differ from the widely available data of European and American countries. Thus, the aim of this study was to tabulate regional blood group antigenic frequencies.
Go to : 
MATERIALS AND METHODS
Subjects
ABO and Rh blood grouping was performed on 9,280 continuous voluntary and replacement donors present at the blood bank to donate. For other rare blood groups, 508 ACD blood samples were obtained from the donors at the Blood Bank of the Department of Transfusion Medicine, All India Institute of Medical Sciences (AIIMS), New Delhi, India. This study was performed on 430 men and 78 women (age range, 18-55 years). Most of the donors hailed from Delhi (India) and surrounding states and represented the north Indian population.
Methods
ABO and RhD groups were determined using QWALYS 3 (DIAGAST, France), a fully automated and high-throughput system that uses EM technology. Rare blood group antigens were determined in a blood transfusion organization center by tube method using kits supplied by Bio-Rad, USA. Antigens in the main blood group systems, including ABO, Rh (D, C, E, c, and e antigens), MNSs (M, N, S, and s antigens), Lutheran (Lua and Lub antigens), P1 antigen, Kell (K, k antigens), Lewis (Lea and Leb antigens), Duffy (Fya and Fyb antigens), and Kidd (Jka and Jkb antigens) were identified. According to manufacturer's instructions, antigens were typed either directly by adding antisera to 3-5% of donor RBC suspensions or indirectly by using an indirect antiglobulin test. Positive and negative control cells and Coombs' control cells were used as quality controls.
Go to :
RESULTS
We determined minor blood group antigens in 508 donors composed of 87.4% male and 12.6% female donors, who were in the age range of 18-55 years.
The distribution of ABO and Rh blood groups is shown in Table 1. The most common group was found to be B, followed by O, A, and AB. Of the donors, 94.36% were found to be D positive. Table 2 depicts the phenotype frequencies of Rh-positive and Rh-negative groups. R1R1 and rr were the most common phenotypes amongst Rh positive and Rh negative, respectively. A rare phenotype, R2Rz, was also found in one donor.
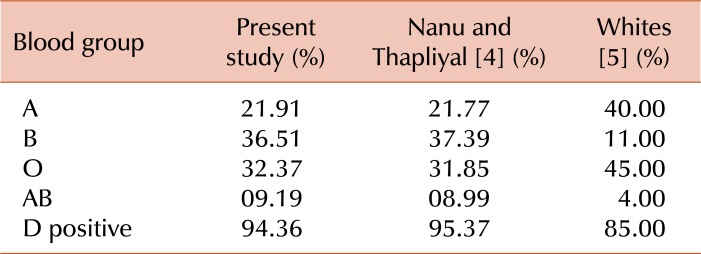
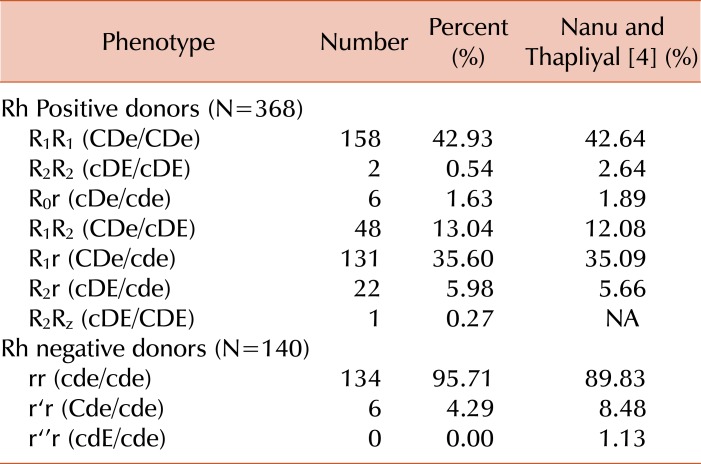
Table 3 and 4 depict the phenotype frequency of other blood groups found in this study, and compares the data to other published articles from India and abroad. The Lewis blood group, Le(a-b-) accounts for almost half of the donors, while we did not observe any donors with Le(a+b+) phenotype. The prevalence of the K antigen was found to be 1.97%, and k was present in 100% of donors. Accordingly, the K-k+ phenotype was the most common in these donors (98.03%). Fy(a+b+) and Jk(a+b+) were the most common phenotypes in the Duffy and Kidd blood group system. Interestingly, one rare finding was the presence of Fy(a-b-) and Jk(a-b-) in a single donor.
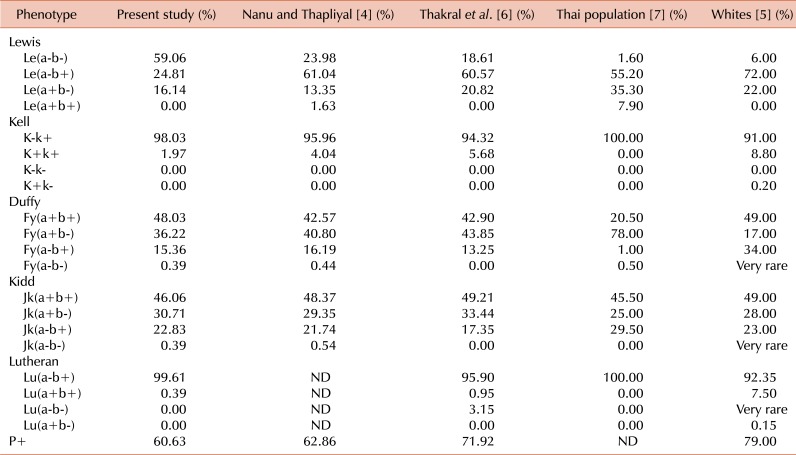
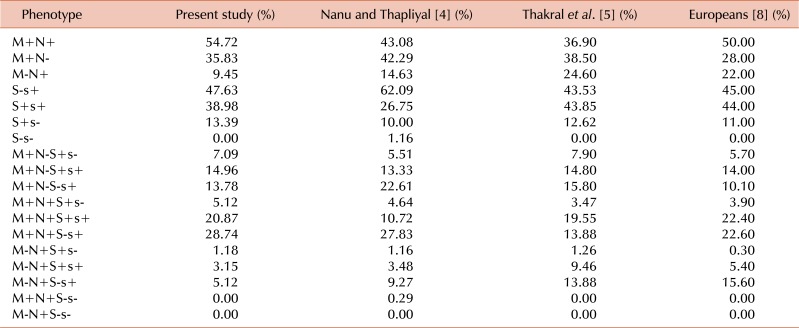
All donors were positive for Lub, while Lua was present only in 1 donor. In the MNS blood group system, 35.83% of donors were homozygous for the M antigen and only 9.45% was homozygous for the N antigen. M+N+ was the most common phenotype observed. Furthermore, S-s+ was common (47.63%) and overall, M+N+S-s+ was the most common phenotype (28.74%).
Go to :
DISCUSSION
In this study, we examined the composition of RBC antigens in north Indian blood donors. A similar study by Nanu and Thapliyal [4] was performed from the same institute more than 15 years ago. Thus, there is a need for a more recent examination of blood group phenotyping, particularly due to the escalating demand for blood and blood products from the increasing population in the National Capital Region (NCR). All of our results have been compared with those from a previous study [4], and with data from other published articles from India and abroad.
In this study, B was the most common blood group followed closely by the O group. This finding is in concordance with other studies published from India [4, 9]. However, overall worldwide frequency of the B antigen is low, excluding some areas, such as central Asia and Africa. In studies from Europe, America, and South East Asia, the O antigen has been found to be the most common blood group [7, 10].
The Rh blood group system is the most polymorphic and, next to ABO, is the most clinically significant blood group in transfusion medicine [11]. The frequency of the D antigen was high (94.36%) unlike other populations where the prevalence of D is lower (e.g. 85% in the white population and 92% in the black population) [12]. The frequencies of various Rh phenotypes were not different from those found by Nanu and Thapliyal [4], except for a rare case of R2RZ in our study. Among D positive donors, R1R1 was most common followed by R1r. However, the R1R1 phenotype is present in only 17.6% of the white population and 2.9% of the black population.
The phenotype frequencies in Kell, Kidd, and Duffy systems confirmed the findings from other previous Indian studies [4, 6]. The most common phenotype in the Kell blood group was found to be K-k+ (98.03%), which is also common in whites and in 100% of peoples from South East Asia [7]. The frequency of Jk(a+b+) and Jk(a+b-) is almost similar between the Indian and white populations. However, in this study, a rare phenotype of Jk(a-b-) was found, which has also been reported with rare occurrence in the white population. The case with the Duffy phenotype, Fy(a-b-), is similar to that reported in the present study. Fy(a-b-) is rare in the Indians and white populations but is common in the black population (68%). Fy(a+b+) is the most common phenotype reported in virtually all Indian studies and in the white population. However, the frequency of Fy(a-b+) is higher in whites than in the Indian population and is reported to be very low in South East Asian populations.
In contrast to other studies from India, among the four phenotypes of Lewis (Le) blood group, the Le(a-b-) was found to be most frequent. Twp previous studies from India have reported Le(a-b+) as the most common phenotype [4, 6]. The reason for this difference is unknown. Le(a+b+) was not found in the present study, which is a rare phenotype in Indian, European, and American populations [6, 13], but is quite frequent in some South East Asian and Japanese populations [14].
Lu(a-b+) was the most common phenotype (99.6%), which is true for most of the populations around the world. Lu(a+b+) was reported in one donor, which is not surprising, given its rare occurrence in the Indian population.
In the MNs blood group system, M+N+ was found to be more frequent than that reported in other studies. These studies have found M+N- to be almost equal or more frequent than the M+N+ phenotype. The phenotype frequency of S-s+ was the most common and comparable to that reported by Thakral et al. [6], and that in European populations [8], but lower than that reported by Nanu and Thapliyal [4]. M+N+S-s+ was the most common phenotype in our study, whereas previously, Thakral et al. [6] had reported M+N+S+s+ to be the most common.
In conclusion, we observed differences in the phenotype frequencies reported in previous studies from India. Specifically, a high frequency of Le(a-b-) was observed as were one donor of each of the rare phenotypes R2Rz, Jk(a-b-), and Fy(a-b-).
Go to :
 XML Download