

 PDF
PDF ePub
ePub Citation
 Print
Print


INTRODUCTION
The human immune system functions through a balance between adaptive and native immune responses. One of the main differences between the cells responsible for these 2 types of immunity is the nature of the antigen receptors present on the cell surface (specific for adaptive immunity, and conserved and "unspecific" for native immunity).
The adaptive immune system cells (B and T lymphocytes) are selectively activated by the specific recognition of an antigen via the variable region of their surface T cell receptors (TCRs) and B cell receptors (BCRs), respectively. These receptors undergo sequential mechanisms to maximize diversity; this enables a potentially specific response to a wide range of antigens. In the primary lymphoid organs, heavy and light chain genes (the heavy chain genes are located on chromosome 14, while κ and λ light chain genes are located on chromosomes 2 and 22, respectively) and α and β chain genes (located on chromosomes 14 and 7, respectively) encode for the transmembrane antigen-heterodimer receptors. These receptors undergo the first step in a complex mechanism of antigen receptor gene rearrangement, known as somatic V(D)J recombination. This highly regulated mechanism combines one Variable, one Diverse, and one Joining gene segment to generate a unique single gene V(D)J that will encode for a unique BCR or TCR variable region [1, 2]. In B cells, a further step of diversification can occur by somatic hypermutation of the V region to generate BCRs with high-affinity antigen binding sites [3]. The repertoire of B and T cell receptors is crucial, among others factors, in the field of cancer prevention, since the immune system is designed to patrol the body and recognize aberrant antigens such as cancer proteins (known as the immune-surveillance theory) [4, 5]. Furthermore, B and T cell receptors can act as surrogate tumor markers in B and T cell malignancies, owing to monoclonal antibody production (as in multiple myeloma) or monoclonal expansion of B and T cells, which share unique cell surface receptors. For such malignancies, the detection of minimal residual disease (MRD) can be crucial for therapeutic decision-making purposes. TCR specificity can also be considered an immunological marker in the assessment of the efficacy of novel immunotherapeutics, and thus is a crucial parameter to measure during immune monitoring [6, 7].
Antibody repertoires are highly diverse (up to 1012 different proteins in each individual). Therefore, the application of novel technologies with high sensitivity in monitoring specific TCRs and BCRs would be particularly helpful for hematologist and immunologists.
OVERVIEW OF THE NGS
Next generation sequencing (NGS), a new, powerful, high-throughput technology, has been available since 2004. NGS can be considered an evolution of microarray technology and sequencing. In fact, NGS can provide information that partially overlaps with data made available through the use of microarray technology. However, NGS possesses several advantages over current microarray platforms, including lower background noise, better sensitivity, larger dynamic range, and greater transcripts counts. Furthermore, NGS is a versatile technology that permits the detection of both new and previously described sequence variants at the level of the gene (re-sequencing of target regions), exome, or whole genome. Moreover, NGS can be used to analyze the genomic component at different levels, such as the transcriptome level (gene expression level of each gene, RNA-seq), the methylome level (methylation levels of each gene), and the chromatin structure level [8, 9].
In practice, this technology increases sequencing throughput by attaching millions of DNA fragments to a solid surface or support, and simultaneously sequencing all fragments in parallel. Current methods generally involve randomly breaking the sample into fragments and building fragment libraries. The fragment libraries are then prepared for sequencing by ligating specific adaptor oligonucleotides to both ends of each fragment, and subsequently using these as sequencing templates. The typical output of NGS is a list of billions of short sequences (25 to 400 bp), called reads, associated with quality scores. The molecular reliability of NGS data depend on 3 criteria: depth of coverage, heterogeneity, and accuracy of sequencing. Depth of coverage indicates the number of times that a given nucleotide is sequenced (for example, a 5× indicates that each nucleotide of the target region was sequenced, on average, 5 times). Heterogeneity is a measure of uneven sequencing depth of coverage along the length of the expressed region. Finally, the accuracy of sequencing is indicated by the quality of the base calls or quality scores (i.e., the quality scores assigned to each base call in automated sequencer trace, known as phred scores).
In gene expression analysis, RNA-seq provides a direct measure of allelic-specific expression because it enables direct genome/transcriptome sequencing. Further, RNA-seq might facilitate the detection of the expressed genome regions corresponding to genes not currently identified, because NGS does not require prior knowledge of a particular sequence. Hence, RNA-seq may identify new junctions between exons without a priori knowledge of the gene structure. Another point in favor of RNA-seq is that it allows the quantification of individual transcript isoforms regardless of whether the gene and its distinct isoform are already known. Therefore, NGS paves the way to studying the expression of different isoforms of a gene, and to measuring and comparing isoform diversity and abundance [10]. However, detecting genes with low expression levels remains a problem both for microarray and NGS platforms.
It is important to highlight that the analysis of the billions of short sequence reads generated by NGS platforms requires powerful computational tools. Such tools must be able to align reads to a reference transcriptome or genome sequence (read mapping), to identify and quantify expressed gene isoforms (transcriptome profiling), and to perform differential expression analysis between specimens (expression quantification) [11]. As a rule, the estimation of expression levels in RNA-seq analysis is performed in 2 steps: (1) sequence alignments to a reference genome; and (2) quantification of gene isoform expression levels. Since the entire process requires several computer programs to be used (whose parameters must be tuned according to the goal of the study), researchers tend to prepare their pipeline of programs to analyze RNA-seq samples in an automated and simple manner.
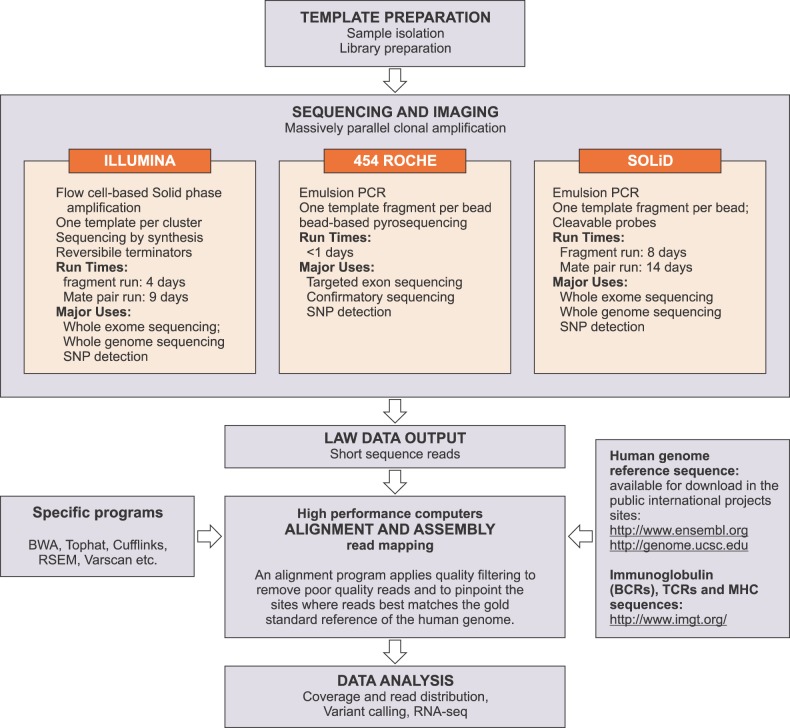
Currently, the most popular second-generation sequencing platforms are the 454 sequencing system (Roche), the SOLiD system (Life Technology), and the HiSeq and Genome Analyzer platforms (Illumina) (Fig. 1). A detailed and comprehensive summary and comparison of these systems has been provided by Metzker [9].
Recently, to overcome the limitations of second-generation sequencing due to reverse transcription and PCR amplification, third-generation sequencing platforms have been developed based on direct single-molecule sequencing. Another benefit of third-generation platforms is the decrease in indirect data: measurements are directly linked to the nucleotide sequence rather than being converted into quantitative data for base calling from captured images. Third-generation sequencing technology offers the following advantages over second-generation systems: higher throughput; higher fold coverage in minutes; higher consensus accuracy; longer read lengths; and the need for smaller amounts of starting material. Besides these advantages, third-generation sequencing allows direct RNA sequencing. Direct single-molecule sequencing does not require library preparation, a process that can be a source of bias, especially when dealing with small RNA molecules. Therefore, the quality of measurements should be greatly improved, and the process makes it possible to directly measure the molecules contained in the total RNA sample. At present, various third-generation platforms are available on the market; the best known are the Heliscope single molecule sequencer, the Nanopore sequencer, and the Ion Torrent sequencing technology.
1. Heliscope single molecule sequencer
Heliscope sequencing is based on true single-molecule sequencing technology [12]. The Heliscope applies a sequencing-by-synthesis approach, using each of the 4 nucleotides labeled with a different fluorophore. This allows for directly detecting single nucleotide incorporations on each of the single strand (DNA or RNA) templates, which are captured on a surface.
2. Nanopore sequencer
This technology is free of nucleotide labeling and detection because it relies on the modulation of the ionic current through the pore by setting a voltage. When a nucleotide goes through the pore, it causes a disruption in current. By measuring that current, it is possible to identify the specific nucleotide from among the 4 nucleotides (http://www. nanoporetech.com/).
3. Ion torrent sequencing technology
Ion torrent technology is based on standard DNA polymerase sequencing with unmodified nucleotides. When a nucleotide is incorporated into a neosynthetized DNA strand, a hydrogen ion is released and detected by a hypersensitive ion sensor (http://www.iontorrent.com/).
IMMUNE REPERTOIRE AND NGS
The adaptive immune system is able to produce repertoires of 1012 BCRs and 1012 TCRs per individual. Therefore, the study of immunological repertoires was until recently a difficult task, inasmuch as sequence analysis was based on the cloning of individual BCR or TCR cDNA. Nowadays, such difficulty is overcome through the use of NGS technology, which makes possible the study of BCR and TCR repertoire diversity and selection mechanisms at a greater depth than in the past. Indeed, NGS allows the study of basic phenomena, such as clone identification (i.e., the identification of B or T cell clone subpopulations by their expressed cell receptors), and can provide an estimate of the size of an individual's unique repertoire at any given moment. This is of crucial importance for the immunological monitoring of patients' repertoires in clinical practice, as well as for advancing strategies in monoclonal antibody discovery and engineering.
1. NGS in TCR studies
Multiple reports on NGS have provided interesting results on the TCR repertoire. NGS technology has been applied for analyzing the complementary determining region 3 (CDR3) of the TCRβ chain to study the complete T cell repertoire. One of the first applications of NGS in this field was described by Freeman et al. [13]. They carried out, by means of Illumina platforms, deep sampling of the T cell repertoire at a sequenced-level solution. In another study, Robins used the Illumina Genome Analyzer platform to simultaneously sequence the rearranged TCRβ CDR3 genomic regions of large numbers of αβ T cells from 2 healthy donors [14]. Such deep sequencing has revealed that the total TCRβ repertoire and the diversity in the CD8+ CD45R0+ memory compartment of antigen-experienced αβ T cells were higher than estimates given in previous studies (by 4-fold and 10-fold, respectively). Robins and colleagues also studied the CDR3 repertoire of naive and memory CD8+ T cells in 7 individuals, and demonstrated a strong bias toward specific Vβ-Jβ pair use [15]. Using a different platform (454; Roche), Venturi et al. pyrosequenced only the sequences generated by TRBV12-4/TRBJ1-2 gene rearrangements, with the aim of characterizing the TCRβ repertoire in the memory and naive CD8+ T cell compartments of 4 individuals [16]. Warren et al. performed the deepest TCR repertoire sequencing analysis to date. They obtained a total of more than 1 million TCRβ reads from a single healthy individual, and compared those reads with TCR repertoires obtained from 2 additional healthy subjects. The results revealed limited sharing at the nucleotide level between them, while the sharing was more extensive at the amino acid level. Finally, they found a statistically significant correlation between proportions of shared TCR sequences and shared HLA class I alleles [17].
2. NGS in BCR studies
NGS has been similarly applied in order to better characterize the BCR repertoire.
Jiang et al. performed antibody repertoire sequencing to analyze BCR diversity using zebrafish as a model [18]. They analyzed 51 zebrafish to characterize the antibody heavy chain repertoire diversification at 5 developmental time points. They identified a balance between deterministic and stochastic processes during B cell repertoire development. Such deterministic programming during V(D)J recombination is masked by the complex diversification processes of antibody maturation. Thus, the differences detected between young and old fish repertoires suggested that, developmentally, the B cell repertoire undergoes restructuring before the organism reaches sexual maturity, and that the main process that causes differentiation between adult repertoires is apparently random clonal expansion [18].
Boyd et al. analyzed B lymphocyte VH clonality by performing pyrosequencing in normal healthy donors and patients with hematological malignancies. They used a bar-coding strategy to pool multiple libraries of rearranged heavy chain V(D)J genes to evaluate the populations of suspected malignant B cells in clinical samples. Their results showed that peripheral blood lymphocyte populations use a more diverse immunoglobulin heavy chain V and J gene segment in healthy individuals than in patients with lymphomas or CLL [19]. In another report, the same author demonstrated the presence of individual variation in the immunoglobulin heavy chain V region locus (IGHD and IGHJ regions); furthermore, they noticed differing propensity of highly similar IGHV rearrangement and, consequently, expression [20].
NGS technology can also assist immunologists during antibody discovery (i.e., during the isolation of antigen-specific monoclonal antibodies and antibody fragments) and engineering. Indeed, it can be applied for testing the fidelity, antigen specificity, and genetic diversity of in vitro libraries from immunized animals [21-23]. For example, high-throughput screening of recombinant antibody libraries or immortalized B cells is a crucial step during in vitro and in vivo antibody discovery methods to determine antigen specificity. However, this screening is time-consuming and complex. Recently, researchers successfully replaced highthroughput screening with NGS technology. In this work, the authors analyzed bone marrow plasma cells from immunized mice, and found that the VH and VL-gene repertoires were highly polarized after immunization. The frequencies of the most abundant sequences were between ~1% and >10% of the whole repertoire [23]. Another useful application of NGS is in the field of biotechnology. In fact, combining Rep-Seq, natural mimic design, and novel library synthesis technologies, Zhai et al. generated a library with a high proportion of correctly folded, functional antibodies. The fidelity of construction and the characterization of its genetic diversity were monitored using the 454 Roche platform [24]. In contrast to oligonucleotide-based diversity generation methodologies, such novel library synthesis technology allows precise control over positional amino acid frequencies. This reduces stop codons and frame shifts, and other common errors of gene and library assembly, increasing the proportion of functional diversity. The use of NGS in the bioengineering field of antibody production is a classic example of how the synergistic use of different methodologies from disparate fields can maximize results (in this case both genetic diversity and functional diversity in antibody repertoire generation).
3. What can go wrong?
Importantly, as mentioned above, NGS data reliability depends on depth of coverage, heterogeneity, and accuracy of sequence. Nguyen et al. demonstrated the utility in filtering for lower accuracy of CDR3 sequences; they estimated an error frequency around 1-6%, with high positional and nucleotide-dependent variability. Therefore, this study confirmed the utility in filtering sequences based on the high association between error and the quality of the base call (i.e., accuracy), the strong relationship between erroneous sequences and the parental sequence, the dominance of specific nucleotide substitutions, and the skewed ratio of forward to reverse reads among erroneous sequences [25]. Warren et al., who sequenced TCR diversity, also confirmed that the sensitivity of sequenced-based repertoire profiling is limited by sequencing depth and accuracy [17]. In conclusion, regarding the particular features of the immunogenetic variability inherent to BCR and TCR diversity, and in consequence of the difficulty in distinguishing between real physiological immunogenetic alterations and "missense reads" due to low quality, it is necessary to be aware of possible misinterpretation of NGS repertoire analysis data. However, some fundamental points have to be considered to avoid presenting an incorrect portrait of the immunological repertoire. Particular care must be adopted during the steps of T and B cell isolation, as well as during isolation and enrichment for relevant Ig and TCR coding regions. Care must also be taken during the complex analysis of comparisons between different cell types and stages of maturation, since the amount of mRNA varies in different cells. For example, activated B cells generate huge amounts of mRNA compared with resting B cells. Moreover, activated T cells might or might not synthesize TCRs, depending on the stage of cell activation [26].
CONTRIBUTION OF NGS IN CLINICAL HEMATOLOGY
1. NGS at the cancer's side
Genetic analysis can shed light on the mechanisms of complex diseases such as cancer, and genetic elements can be key factors in the diagnostic processes for neoplastic diseases. Microarray-based expression analyses pioneered a new era of genome-based hematologic clinical practice. One of the first applications of microarray analyses in hematology was the identification of a favorable subgroup of primary mediastinal B cell lymphomas, among other types of diffuse large B cell lymphomas. This contributed to improved survival rates and more therapeutic options for patients with diffuse large B cell lymphomas [27].
Hematologic malignancies are grounded on genetic aberrations. Known and unknown mutations are at the basis of the different phenotypes in the spectrum of hematologic cancers [28-30]. NGS technologies have contributed in characterizing hematological diseases by allowing the identification of novel driver mutations in different diseases, such as AML, CLL, myelodysplastic syndromes (MDS), Waldenstrom macroglobulinemia, and multiple myeloma. Recently, deep sequencing strategies have been applied for disease classification, patient stratification, and individualized monitoring of MRD. Kohlmann et al. [31] reported the successful application of amplicon deep sequencing to screen for a target NGS mutation characterizing genetically myeloid malignancies. The characterization of leukemias, lymphomas, and myelomas is continuously evolving, and includes the precise identification of additional common mutations; such characterization may be of great prognostic value and clinical importance.
As an example, a patient with AML is classically considered 'good risk' at diagnosis if positive for the mutations t(15;17), t(8;21), or inv(16), while a patient is considered 'high risk' if the AML bears an FLT3-internal tandem duplication mutation or they have multiple cytogenetic abnormalities. Treatments for the good- and high-risk patients are fundamentally different. High-risk leukemia patients must undergo an allogeneic transplant, whereas good-risk patients will usually receive serial chemotherapy followed by an autologous transplant. Quality of life can be profoundly different between good- and high-risk patients. Moreover, both under-treating and over-treating patients can lead to life-threatening consequences. All these considerations underscore the absolute need for adequate therapeutic choices.
Still, clinicians struggle daily with the insufficiency of existing prognostic scoring systems. According to the 2001 AML classification system, a large subset of AML patients (approximately 50%) were scored as genetically or cytogenetically normal, and classified as not otherwise specified (NOS), while presumably harboring unknown mutations and being placed at risk from potentially unexpected treatment failures.
Recent genetic analyses have broadened the knowledge of AML genetics and attributed prognostic significance to new genes such as CEBPA and NPM1, which are currently included as 'provisional' in the 2008 AML classification system. In this last classification, the NOS AML rate dropped from 50 to 25-30% [32, 33]. In this context, NGS has the power to provide better characterization of complex genomes, allowing the monitoring of cryptic mutations or translocations. This could virtually eliminate the need for an NOS AML category and contribute to the development of better tailored therapies. In fact, NGS allows for the identification of all genetic changes, including single nucleotide mutations, deletions, amplifications, translocations, and uniparental disomy at a single-base resolution, using a discovery-based approach [34].
Another benefit of NGS is its application to MRD detection and quantification. In fact, NGS using consensus primers overcomes the hurdle of designing personalized sets of allele-specific primers. In confirmation of that, Boyd made a comparison between results obtained using the NGS 454 pyrosequencing platform and results obtained from patient clone-specific real-time PCR assays to evaluate MRD after treatment in leukemia patients. The results using each method were comparable, indicating that NGS may be used as a single uniform assay for MRD detection, avoiding the need to design individual real-time PCR assays for each patient's clonal malignant sequences [19]. In 2011, Logan et al. compared the performance features of the NGS 454 pyrosequencing platform, allele-specific oligonucleotide PCR (ASO-PCR), and flow cytometry for MRD quantification in 6 CLL patients following allogeneic hematopoietic cell transplantation. They demonstrated that the 454 platform MRD sensitivity was 10-5, and that sensitivity could reach 10-6 using other NGS model platforms. In addition, analyses of the same sequence data were effective for describing the kinetics of post-transplant immune repertoire reconstitution by profiling immunoglobulin heavy [35]. Finally, in another study, 43 paired patient samples were examined to diagnose T-lineage acute lymphoblastic leukemia/lymphoma and then assessed for MRD at day 29 after treatment. The results showed that TCRB and TCRG deep sequencing not only identified clonality at diagnosis in most cases, but also detected subsequent MRD; such sequencing also identified MRD that was not detected by flow cytometry in a subset of cases [36].
Concerning RNA-seq, an intriguing study has shown the first systematic profiling for small RNAs in MDS (a group of heterogeneous hematopoietic stem cell disorders that often lead to AML). In that study, Beck et al. performed highthroughput sequencing using an Illumina GAIIx platform. They analyzed small RNAs in primary bone marrow cells from low-grade (refractory anemia, RA) and high-grade (refractory anemia with excess of blasts, RAEB2) MDS patients, together with those from matched controls. Their data showed that the small RNAome in low-grade MDS, unlike that in RAEB2, was enriched with Piwi-interacting RNAs (piRNA), potentially protecting DNA from the accumulation of alterations. By contrast, the RAEB2 RNAome was enriched with transfer RNA (tRNA), providing potential activity in the inhibition of apoptosis, a hallmark of that disease stage. In conclusion, the results suggested pivotal roles for piRNA, tRNA, and microRNAs (miRNA) in the regulation of disease stage-specific molecular function and pathways. Additionally, by ontology analysis, they identified "negative regulation of transcription from RNA polymerase II," suggesting the potential presence of a feedback loop, in which specific miRNAs and transcription factors regulate their own expression by 2 pathways, depending on MDS grade: by enhancing polymerase II promoter activity in RA and by repressing its function in RAEB2 [37].
2. NGS and transplantation
Another interesting patient-centered application of NGS is in the field of allogeneic transplant. Immune control after an HLA-matched allogeneic transplant is the only therapeutic option for a number of high-risk hematologic malignancies. Matching in such transplants is designed on the basis of 6 pairs of inherited HLA class I and class II genes. After allogeneic transplant, the chances of transplant rejection can quite accurately be forecasted based on the type of chemotherapy preparation. However, response to therapy, disease relapse, the development of secondary malignancies, and the spectrum of transplant-related toxicities (therapy-related and immune-related, such as acute/chronic graft-versus-host disease) remain largely unpredictable. Rates of relapse, graft-versus-host disease, complete remission, and transplant-related mortality are predominantly inferred by measurement of indirect parameters, such as age, gender of the donor/recipient, burden of disease pretransplant, and concomitant infections. Meanwhile, the patient genetics, which determine the immune interaction between host and recipient and the progression of hematologic disease, are almost completely ignored.
Whole-genome analysis of donors and recipients could be of enormous importance in clarifying the cross talk between the immune systems of the donor and recipient, with the goal of better exploiting the power of donor immune control while avoiding the sometimes severe acute and chronic toxicities.
CONCLUSIONS
NGS genome-wide analysis is of paramount importance for better defining hematological disease, in terms of pathogenesis, unknown prognostic factors, and disease behavior. Genome sequencing of the transcriptome (RNA reverse transcribed to generate cDNA) or the methylome (by marking methylated cytosines of genomic DNA before sequencing) could be effective in revealing new cancer signaling pathways, relationships within the microenvironment, and immune-escape properties, and in prompting the development of new therapeutic approaches. Even more, such sequencing could be a novel technique of great importance in the fields of immunology and immunotherapy by helping to monitor and better describe T and B receptor repertoires. In the biotechnology industry, NGS is a novel and key technique for synergistically supporting antibody-engineering processes.
Nonetheless, it is important to keep in mind that there are several challenges in the interpretation of NGS results. These challenges include discriminating driver from passenger mutations and evaluating the prognostic and predictive values of specific mutations. Overcoming these challenges is important, so that only relevant findings from molecular disease pathogenesis studies are carried through into the development of novel therapies.
On the basis of the evidence described, we strongly believe that NGS will attain a preeminent role in hematology and immunology in the near future.
 XML Download