

 PDF
PDF ePub
ePub Citation
 Print
Print


I. Introduction
Science is the processing of information by a meticulous objective to test a hypothesis with data. Data, the outcome of measuring real phenomenon, is inevitably subject to error such as systematical bias, random chance, and contextual confounders1. Thus, the statistical test is the essence of hypothesis testing in original articles to estimate the probability of a finding occurring by chance alone. When a sample's findings are used to make an inference from the study of a target population, random sampling variability is an inescapable component. A variety of statistical tests are available depending on the scale of variables measured, number of comparison groups in a study, the difference of comparison groups in a study, as well as normality of the measured variables. In addition, the adjustment for potential confounding variables is also feasible with statistical methods. Clinical researchers need to be fluent when choosing the right statistical test in designing studies. Otherwise, inferential statistics through wrong statistical tests may invalidate conclusions and may influence other clinicians into making inefficient or ineffective clinical decisions based on the invalid clinical information.
However, there is no study on the pattern of statistical tests used in articles published in Journal of the Korean Association of Oral and Maxillofacial Surgeons (J Korean Assoc Oral Maxillofac Surg). Thus, this study intended to analyze the pattern of statistical tests and methods used in the Journal. By analyzing the pattern, it is expected that researchers will be provided with valuable guidelines regarding the appropriate choice of statistical tools.
II. Materials and Methods
Original articles published in J Korean Assoc Oral Maxillofac Surg in 2015 and 2016 were reviewed by one researcher to ascertain the type of statistical tests used and their frequency. When the type of statistical test was not clearly described in the article, it was categorized as unclear. Original articles without a clear description of statistical analysis were excluded. Case reports were not reviewed since their aim was not to test a hypothesis which needed the statistical computation of chance probability. Since the random error in recognizing the type of statistical test used in articles was of little concern owing to the uniqueness of name of statistical test, the intra-reviewer variability was not measured. Observed statistical methods were categorized into four types; statistical test for P-values depending on the difference of comparison groups, normality test, multivariable regression models, and correlation measurement. Descriptive statistics, including the proportion and rank of each statistical test type, were computed using Microsoft Excel 2016 (Microsoft, Redmond, WA, USA).
III. Results
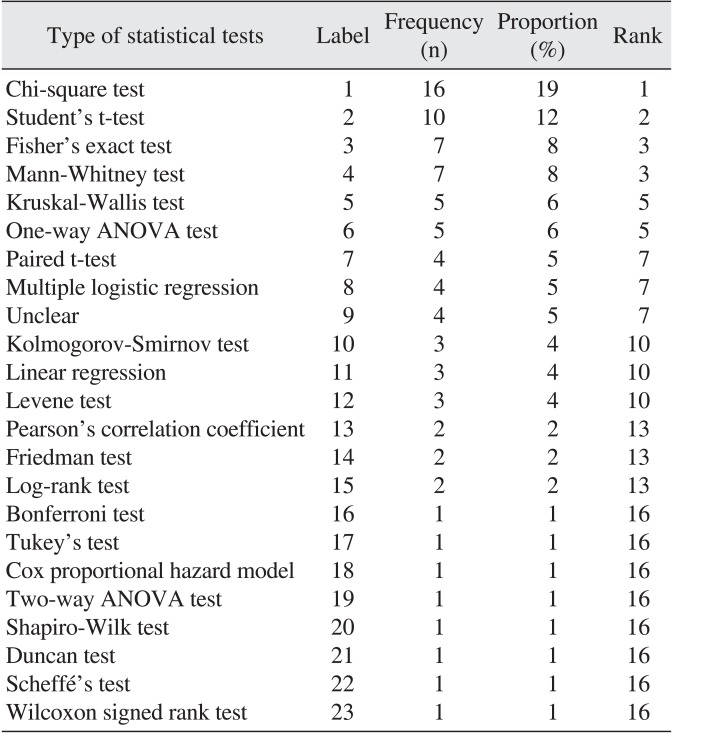
Twenty-two types of statistical test were identified in the 36 original articles. Statistical test type was not described in four original articles and classified as unclear in 5%.
Table 1 shows that the chi-square test was the most frequently used and the Student's t-test was the second most common. The Fisher's exact test and Mann-Whitney test followed. These four tests represented 47% of the total tests.
Normality tests, including the Kolmogorov-Smirnov test, Levene test, Shapiro-Wilk test, and Scheffé's test, were diverse but used in only 10% of the studies. The Kolmogorov-Smirnov test and Shapiro-Wilk test was used in 4% of the studies respectively. The Shapiro-Wilk test and Scheffé's test was chosen in only 1% of the studies.
Statistical tests for more than three different groups or three different sessions in the same group, including the Kruskal-Wallis test, one-way ANOVA test, two-way ANOVA test, and Friedman test, were used in 23% of the studies. However, post-hoc multiple comparison tests, which included the Bonferroni test, Tukey's test, and Duncan's test, were each used by 1% of the studies and thus 3% in total.
Regression models, such as the Cox proportional hazard model and multiple logistic regression to adjust for potential confounding variables, were used in only 6% of the studies. A total of 2% of the studies used the log-rank test but only 1% of the studies used the Cox proportional hazard model. Thus, only a half of survival studies used multivariable regression for controlling confounding effects.
Pearson's correlation coefficient for the identification of a linear correlation between two interval scale variables assuming normal distribution was used in 2% of the studies. Spearman's rank correlation coefficient under no assumption of normal distribution was not used in any of the studies.
The paired t-test and Wilcoxon signed-rank test for paired study design employing the same groups with different sites or different sessions, such as before and after, constituted 6% of the total tests.
IV. Discussion
Overall, 10% of studies used some types of normality test to validate their use of a parametric test for interval variables, because a normal distribution of measured variables is prerequisite for the adoption of a parametric test. However, every normality test is also a type of test that estimates probability using a P-value. When a P-value is less than 0.01 or 0.05, the null hypothesis that the sample is normally distributed is rejected and then it is concluded that the sample is not normally distributed. When a P-value is greater than 0.01 or 0.05, there is insufficient evidence to reject the null hypothesis that the distribution of the sample is normal and it should be concluded that it is impossible to know whether the sample is normally distributed or not based on the sample's data2. Statistical insignificance due to a higher P-value does not mean that the normal distribution of the sample is justified. However, many studies incorrectly used the normality test and justified the use of a parametric test according to the statistically insignificant results. However, the use of a normality test only to ascertain whether the shape of the distribution of observed variables is either normal or skewed it is still controversial3. Thus, a method to visually inspect the normal distribution, such as a box plot or frequency histogram, is preferred4. In addition, the nonparametric test is a stricter and more conservative method to determine significance than the parametric test. It is more appropriate to use a nonparametric test when the shape of the distribution is not clearly normal5. This approach may also reduce false positive findings that are attributed to a researchers' bias in their own research hypothesis.
In the same context, when detecting a linear relationship between two variables, the choice between the Pearson's correlation coefficient and Spearman's rank correlation coefficient should be made based on the normality of distribution decided by graphical tools. When the shape of the distribution is not clearly bell-shaped, Spearman's rank correlation coefficient should be adopted. In addition, the scatter plot should be checked to ensure that the relationship between two variables is actually linear. The value of the correlation coefficient (r) indicates the strength of the linear relationship. The P-value indicates that a linear relationship was observed in a study sample either due to chance alone or not. Thus, the P-value, as well as r, must be interpreted simultaneously.
Although 23% of the studies used an overall test, such as the Kruskal-Wallis test, one-way ANOVA test, two-way ANOVA test, and Friedman test, only 3% of the studies used multiple comparisons after the overall test. Once the results of one of the tests (overall test) mentioned previously revealed a statistical significance, then multiple comparisons should follow to determine which pairs are different statistically. Otherwise, multiple comparisons should not be pursued.
Beyond the estimation of the probability of chance alone as the outcome in a study, a statistical test, such as a multivariable regression, possesses one more additional function of adjustment for potential confounding variables if measured6. In particular, when the number of confounding variables is more than two, statistical adjustment using computer analysis is the best strategy. Multiple regression models, including multiple linear regression for the interval variable, multiple logistic regression for the binomial variable, and the Cox proportional hazard model for the censored variable, are available. In the 36 articles over a two-year period, only 6% used a multiple regression model. It is possible to infer that many confounding effects failed to be adjusted for, providing that the comparison groups were either randomly assigned or matched with confounding variables when samples were chosen.
Among the 36 original articles, four studies did not clarify the type of statistical test used. This uncertain information would decrease the validity of the studies' results, as well as the conclusions, and these should be pending until the uncertainty is resolved7.
A total of 6% of the studies used a paired t-test or Wilcoxon signed-rank test, which means there were very few paired study designs despite it being one of the preferred study designs used to control unknown confounding variables.
V. Conclusion
Across two recent years, 22 types of statistical test were identified in the 36 original articles published in J Korean Assoc Oral Maxillofac Surg. The four most commonly used statistical tests were the chi-square test, Student's t-test, Fisher's exact test, and Mann-Whitney test in descending order. These four tests constituted 47% of all the total tests. The use of regression models to adjust for confounding variables needs to be pursued. The adoption of a nonparametric test is recommended when the normal distribution is uncertain by looking at the shape of the distribution rather than using normality tests alone. To identify a linear correlation between two variables, the linear relationship should be confirmed by a scatter plot and the level of the correlation coefficient r should be interpreted with the P-value simultaneously.
 XML Download