

 PDF
PDF ePub
ePub Citation
 Print
Print


I. Introduction
Orthognathic surgery can affect the oropharyngeal airway through skeletal displacement and changes in the positions of the hyoid bone and tongue1. The main concern regarding pharyngeal dimensional changes caused by orthognathic surgery is patient sleep quality1. Up to 25% of adults suffer from obstructive sleep apnea (OSA) (apnea-hypopnea index [AHI] ≥5/h), and 10% of patients have moderate to severe OSA (AHI ≥15/hr)23. Maxillomandibular advancement surgery has been shown to safely and effectively treat OSA4, but the efficacy of other kinds of orthognathic surgery on the upper airway is not well understood.
Two-dimensional (2D) radiograph-based evaluations of the upper airway have revealed that mandibular setback surgery narrows the pharyngeal airway, whereas bimaxillary surgery has a milder or non-narrowing effect156. One study reported a significant decrease in the pharyngeal airway six months after bimaxillary surgery7. Others used computed tomography (CT) to evaluate the effect of bimaxillary surgery on class III patients and found no significant decrease in the pharyngeal airway89.
Cone-beam CT (CBCT) is an accurate and reliable tool for upper-airway evaluation10.
In this study, we aimed to assess changes in the upper airway space following bimaxillary orthognathic surgery to correct skeletal class III malocclusion and to determine whether changes in 2D measurements correlate with three-dimensional (3D) measurements on CBCT images.
II. Materials and Methods
1. Participants
This was a prospective cohort study conducted at Mashhad University of Medical Sciences (Mashhad, Iran) from April to June 2012. All study activities were performed in accordance with the ethical guidelines set by the Ethical Committee of Mashhad University of Medical Sciences, which conform to the Declaration of Helsinki. The aims and procedures of the study were clearly described to all participants, and written consent was obtained from each.
2. Inclusion criteria
We included healthy subjects with no previous medical problems, anteroposterior discrepancy >10 mm, and a need for bimaxillary orthognathic surgery to correct a class III malocclusion.
3. Exclusion criteria
Patients were excluded if they had any previous craniofacial syndrome or dentofacial trauma or if they did not require maxillary impaction as part of their surgical plan. Twelve patients participated in the study (five males and seven females) with an age range of 16-35 years (mean age, 20.4 years) and normal body mass index (BMI) of 18-25 kg/m2. Two patients were excluded during the experiment because one did not complete follow-up, and the medical documents of the other were lost (one male and one female).
All patients underwent bimaxillary orthognathic surgery (maxillary advancement by LeFort I osteotomy and mandibular setback by bilateral sagittal split ramus osteotomy [BSSRO]) and rigid fixation with titanium miniplates and screws. The mean amounts of maxillary advancement and mandibular setback were 4.4 mm and 6.55 mm, respectively. Maxillomandibular fixation was applied for a two-week period for all patients and was followed by elastic therapy to establish optimal occlusion.
4. Imaging procedure
Two upper airway CBCT scans were performed for all patients one week before and two to four months after surgery. All CBCTs were performed by the same technician at the same clinic, using the same machine and the same settings (80 kVp with 6 mA and 0.32 mm slice thickness, Planmeca ProMax 3D s; Planmeca Oy, Helsinki, Finland). To provide a reproducible CBCT image before and after surgery, CBCTs were conducted with a Frankfurt horizontal plane parallel to the floor. Patients were not allowed to swallow during the imaging procedure.
5. 2D and 3D
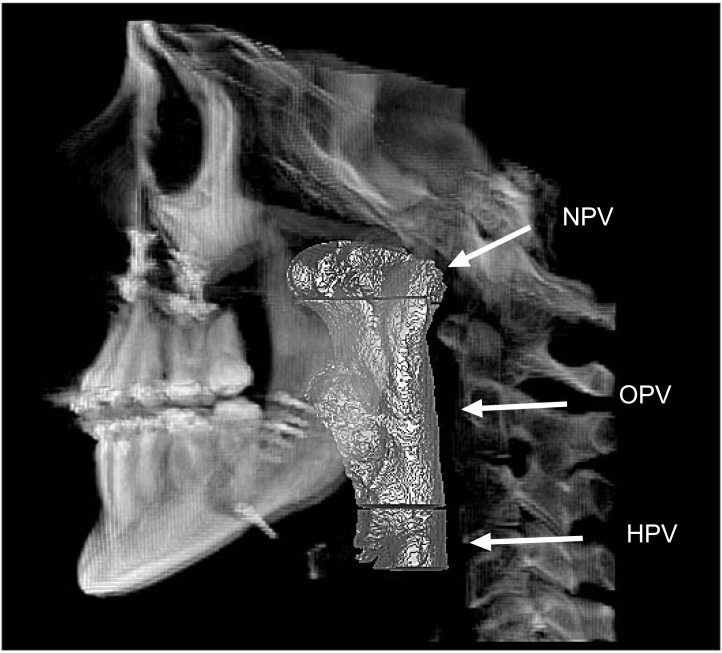
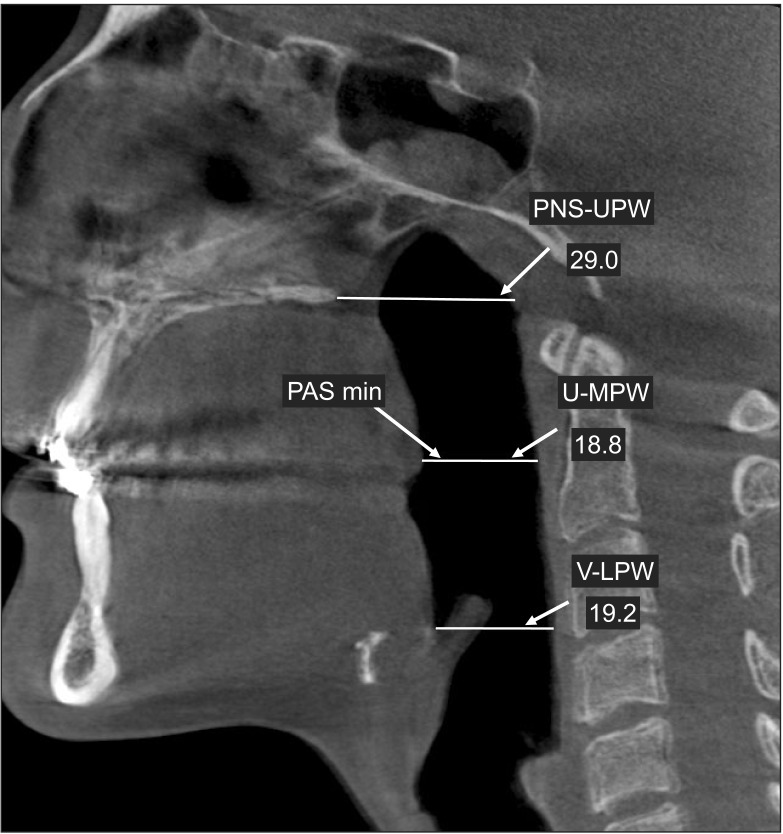
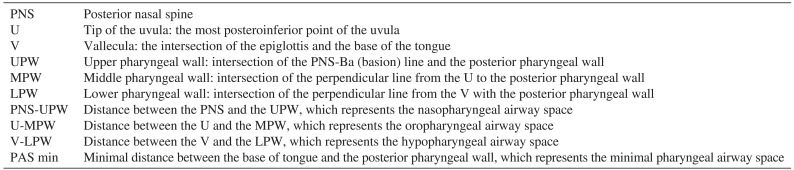
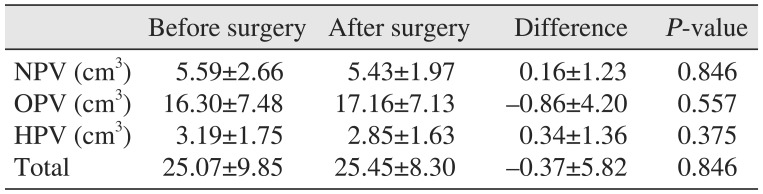
All CBCT segmentations and measurements were performed with the same workstation (HP xw9400; Hewlett-Packard, Palo Alto, CA, USA) and same software (Planmeca Romexis 2.8.1.R; Planmeca Oy). All measurements were performed by the same radiologist. The anterior boundaries of the volume space of interest were the vomer bone, soft palate, base of the tongue, and anterior wall of the pharynx. The posterior, lateral, superior, and inferior boundaries were the posterior wall of the pharynx, the lateral walls of the pharynx, the roof of the nasopharynx, and the plane crossing the vallecula perpendicular to the posterior wall of the pharynx, respectively. The airway was segmented into three regions, and the respective volumes were calculated.(Fig. 1, Table 1) Using the mid-sagittal plane view, a mid-sagittal slice was selected and used as a 2D measurement reference; the landmarks, which are described in Fig. 2 and Table 2, were used to perform 2D measurements as previously described by Jakobsone et al.9
6. Data analysis
The Wilcoxon one-sample test was used to compare the mean measurements of the airway pre- and post-surgery. P-values ≤0.05 were considered statistically significant. Spearman's rank correlation coefficient was used to test associations between CBCT volumetric and linear measurements.
III. Results
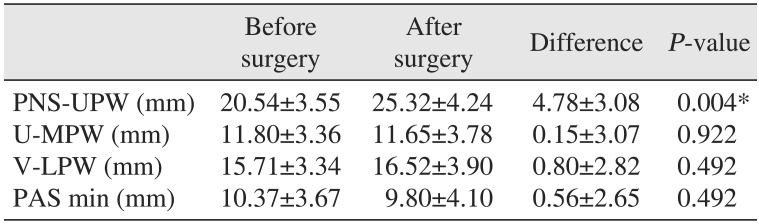
The 2D measurements showed no significant decrease in airway space, whereas there was a significant increase in distance between posterior nasal spine (PNS) and the posterior wall of the pharynx (P=0.004). The volumetric measurements of the upper airway space increased in total volume, but the change was not statistically significant. Hypopharyngeal and oropharyngeal areas decreased, and nasopharyngeal area increased, but none of these changes were significant.
We found that 2D and 3D measurements were significantly correlated with changes in U-MPW (distance between the uvula [U] and the middle pharyngeal wall [MPW], which represents the oropharyngeal airway space) and oropharyngeal volume (OPV) (r=0.83, P=0.004), as well as with changes in P-UPW and degree of maxillary advancement (r=0.72, P=0.02). The 2D and 3D changes in the upper airway space that were estimated from CBCT scans are shown in Tables 3 and 4.
IV. Discussion
Our results indicated that there were no significant decreases in the upper airway, but a significant increase in PNS-UPW (distance between the PNS and the UPW, which represents the nasopharyngeal airway space) in 2D measurements was noted. Although total and oropharyngeal volumes increased, and nasopharyngeal and hypopharyngeal volumes decreased, these changes were not significant. We found correlations between changes in U-MPW and OPV (r=0.83, P=0.004) as well as between changes in P-UPW and amount of maxillary advancement (r=0.72, P=0.02). One of the advantages of CT scanning is that it offers better delineation between soft tissue and air based on different Hounsfield unit (HU) densities9, allowing more accurate measurement of the upper airway. Herein, we used the categorizations and boundaries of upper airway levels described by Jakobsone et al.9 and Lowe et al.11. However, our measurements were conducted using CBCT images.
Our upper airway volume calculations were performed automatically using software that calculated airway volume in a segmented manner based on HU density differences. Several authors have demonstrated the feasibility of automatic segmentation and dimension estimation from CBCT images for upper airway volume measurement12.
Other researchers have used CT, CBCT, and cephalometric imaging techniques to assess correlations between 2D and 3D measures and volumetric measurements, but they did not find any statistically significant results913. Jakobsone et al.9 argued that this might be due to differences in imaging techniques. The cephalograms were taken in an upright position, and no special measures were performed to obtain standardized radiographs in relation to respiration phase9. In all cases, the acquisition time for the CT scans was too long for patients to hold their breath. The cephalograms were performed with the patient in an upright position, while CT scans were performed in a supine position9. Several studies found that changes in posterior airway space are associated with changes in body position among OSA patients1415 and healthy individuals1516. Furthermore Muto et al.17 showed that a 10-degree increase in craniocervical inclination enlarged the posterior airway space by approximately 4 mm. Therefore, any increase in craniocervical inclination following mandibular setback17 should be considered during cephalometric imaging with a natural head position. Our study was not affected by these limitations because all 2D and 3D measurements were conducted on CBCT scans that were performed by the same radiologist, using the same machine, with the patients in the same position. Furthermore, we did not use cephalograms. However, the main limitation of our study was the small number of patients.
Although the only procedure we performed on the mandible for this study was BSSRO, another common procedure in other studies is intraoral vertical ramus osteotomy (IVRO), which has been evaluated for its effect on the upper airway. Kawamata et al.18 did not find significant differences between the effects of BSSRO and IVRO on posterior airway space.
The only significant change in the 2D measurements was the distance between the PNS and the upper pharyngeal wall, which was consistent with previous studies919. The volumetric measurements showed increases in total and oropharyngeal volumes and decreases in nasopharyngeal and hypopharyngeal volumes, but none of these changes were significant. These findings are in contrast with those of Kim et al.20, who found a significant decrease in total pharyngeal airway volume after bimaxillary surgery in class III patients. This discrepancy can be attributed to the surgery procedure, in which they performed posterior maxillary impaction and rotated the occlusal plane. However, our results supported the findings of Jakobsone et al.9 because of the similar boundaries and areas used to measure the volumes.
We found a correlation between change in PNS-UPW and the amount of maxillary advancement in 2D measurements. The only significant correlation between 2D and volumetric measurements was between changes in U-MPW and oropharyngeal volume. In contrast, Jakobsone et al.9 found a correlation between nasopharyngeal space. Kim et al.20 found correlation between hyoid bone position and airway volume and between changes in palatal plane angle and decrease in total airway space. Postoperative pharyngeal airway space (PAS) values should be compared with OSA development values in order to assess OSA risk, particularly among patients with OSA syndrome9. A cephalometric-based study conducted by Kollias and Krogstad21 reported that the normal range of PAS values was 14.8±4.4 mm for males and 12.1±3.7 mm for females. PAS values <5 mm were reported to correlate with a high apnea index, independent of BMI22. Only one patient, whose preoperative PAS minimum was 7.37 mm, had a PAS <5 mm (4.58 mm) three months after surgery, which might be clinically important.
Furthermore, CBCT estimates should be validated by polysomnographic measurements to predict OSA risk. There are few studies on the evaluation of polysomnographic value changes after orthognathic surgery for treatment of class III patients, and the findings from these studies are controversial232425. Gokce et al.23 reported an improvement in sleep quality among class III patients after bimaxillary orthognathic surgery for treatment. In contrast, Hasebe et al.24 reported two cases of mild OSA after mandibular setback surgery, and Foltán et al.25 concluded that bimaxillary surgery for correction of class III malocclusion increased upper airway resistance. More research is needed to validate these findings.

 XML Download