

 PDF
PDF ePub
ePub Citation
 Print
Print


I. Introduction
Facial asymmetry is important to a patient due to its great impact in the aspects of esthetics, socio-psychology, and functions. Most patients with dentofacial deformities have facial asymmetry1. It can occur as a congenital or a developmental disorder. Skeletal asymmetries <3% in degree are not clinically discernible2,3. Even if they are not severe, patients may regard them as very serious.
The features of skeletal asymmetry are not always detected because soft tissue may compensate for underlying skeletal imbalances3-5. Furthermore, patients may mask facial asymmetry with their pose. Canted occlusal plane can be corrected by slight head tilting4. Facial asymmetry is evident when a patient smiles during physical examination. On the other hand, the presence of elevated labial commissure or alar base on one side is often an indication of vertical skeletal asymmetry. These features should be detected during routine evaluation in an interview6. For correct diagnosis, the setting of the reference plane is a critical factor in facial asymmetry analysis. Two-dimensional (2D) image analyses such as facial photographs and cephalogram have been performed. In a medi-lateral direction, postero-anterior (PA) cephalometric radiographs were used in the evaluation of skeletal components of facial asymmetry7. Mid-sagittal line and horizontal reference line were defined using valid landmarks on the PA cephalometries. Distances between midline and laterally positioned landmarks were used for the evaluation of facial asymmetry. Differences between the measurements on the two sides were evaluated for facial asymmetry. The major features of facial asymmetry are deviation of the menton (Me) point, dental midline, occlusal cant, lip cant, and orbital dystopia. To date, clinical evaluation of occlusal cant has been performed using a tongue depressor on the occlusal surface. In a study involving 2D PA cephalograms, Reyneke8 suggested an evaluation method for occlusal cant using triangular angulation.(Fig. 1) In this study, occlusal cant was determined by calculating the differences in vertical distance from eye to teeth on each side.
Standard protocols for the evaluation of skeletal cant have yet to be established. An ideal analysis on three-dimensional computed tomography (3D-CT) should not only reflect the clinical evaluation but should also be reproducible. This study assessed the magnitude of skeletal occlusal cant reflecting the clinical occlusal cant before and after orthognathic surgery.
II. Materials and Methods
1. Validation on 3D-CT measurement and clinical measurement
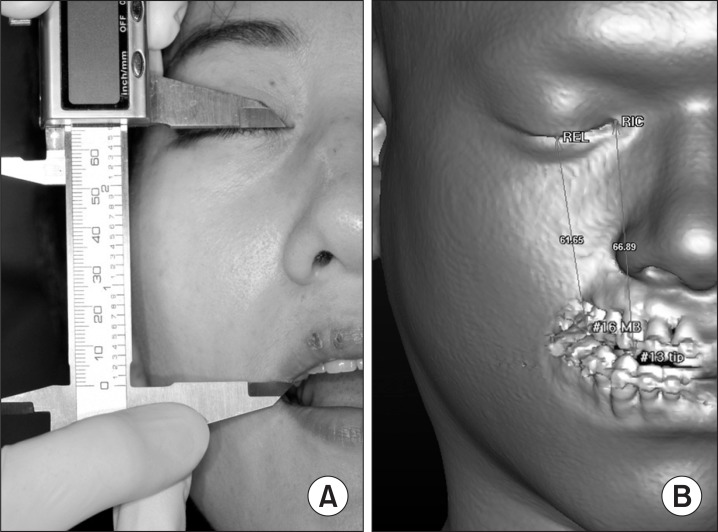
Among the patients who visited the Department of Oral Maxillofacial Surgery, Samsung Medical Center, Seoul, Korea, in 2011 and 2012, 15 patients who received CT image (GE LightSpeed VCT XT; General Electronic Medical Systems, Milwaukee, WI, USA) with eye closure were randomly selected and analyzed. All four distances were measured on the chair side and on the 3D-CT image. The following distances were measured: 1) Distance from the bottom point of the right eyelid (REL) with the eyes closed to the mesiobuccal cusp tip of the right maxillary 1st molar; 2) Distance from the bottom point of the left eyelid (LEL) with the eyes closed to the mesiobuccal cusp tip of left maxillary 1st molar; 3) Distance from the right inner canthus (RIC) with the eyes closed to the Rt. maxillary canine tip, and; 4) Distance from the left inner canthus (LIC) with the eyes closed to the Lt. maxillary canine tip.(Fig. 2) Validation of the correlation coefficient between CT measurement and clinical evaluation was performed.
This study was approved by the institutional review board.
2. Correlation between clinical cant and skeletal cant
Among the patients who visited the aforesaid department from 2009 to 2011 for orthognathic surgery, 16 patients who received CT imaging with eye closure were selected and analyzed. The Me points of all patients deviated by more than 3 mm. Exposure conditions were set at 120 kV, 300 mA, matrix of 512×512, and pixel size of 0.3 mm. The area from the superior part of the orbit to the lower jaw was included in the image, and the axial slice thickness was 1 mm. Upon completion of CT scanning, the images were obtained as Digital Imaging and Communication in Medicine (DICOM) files, with each slice 1 mm thick. CT images were also reconstructed to produce 3D images using Simplant Pro 2011 (Materialize Dental NV, Leuven, Belgium).
All of the evaluations were performed on 3D-CT images. The first evaluation was the measurement of the clinical cant. The distances from the inner canthus to the ipsilateral canine tip and from the eyelid to the ipsilateral 1st molar (mesiobuccal cusp tip) were obtained. The distances between the left and right sides were also calculated.
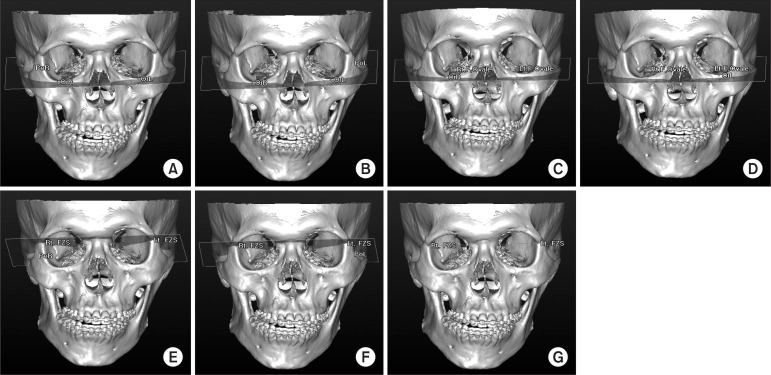
The second evaluation was a skeletal cant measurement. Seven reference planes and one line were used for the evaluation of occlusal cant: 1) FH plane R: Or.R - Or.L - Po.R; 2) FH plane L: Or.R - Or.L - Po.L; 3) F. Ovale plane R: Rt.F.Ovale - Lt.F.Ovale - Or.R; 4) F. Ovale plane L: Rt.F.Ovale - Lt.F.Ovale - Or.L; 5) FZS plane R: Rt.FZS - Lt.FZS - Po.R; 6) FZS plane R: Rt.FZS - Lt.FZS - Po.L, and; 7) FZS line: Rt.FZS - Lt.FZS. The distances between the seven reference planes above and the cusp tips of both maxillary canines and mesiobuccal cusp tips of both maxillary 1st molars were measured.(Fig. 3) The differences between the right and left data were calculated and determined as canine and molar cant.
Correlation between the skeletal and clinical cants was analyzed by simple linear regression analysis with IBM SPSS Statistics software ver. 20.0. (IBM Co., Armonk, NY, USA). In a simple linear regression, values between the observed values of the explanatory variable were usually assumed as possible values of others, too. A linear relationship was postulated between the population mean of the outcome and value of the explanatory variable.
III. Results
1. Validation on 3D-CT measurement and clinical measurement
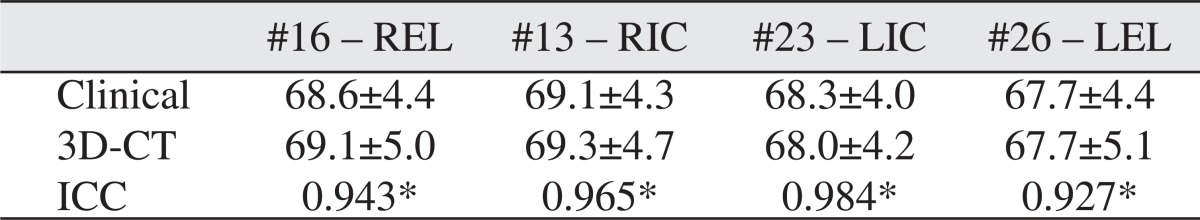
Fifteen patients (seven males, eight females) were included in this study. The mean age of the patients was 26.2±3.2 years. The distance from the mesiobuccal cusp tip of both maxillary 1st molar to the bottom point of the ipsilateral eyelid and the distance from both maxillary canine tip to the ipsilateral inner canthus were measured. The measurements were made twice on the chair side and on 3D-CT. Statistical verification was performed to check the concordance between the two groups. The distance between eye and tooth as measured on 3D-CT and on the chair side did not differ significantly with a high intra-class correlation coefficient (P<0.05, ICC>0.900).(Table 1)
2. Correlation between clinical and skeletal cants
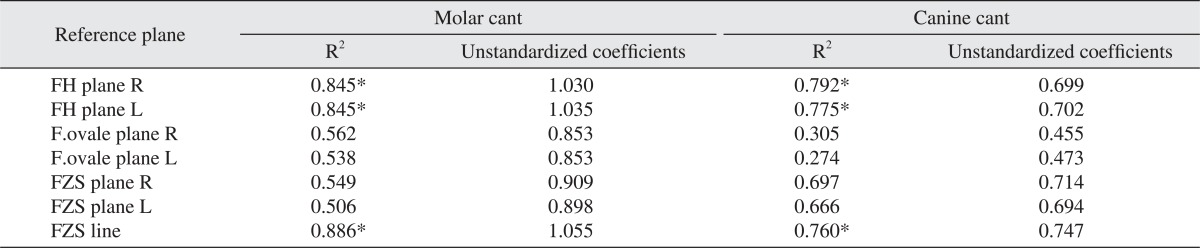
The correlation between clinical and skeletal cants as measured with the seven reference planes was statistically analyzed with simple linear regression analysis. High values of r-squared were evident on the FH plane R (molar cant: R2=0.845, unstandardized coefficients=1.030, t=8.742, P<0.05/canine cant: R2=0.792, unstandardized coefficients=0.699, t=7.311, P<0.05), FH plane L (molar cant: R2=0.845, unstandardized coefficients=1.035, t=8.742, P<0.05/canine cant: R2=0.775, unstandardized coefficients=0.702, t=7.259, P<0.05), and FZS line (molar cant: R2=0.886, unstandardized coefficients=1.055, t=10.43, P<0.05/canine cant: R2=0.760, unstandardized coefficients=0.747, t=6.650, P<0.05) for both molar cant and canine cants.(Table 2)
IV. Discussion
2D PA cephalometry has long been a valuable tool in the diagnosis of facial asymmetry. It has been the most popular conventional imaging technique used for the analysis of craniofacial anomalies even though it sometimes fails to provide accurate information.
Frontal and lateral cephalometries have been used for the quantitative evaluation of facial asymmetry. Note, however, that lateral cephalometric radiographs have some limitations due to difficulties in distinguishing between right and left anatomical landmarks9-11. The combined use of frontal, lateral, and submento-vertex views has been advocated by some clinicians for the 3D evaluation of the maxillofacial complex12. On the other hand, 2D radiographs have disadvantages such as enlargement and distortion of the image, which may lead to misdiagnoses13,14. Cephalometric measurements can cause the distortion of an image due to the projection technique. Therefore, 2D analysis should be used only for comparison and not for quantitative evaluation. 2D analysis has crucial limitations on the evaluation of facial asymmetry because the latter requires quantitative evaluation.
The use of conventional cephalometric radiographs to evaluate the reliability of quantity has some limitations. First, there are problems in the head position. When taking conventional cephalometries, head positioning is based on the external auditory meatus. Note, however, that a patient with facial asymmetry has mal-positioned anatomical structures including external auditory meati; hence the possible difficulty of reaching any conclusion regarding the actual measurement of asymmetric factors using frontal cephalometric radiography. Second, frontal cephalometric radiography does not have clearly defined anatomical landmarks such as sella and basion points. 2D radiography cannot overcome the overlaying or overlapping of landmarks. Thus, the 3D mid-sagittal reference plane, based on the cranial base of landmarks, cannot be used in 2D analysis.
Some authors have advocated the use of panoramic radiographs for the evaluation of asymmetry15. Comparison of the left and right sides on panoramic views may be a practical method, although the length and angle cannot be calculated accurately. Some authors measured the condyle and ramus heights in panoramic views and dry skulls, reporting the tendency of many false positives and negatives16.
Three dimensional cephalometric analysis software can improve the accuracy of 3D measurement17. The authors reported that the error in linear measurement with the software was within 1.5 mm. According to Cavalcanti et al.18, spiral CT imaging allows for precise and accurate 3D-CT-based measurements for neoplastic lesion in the mandible. CT scans are widely used to acquire 3D information on craniofacial complexes19. For easy access to maxillofacial 3D images, CT and computer technology were developed. Nonetheless, the high cost and high radiation dose are disadvantages of conventional CT despite its usefulness when performing a lengthy procedure in a confined space. On the other hand, 3D-CT images have advantages in the identification of anatomical structures, leading to problem-free superimposition. The accuracy and reproducibility of 3D-CT have been proven. Matteson et al.20 and Hildebolt et al.21 measured the skull using conventional non-spiral/helical whole body CT scanners and reported favorable results.
The reproduction of landmark marking for 3D analysis itself should be excellent, including the reproduction among interobserver and in the same observer to increase the precision of the analysis. Hassan et al.22 researched the method of enhancing the precision of tracing in the analysis using cone beam CT. He stated that tracing twice on multiplanar reconstruction (MPR) image and on 3D reconstructed image would increase precision compared to tracing on 3D only. Agreeing with the aforesaid article, this study performed MPR tracing additionally when marking on 3D only was deemed unable to guarantee precision and when there was no confidence in repetitive reproduction. In particular, on Ba, Po R, Po L, Dent, Op, and Na, which should have a point in anatomical structure with wide and round shape on 3D, both 3D and MPR image tracing were performed.
A mid-sagittal reference plane was set with three reference points23. Hwang et al.24 defined the mid-sagittal reference plane as the plane connecting the three landmarks: opisthion (Op), crista galli (Cg), and anterior nasal spine (ANS). In some cases, however, mid-sagittal reference planes would be set based on horizontal reference planes. Consequently, the setting of the horizontal reference plane is the most important factor and should be performed primarily for the evaluation of facial asymmetry. To measure the occlusal cant in a clinical evaluation, a wooden tongue depressor can be placed across the right and left posterior teeth, and the parallelism or the angle of the tongue depressor to the inter-pupillary plane can be documented. Alternatively, the vertical distance between the maxillary canines and the medial canthi of the eyes can be measured25. An analysis of the frontal cephalometry can also be used to determine the occlusal cant. A plane is drawn connecting the occlusal surfaces of the left and right maxillary first molars. The angle of this plane relative to the transverse axis of the skull, i.e., the angle of the occlusal cant, is measured6. Similarly, Susarla et al.26 reported that the degree of cant is equal to the linear millimeter difference between the right and left medial canthi to the ipsilateral canine tips. In the aforementioned study, the degree of cant was measured as the angle of occlusal plane against the true horizontal plane defined as tangent to the normal supraorbital rim. Since there is a reference plane on 2D as mentioned above, there should be a reference plane on 3D, too. This study investigated which of the 7 reference planes set on 3D would be the most appropriate horizontal reference plane for facial asymmetry analysis by performing clinical evaluation and comparative analysis of related planes.
Since all the measurements were made on CT in this study, a validation study was performed to check if the distance from the eyes to the teeth on CT was identical to the distance from the eyes to the teeth on the actual chair side. In the validation study, clinical linear measurement was highly correlated with linear measurement on 3D-CT.(Table 1) Based on this, 3D-CT linear measurement was reflected on clinical linear measurement. Given the very high inter-method correlation of the two methods, this study judged that the distance from the eyes to the teeth on CT could be expressed as clinical cant.
The measured skeletal cant with FH plane showed high correlation with the clinical cant, i.e., both FH plane R (molar cant: R2=0.845, unstandardized coefficients=1.030, canine cant: R2=0.792, unstandardized coefficients=0.699) and FH plane L (molar cant: R2=0.845, unstandardized coefficients=1.035, canine cant: R2=0.775, unstandardized coefficients=0.702). The orbitale and porion points are not far from the inner canthus and eyelid, and the FH plane is almost parallel to an occlusal plane. In this respect, the cant measured with FH plane may be highly correlated with the clinical cant. The orbitale point is a defined point on 3D-CT, and the porion point is advantageous since it does not affect the angle of the horizontal reference plane. Moreover, the FH plane has been used as horizontal reference plane on 2D analysis, so it would be easy to find correlation with 2D research. A foramen ovale plane has some advantages in superimposition because the foramen ovale point does not change with growth. However, it has low correlation with the clinical cant. Since the lateral point of the foramen ovale has vertical depth, there is high possibility of errors being committed by inter-observers or intra-observers. An FZS plane has an advantage, i.e., a medial point of FZS itself is the clear reference point with high reproducibility. Note, however, that pointing is difficult in 2D ceph. Moreover, as indicated by the present results, it has low correlation with the clinical cant. An FZS line has a good reference point like the FZS plane. Moreover, since it consists of only two points in the frontal part of the skull, it is not affected by the reference point at the back in the evaluation of the cant. The reason the FZS line was highly correlated with the clinical cant has been considered above. Rachmiel et al.11 used the horizontal plane at the level of fronto-zygomatic suture, defining a line connecting the bilateral latero-orbitals and a vertical line perpendicular to the horizontal line through Cg, which were employed as horizontal and vertical reference lines.
V. Conclusion
3D-CT and 2D cephalometric analyses are both useful in evaluating the occlusal cant; note, however, that 3D is being highlighted because of the limitations of 2D analysis. In 3D analysis, there could be several references that can serve as criteria for evaluating the occlusal cant, and those references should reflect the clinical occlusal cant properly. Among the references used in this study, those with the highest correlation with the clinical cant were FH plane R, FH plane L, and FZS line. Among them, the FZS line has limitations in 3D analysis since it is a 2D structure. Furthermore, since the orbitale points consisting of the FH plane are easy to point and are close to the eye, using it as the reference plane may be appropriate.

 XML Download