

 PDF
PDF ePub
ePub Citation
 Print
Print


I. Introduction
At least 21-67 percent of patients with prognathia or retrognathia have facial asymmetries1-4. In the case of patients with maxillofacial deformities, facial revision is critical for the improvement of appearance.
As the most widely used method for diagnosing facial asymmetries and maxillofacial deformities, cephalic radiography is effective in making plans for orthodontic treatment and orthognathic surgery and evaluating the postoperative results5-9.
Traditional radiography refers to lateral cephalic radiography, panoramic radiography, and posteroanterior cephalic radiography. A lateral cephalic radiograph can be used to measure the gonial angle, ramal height, and mandibular length as part of asymmetry analysis, but the right image differs from the left one in terms of magnification due to the difference between distances from the X-ray tube to film10,11. Two-dimensional (2D) lateral cephalometric analyses are used to measure the shape, size, position, and orientation of the different facial units. These analyses are done on lateral cephalometric radiographs wherein all the facial structures are projected onto a single sagittal plane. Nonetheless, the information that can be gathered from them is limited. In determining position, the information is limited to the anteroposterior and vertical dimensions. In determining orientation, the data is limited to pitch. On the other hand, in determining size, the parameters are limited to length and height; analysis is restricted to projections on the sagittal plane when determining shape. A radiograph is taken based on an external auditory canal, on the premise that both external auditory canals are symmetrical to each other. As the case stands, it is difficult to evaluate bilateral symmetry. Panoramic radiographs are effective in checking osseous structures and teeth in the mandible and maxilla; they facilitate the comparison of mandibular shapes or condylar heads but cause major geometric variations. A posteroanterior cephalic radiograph is useful in comparing the right side and the left side. A frontal skull radiograph tends to cause structural overlap; thus, reference points may not be sufficiently reproducible. Furthermore, reference points vary depending on the external auditory canal. There is a limitation in the evaluation of facial symmetry12.
Three-dimensional (3D) images taken from computed tomography (CT) can be a solution to the foregoing problems and may be effective in diagnosing and treating maxillofacial deformities13,14. 3D imaging systems have been less popular among orthodontists and maxillofacial surgeons; to this day, most of them make diagnoses and therapeutic plans 2D, i.e., referring to 2D radiographs. The accuracy of data taken from 2D radiographs tends to be inversely proportional to the severity of facial asymmetry, which may lead to misdiagnosis. In this study, in relation to measurement items, 2D images were compared to 3D images taken of patients with facial asymmetries. The results are expected to be helpful for the systematic and selective use of the two systems.
Go to : 
II. Materials and Methods
1. Subjects
This study targeted patients who visited the Department of Oral and Maxillofacial Surgery at Wonkwang University Dental Hospital to undergo orthognathic surgery between January 2010 and September 2012. Face photos (full faces and profiles) - lateral, panoramic, and posteroanterior cephalic radiographs - were taken of each patient. A total of 27 patients whose average age was 23 years were considered for this study. In the face photos, we considered the mandible to be asymmetric when the patient's midline chin point deviated by over 1 mm from the face midline (nasion to midpoint interpupillary line)15. We regarded the maxilla as asymmetric when the angle between the pupil line and tongue blade was measured by the posterior bite when the angle was over 4 degrees16. In face photos, 17 patients had asymmetries only in their mandibles (group 1). Note, however, that the other 10 patients showed mandibular as well as midfacial asymmetries (group 2). A small number of patients having asymmetries only in their midfaces were excluded from this study. Photo analysis was done by a maxillofacial surgeon.
2. Methods
1) Reference points and lines
Data analysis was made based on 30 reference points, 4 of which were the nasion, sella, menton, and dent in the midline. The others were porion, orbitales, articules, gonion, superior condylar points, posterior condylar points, lateral condylar points, lateral gonion, inferior gonion, posterior gonion, upper first molar buccomesial cusp points, mandible canine cusp points, and chin plane points - 13 each on both sides. The reference points were classified into 8 categories and 16 measurement items contained therein. Out of the 16 measurement items, 6 were taken from lateral cephalic radiographs, and the other 10, from posteroanterior cephalic radiographs. Table 1 shows the 8 categories and their definitions.
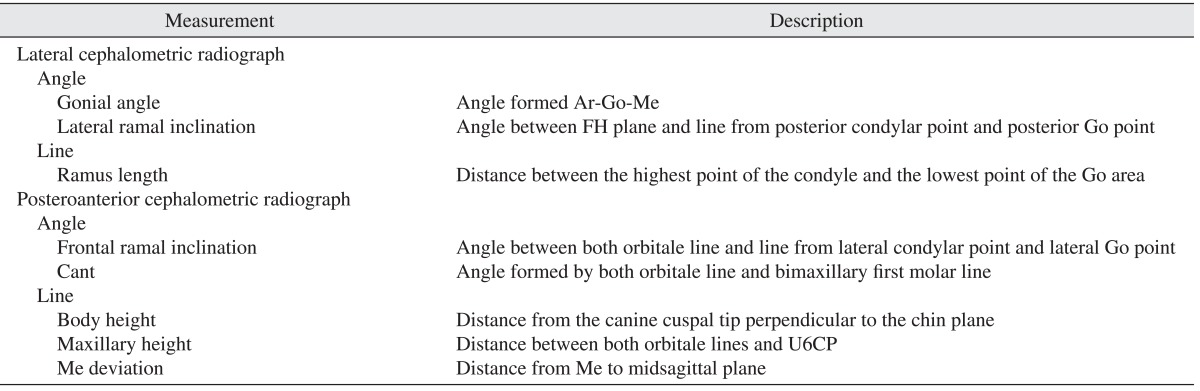
The same reference lines were applied to 2D and 3D radiography. The Frankfort horizontal (FH) plane, drawn from orbitale to porion, was used as the reference line in 2D lateral cephalic radiographs.(Fig. 1. A) A line connected by both orbitales was used as the horizontal reference in posteroanterior cephalic radiographs.
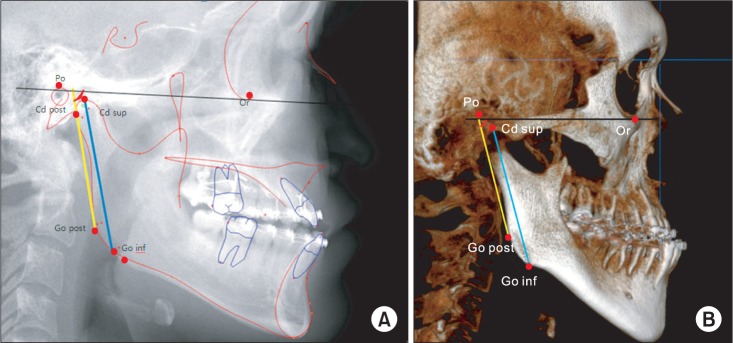 | Fig. 1The measurement of lateral cephalogrphic radiography with V-ceph program (A) and 3-dimensional image with OnDemand program (B). In 2-dimensional image, the program divided right and left side based on the fact that closer part to film tends to show more radiopaque in lateral cephalogram. Lateral ramal inclination was represented the red angle between posterior ramal border (yellow line) and Frankfort horizontal plane (black line). Ramal length displayed blue line, and we measured gonial angle formed by Ar-Go-Me. (Ar: articulare, Go: gonion, Me: menton, Po: porion, Cd post: posterior condyle point, Cd sup: highest point of the condyle, Go post: posterior gonion point, Go inf: lowest point of the Go area, Or: orbitale)
|
In measuring the cant in 3D, the FH plane was used in orbitale plane.
The vertical reference is perpendicular to the horizontal reference, passing through the nasion.(Fig. 2. A) In 3D images, the plane connected by both orbitales and the right porion was used as the reference plane. The midsagittal plane is perpendicular to the reference plane, passing through a nasion and a dent.(Figs. 1. B, 2. B)
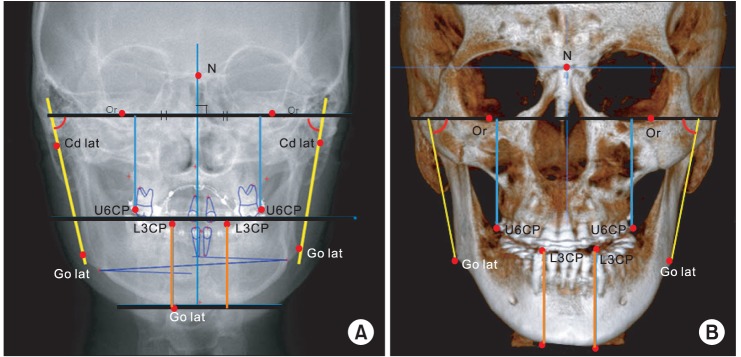 | Fig. 2The measurement of antero-posterior cephalographic radiograph. The line connecting both orbitale was used as a standard. Midsagittal line perpendicular to the line connecting both orbitale and passing nasion point was used as a vertical standard (A). The measurement of 3-dimensional image with OnDemand program. The plane including both orbitale and porion was a standard plane and the plane passing nasion and dens is midsagittal plane (B). Frontal ramal inclination (red angle): angle between both orbitale line (black line) and yellow line from lateral condylar point and lateral Go point, body height: orange line, maxillary height: blue line. (N: nasion, Or: orbitale, Cd lat: lateral condyle point, U6CP: upper first molar buccomesial cusp point, L3CP: mandible canine cusp point, Go lat: lateral gonion point)
|
2) Acquisition and reconstruction of facial radiographs
Patients underwent 2D radiography, keeping central occlusion and their FH planes parallel to the floor. As with 2D, 3D data were acquired on central occlusion and H parallel to the FH plane to the floor, with the chin point mounted on the CT chin table. In the process of lateral cephalic radiography, every patient was exposed to radiation for 9.3 seconds on the average, along with 76 kV voltage and 12 mA current. In the posteroanterior cephalic radiography, exposure time was 7.6 seconds on the average. All the radiographs were taken from a unit (Planmeca Promax; Planmeca Oy, Helsinki, Finland) and were converted into 'digital imaging and communications in medicine (DICOM)' files. Data were measured using the program V-Ceph 6.0 (Osstem Implant Inc., Seoul, Korea). The magnification of radiographs was controlled based on the abovementioned reference lines.
3D images were taken from the cone-beam computed tomography (CBCT) (Alphard Vega; Asahi Roentgen, Kyoto, Japan) performed on patients by maintaining neutroclusion with the following specifications: slices 420, field of view 200×179 mm (C-mode), voxel size 0.39×0.39×0.39 mm, voltage 80 kV. DICOM files were reconstructed into images, with 3D analysis conducted using the program OnDemand3D application (Cybermed Inc., Seoul, Korea).
3) Measurement
Six measurement items (gonial angle, lateral ramal inclination, ramal length on the right and left sides each) in three categories were drawn from lateral cephalic radiographs, four of which were for measuring angles (right and left gonial angles and lateral ramal inclination); the other two were for measuring distances (right and left ramus length). In addition, 8 items (frontal angle inclination, body height, mandible height on the right and left sides each, and cant, mandible deviation) in 5 categories were drawn from posteroanterior cephalic radiographs. Three and five items were for measuring angles (right and left frontal ramal inclination and cant) and distances (mandible body height and maxillary height on the right and left, menton deviation), respectively.(Table 1)
4) Statistical analysis
A comparison was made between 2D cephalic radiographs and 3D radiographs taken of 27 patients (15 males and 12 females) in terms of measurement items. The inter-dimensional comparison was applied to group 1 (patients having asymmetries only in their mandibles) and group 2 (patients having asymmetries not only in their mandibles but in midfaces as well). In addition to the analysis of normal distribution, paired t-test or Wilcoxon's single rank test was applied to the comparative analysis. The significance level was defined as P-value of less than 0.05 (95%).
Go to :
III. Results
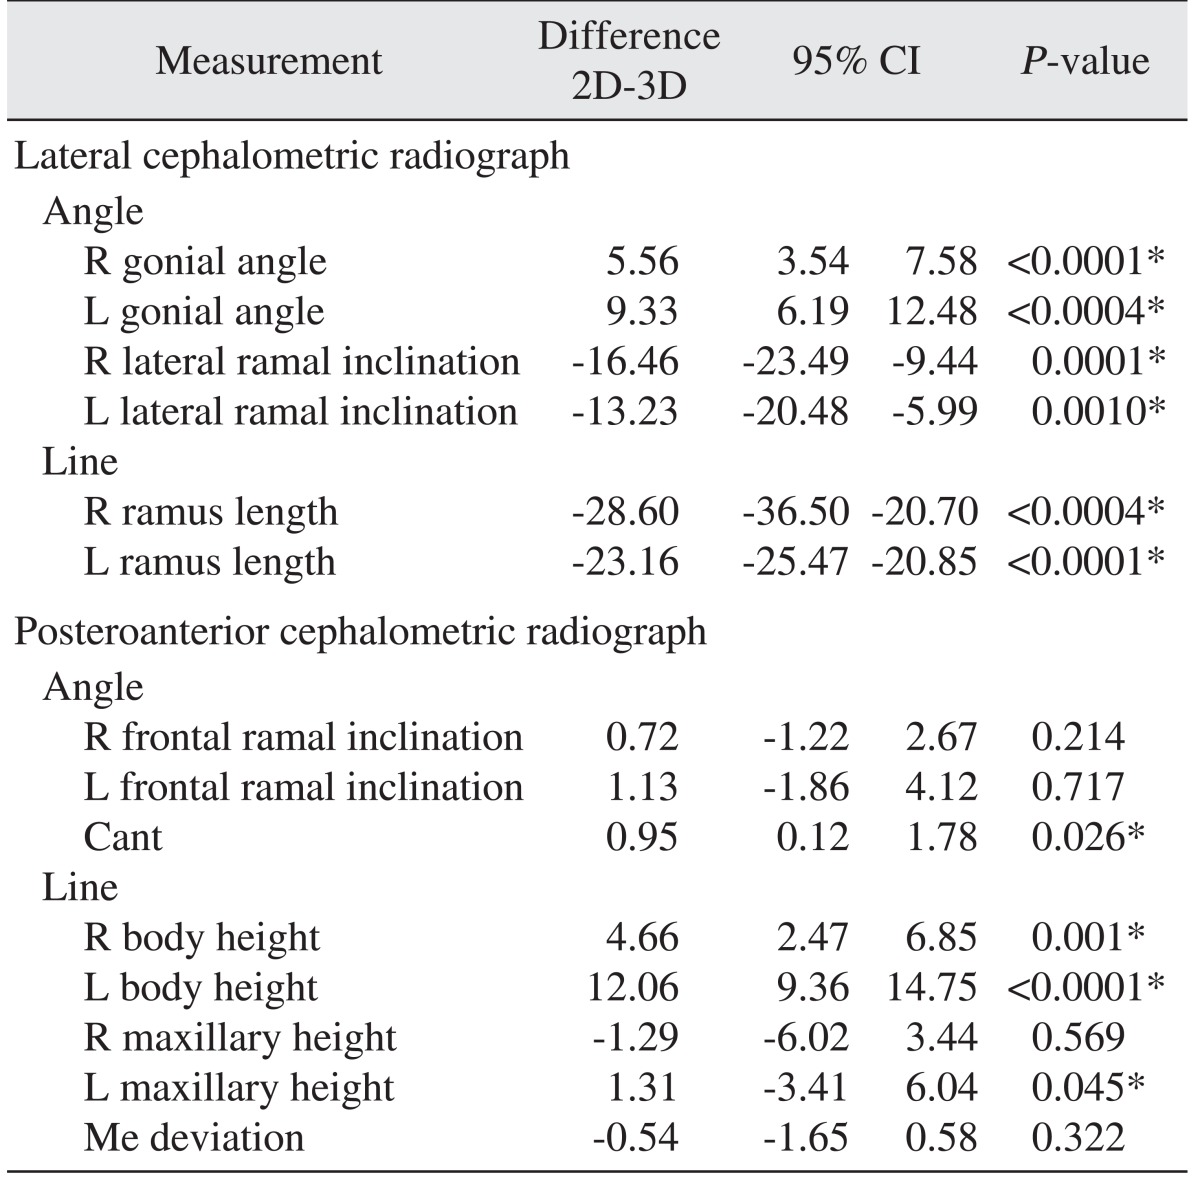
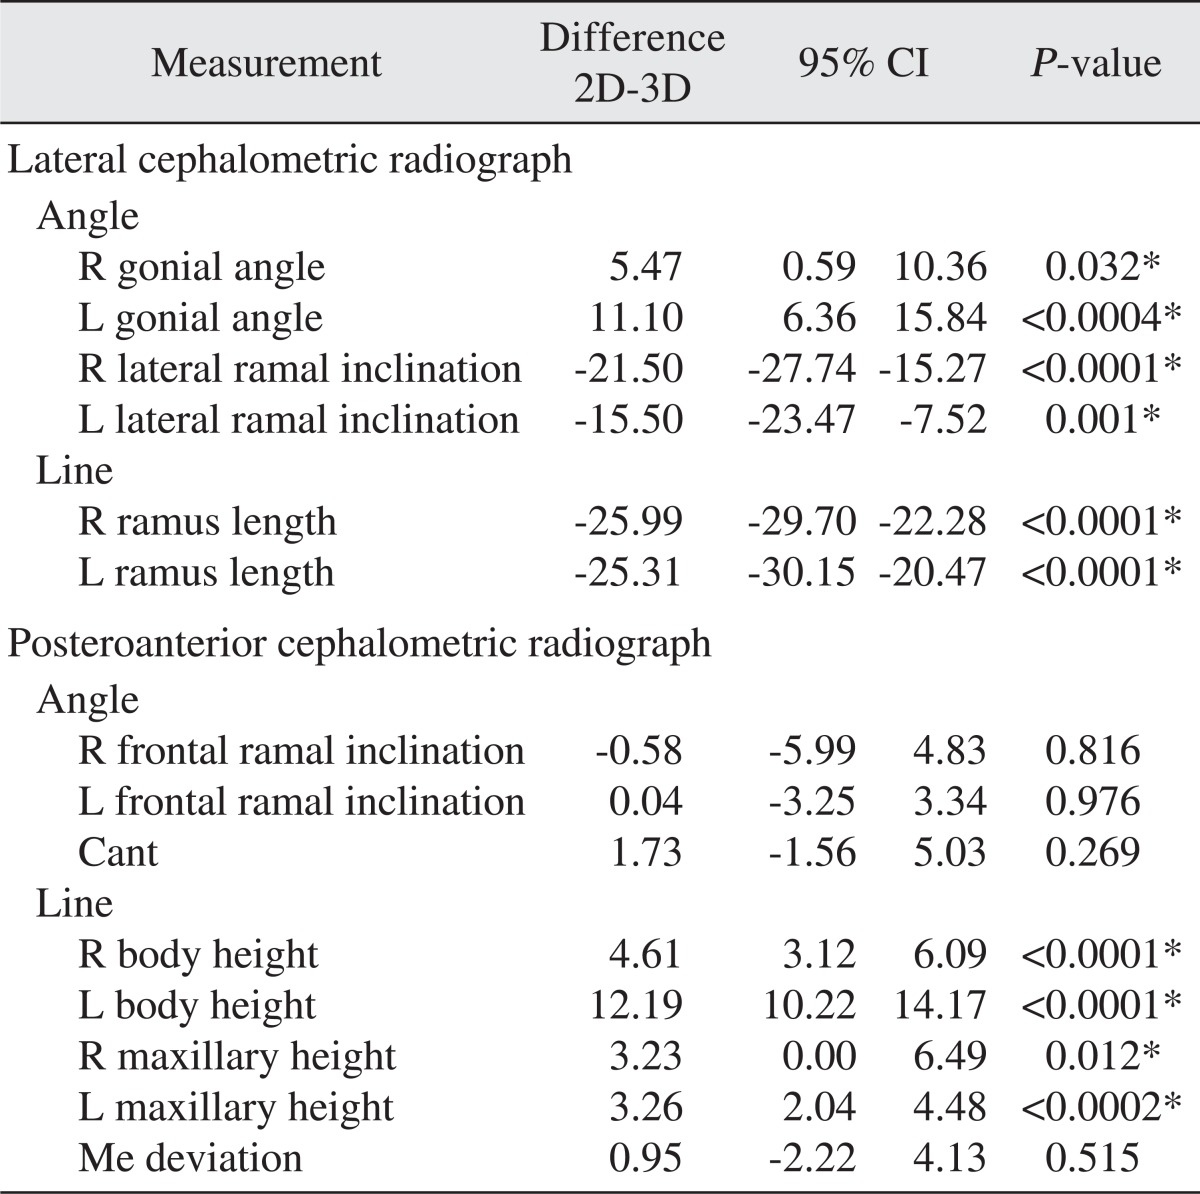
A normality test was performed on the differences between data measured on 2D and 3D radiographs taken of group 1, with significance tested through paired t-test and Wilcoxon's single rank test.
In lateral cephalic radiographs, significant inter-dimensional differences were found in angle-related data, i.e., gonial angles and lateral ramal inclinations, and in length-related data specifically ramus lengths. In posteroanterior cephalic radiographs, significant differences were found in cants but not in frontal ramal inclinations. Mandibular heights and left maxillary heights showed differences, but such was not the case with right maxillary heights. Similarly, menton deviations did not show significant differences.(Table 2)
In lateral cephalic radiographs taken of group 2, as with group 1, significant differences were found in gonial angles, lateral ramal inclinations, and ramus lengths. In posteroanterior cephalic radiographs, however, neither frontal ramal inclinations nor cants showed significant differences unlike in group 1. Body heights and maxillary heights showed differences, but such was not the case with menton deviations.(Table 3)
Go to :
IV. Discussion
CBCT is known to be smaller in unit size, less costly to scan, less radioactive, and easier to manipulate in terms of tracing the positional relations between teeth and alveolar bones compared with the existing CT. It also enables the simulation of orthognathic surgery and application of 3D images to the morphologic interpretation of temporomandibular joints17. This is why it has been used widely in recent times. Nevertheless, it is still insufficient to replace 2D radiography due to several problems such as longer radiographic exposure, lower penetration rate, and non-standardized 3D data. For now, realistically, it is merely complementary to 2D radiography in terms of revision surgery and orthognathic surgery18-20.
The existing 2D radiographic system also has a problem with reference point-related reproducibility due to the overlap of two objects. Moreover, it is likely to skew data, which may result in misconceived therapeutic plans21.
van Vlijmen et al.22,23 took posteroanterior radiographs of skulls using 2D X-ray scanner and 3D CBCT scanner and compared 3 length-related data and 9 angle-related data. The results revealed significant differences in 11 data exclusive of one data (antegonion left , antegonion right, lateral orbital margin left). Furthermore, in 2D lateral cephalic radiographs and 3D ones taken to analyze 10 angle-related data and 2 length-related data, significant differences were found in 6 angle-related data (ANB, SNB, NL/ML, NSL/BOP, NSL/ML, and NSL/NL) and 1 length-related data (Is to A-Pog). Similarly, Yitschaky et al.24 reported significant differences in data including Witts appraisal or sella.
2D radiographs are limited in terms of information on asymmetry and are more likely to skew the information due to asymmetry. Regarding measurement items suitable for the analysis of asymmetry, a comparison was made between 2D images and 3D images25. As a result, there were significant differences in gonial angles, lateral ramal inclinations, and ramus lengths worked out from the lateral cephalic radiographs. A lateral cephalic radiograph projects an object slanted toward the left or right onto a sagittal plane; an error occurs in the length or angle depending on how much it slants. Thus, it is less effective in measuring the ramus26.
In posteroanterior cephalic radiographs taken of group 1, significant inter-dimensional differences were found in cants (angle-related data). In group 2, however, they did not show significant differences. This implies that 2D-based asymmetry diagnosis may cause a problem in patients whose asymmetries are inconspicuous in their face photos despite medical asymmetries rather than in ones whose asymmetries are clearly seen in their face photos. For example, it may be difficult to find asymmetry in case the maxilla yaws on the vertical axis of the skull. Accordingly, there is a need to take additional measurements for asymmetric maxilla affecting the cants of patients in group 1, which can be solved by 3D measurement.
In posteroanterior cephalic radiographs, significant differences were found in mandibular heights in both groups. Apparently, such differences depend on the cephalic angle22,27,28. Remarkably, right maxillary heights as measured in group 1 did not show significant inter-dimensional differences; in left maxillary heights, the P-value was 0.045 or almost 0.05. In group 2, however, significant inter-dimensional differences were found on both sides. This means that 2D images cause more errors in measuring the maxillary heights of patients having maxillary asymmetries rather than those whose maxillary asymmetries are inconspicuous.
Damstra et al.27 reported that, in relation to the maxillary heights of asymmetric skulls, 3D posteroanterior cephalic radiographs drew exact values (less than 0.5 mm), but that the same cannot be said for 2D radiographs (between 0.5 and 1 mm).
Data values have been reported to be more exact in 3D images than in 2D images21,22,24,25,27,29, with 3D images found to be more effective in diagnosing asymmetry and estimating the severity. Actually, a diagnostician makes a surgical plan considering the data taken from face photos and radiographs, and the calculated length is reflected on the surgery. This suggests that the data taken from 2D images are by no means the only solution to asymmetry revision; hence the need to apply 3D image analysis not only to patients whose asymmetries are clearly seen in their face photos but to others and to reflect the results on the surgery. As such, further study should be conducted on the data required to check maxillary asymmetry but could not be taken from 2D images. 'Yawing' refers to cases wherein the maxilla yaws on the vertical axis of a skull, i.e., Z-axis that can be drawn only from a 3D image. Therefore there is a need to study how much is asymmetry referable to the yaw range. Since facial asymmetry is related to the compensatory action against soft tissue coating the skeleton, asymmetry may be checked in relation to soft tissue on 3D CT30. According to Hwang et al.30, even a symmetric skeleton might be asymmetric to soft tissue, and patients might complain about the postoperative results. Reference point-related reproducibility is lower in the check on soft tissue asymmetry rather than on skeletal asymmetry, but gonion, nasion, pronasale, and subnasale can be used as reference points because they are reproducible. In this regard, it is helpful to understand the skeleton, soft tissue, and their correlation when the same reference points are applied to the assessment of skeletal and soft tissue asymmetries.
So far, most orthodontists and maxillofacial surgeons have diagnosed facial asymmetry using 2D images. Note, however, that many problems have arisen in the process wherein a 3D object is projected onto a 2D plane. Meanwhile, technological advancement has enabled implementing 3D images, measurements, analyses, and models and, by extension, performing more accurate diagnoses. Thus, 3D images are critical in accurate diagnoses and operations. In particular, 3D imaging technology should be applied to actual operations.
Go to :
V. Conclusion
This study sought to verify the effects of 2D and 3D radiographs on the diagnoses of facial asymmetry requiring orthognathic surgery. With regard to 14 asymmetric items, a comparison was drawn between 2D radiographs and 3D radiographs taken of 27 patients with facial asymmetries. The following are the results:
In patients having asymmetries only in their mandibles, significant inter-dimensional differences were found in gonial angles, lateral ramal inclinations, ramus lengths, cants, and body heights.
In patients having asymmetries not only in their mandibles but in the maxillae as well, significant differences were found in gonial angles, lateral ramal inclinations, ramus lengths, body heights, and maxillary heights.
In conclusion, 3D CBCT provides more accurate information, and it is more effective in diagnosing facial asymmetry compared to 2D radiography.
Go to :
 XML Download