

 PDF
PDF ePub
ePub Citation
 Print
Print


INTRODUCTION
Tacrolimus and cyclosporine are important calcine urine inhibitors prescribed to patients undergoing organ transplantation to inhibit their immune response [1]. Cyclosporine was first introduced in the 1980s, buttacrolimus has more recently become the inhibitor of choice, largely owing to the more favorable patient outcomes observed in clinical trials [23]. Nonetheless, cyclosporine is still chosen in a number of cases, for example, in patients who have received it successfully long-term and in those who may have exhibited side effects from tacrolimus treatment [3].
Although both tacrolimus and cyclosporine have proved to be instrumental in the management of transplant patients, the long-term toxicity of these drugs remains a concern [12]. In addition, they have a narrow therapeutic concentration range, and absorption varies largely across patients [4]. Therefore, therapeutic drug monitoring (TDM), i.e., the practice of measuring the drug concentration in the patient's blood to ensure a constant level, is recommended [56]. Because transplant rejection is the first and only indication of therapeutic ineffectiveness, TDM is vital for the patient's health [6].
Recently, the Elecsys automated assays for cyclosporine and tacrolimus (Roche Diagnostics, Penzberg, Germany) were developed to accurately measure their respective levels in whole blood. An initial multi-center evaluation of the assay indicated good precision, linearity, and close agreement with liquid chromatography-tandem mass spectrometry (LC-MS/MS) [78]. However, these analyses were performed at European sites in a European patient population and not in an Asia-Pacific (APAC) population. The concentration of immunosuppressant drugs (ISDs) in patients from different geographical regions can vary for a number of reasons, including different drug application regimens in different countries, ethnicity affecting drug metabolism and metabolic enzymes, and different drug–drug or food–drug interactions [91011]. Decreased or increased levels of ISDs and their metabolites can affect the cross-reactivity of immunoassays, and the specificity of antibodies for a target molecule and its metabolites is the main reason for differences in immunoassay results [1213]. Therefore, it is important to evaluate assays in different ethnic populations. In addition, the standard techniques used in clinical practice differ by continent: in Europe, LC-MS/MS is widely used, while in the APAC region, although LC-MS/MS is used, immunoassays are more common because of several limitations of LC-MS/MS [14], including turnaround time, cost, and lack of equipment and well-trained staff [15]. Immunoassays are fast and are therefore routinely used for stable transplant outpatients [16]. To date, no study has directly compared the cyclosporine and tacrolimus immunoassays currently used in APAC clinical practice. In addition, the recent 2016 International Association of Therapeutic Drug Monitoring and Clinical Toxicology (IATD-MCT) guidelines note that method comparison experiments should incorporate samples from patients with transplant types matching the intended use of the assays [12].
This multi-center study was performed to evaluate the performance of the Elecsys tacrolimus and cyclosporine electrochemiluminescence immunoassays (ECLIAs) under routine conditions in patients from the APAC region. In addition, we compared these assays with other immunoassays used for TDM in this region using a wide range of transplant types.
METHODS
1. Immunoassays
The Roche Elecsys tacrolimus and cyclosporine assays are ECLIAs for use with whole human blood on the cobas e systems [1718]. The measuring ranges of the tacrolimus and cyclosporine ECLIAs are 0.5–40 ng/mL and 30–2,000 ng/mL, respectively. Both assays utilize a biotin-streptavidin sandwich principle, and the read-out is via electrochemiluminescence. Only 35 µL (cyclosporine ECLIA) or 20 µL (tacrolimus ECLIA) of sample is required, and the total assay duration is 18 minutes. Further details on the assay technology have been published elsewhere [78].
The ECLIAs were compared with the Architect cyclosporine [19] and tacrolimus assays [20] on the Abbott (Abbott Laboratories, Abbott Park, IL, USA) Architect platform; Siemens (Siemens Healthcare Diagnostics Inc., Newark, DE) Dimension Magnetic particle immunoassays (ACMIA) for cyclosporine and tacrolimus [2122] on the Siemens Dimension platform; and Siemens Viva-E EMIT cyclosporine [23] and tacrolimus [22] assays on the Siemens Viva-E platform that were all performed according to the manufacturers' instructions.
2. Sites and instruments
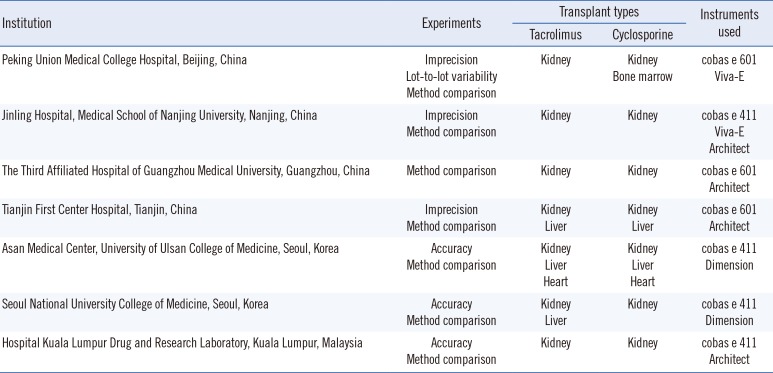
The technical performance of both ECLIAs was evaluated between September 2014 and December 2015 at four sites in China, two in Korea, and one in Malaysia, on either the cobas e 411 or the cobas e 601 system. Specific details on the sites and instruments are presented in Table 1.
3. Sample sources and handling
Samples used for imprecision experiments were provided by Roche Diagnostics. For accuracy (ring trial) testing, three proficiency testing samples were obtained from the Royal College of Pathologists of Australasia (RCPA) [24]. For lot-to-lot evaluation and method comparison experiments, anonymized serum samples were collected during routine clinical practice at the study sites. Samples were shipped frozen and stored at −20℃ until testing within six months of receipt. Good laboratory practices and national regulations for shipping samples were followed throughout the study.
4. Imprecision
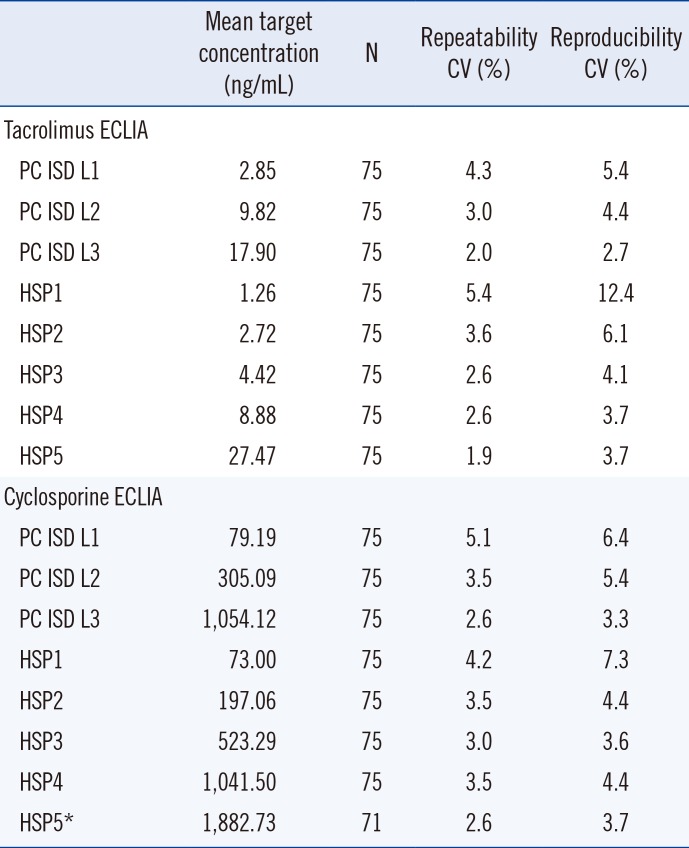
Imprecision for each assay was assessed at three sites (PUMCH, Beijing; Jinling Hospital, Medical School of Nanjing University, Nanjing; and Tianjin First Center Hospital, Tianjin) using Preci-Control ISD (PC ISD) quality control samples at three levels of known target concentration. For tacrolimus, the target concentrations were: level 1 (L1), 2.85 ng/mL; level 2 (L2), 9.82 ng/mL; and level 3 (L3), 17.90 ng/mL. In addition, human sample pools (HSP) of whole blood were spiked at five concentration levels of each ISD: HSP1, 1.26 ng/mL; HSP2, 2.72 ng/mL; HSP3, 4.42 ng/mL; HSP4, 8.88 ng/mL; and HSP5, 27.47 ng/mL. For cyclosporine, the target concentrations for the PC ISD samples were: L1, 79.19 ng/mL; L2, 305.09 ng/mL; and L3, 1,054.12 ng/mL. The HSP cyclosporine target concentrations were: HSP1, 73.0 ng/mL; HSP2, 197.06 ng/mL; HSP3, 523.29 ng/mL; HSP4, 1,041.50 ng/mL; and HSP5, 1,882.73 ng/mL. Repeatability and reproducibility experiments were performed according to the Clinical and Laboratory Standards Institute Evaluation Protocol (CLSI EP) 05-A3 guideline [25]. For each site and each assay, five replicates of each sample (PC ISD L1–3 and HSP1–5) were measured with one run per day for five days. Repeatability was defined as the closeness of the agreement of measured samples within the same analytical run, and reproducibility as the closeness of agreement for each measured sample across all three sites.
5. Accuracy
Accuracy was assessed at three sites (Seoul National University College of Medicine, Seoul; AMC, University of Ulsan College of Medicine, Seoul; and Hospital Kuala Lumpur Drug and Research Laboratory, Kuala Lumpur) by determining the difference between the mean measured and accepted true value (recovery rate) of a sample. The PC L1–3 control samples used in the imprecision experiments were also used to evaluate accuracy. In addition, three RCPA proficiency testing samples were measured that had predefined target values: RCPA1 (19.2 ng/mL tacrolimus, 1,548 ng/mL cyclosporine), RCPA2 (11.5 ng/mL tacrolimus, 805 ng/mL cyclosporine), and RCPA3 (7.6 ng/mL tacrolimus, 434 ng/mL cyclosporine). Target values were provided by the RCPA. The accuracy experiments were performed on the cobas e 411 system for both Elecsys assays and on the Abbott Architect and Siemens Dimension systems. Samples were analyzed in triplicate in one run on each analyzer.
6. Lot-to-lot evaluation
Lot-to-lot variability was assessed at the PUMCH, Beijing, using different reagent lots (Roche Elecsys RackPack). Lot nos. 18285901 and 18542901 were used for tacrolimus ECLIA using samples from patients who had received kidney transplants. Lot nos. 18286001 and 18555801 were tested using the cyclosporine ECLIA and samples from kidney and bone marrow transplant patients. At least 120 samples within the measuring range were required to assess lot-to-lot variability for the reagents for each assay.
7. Method comparisons
Both Elecsys ECLIAs were compared with the tacrolimus and cyclosporine assays on the Abbott Architect (total samples tested n=512 for tacrolimus and n=521 for cyclosporine), Siemens Dimension (total n=324 for tacrolimus and n=316 for cyclosporine), and Siemens Viva-E (total n=244 for tacrolimus and n=257 for cyclosporine) platforms. For comparing tacrolimus assays, samples (tacrolimus concentration range, 1.0–33 ng/mL) were obtained from kidney transplant patients (Elecsys ECLIA vs Architect n=69, Elecsys ECLIA vs Dimension n=128, Elecsys ECLIA vs Viva-E n=244), liver transplant patients (Elecsys ECLIA vs Architect n=443, Elecsys ECLIA vs Dimension n=131), and heart transplant patients (Elecsys ECLIA vs Dimension n=65). In addition, samples from bone marrow transplant patients were used to compare the cyclosporine assays, and the following samples were used for the comparisons: kidney transplant patients (Elecsys ECLIA vs Architect n=459, Elecsys ECLIA vs Dimension n=128, Elecsys ECLIA vs Viva-E n=191); liver transplant patients (Elecsys ECLIA vs Architect n=62, Elecsys ECLIA vs Dimension n=127); heart transplant patients (Elecsys ECLIA vs Dimension n=61); and bone marrow transplant patients (Elecsys ECLIA vs Viva-E n=66). The transplant type referred to the most recent transplant in the patient. One sample aliquot was tested in at least one run; multiple runs were done on different days.
8. Statistical analysis
WinCAEv Version 2.2.2 CFR 21 Part 11 compliant electronic data capture software was run on a laptop attached to the cobas e 411 or 601 system. Reference assay output was entered offline into WinCAEv at the test sites, and source data were verified with analyzer printouts. WinCAEv reports were used to present technical data for familiarization and accuracy experiments. For precision experiments, coefficients of variation (CVs) were calculated for repeatability and reproducibility [26]. Samples with a measured concentration too close to the assays' measuring range were excluded. Passing–Bablok regression was used to evaluate lot-to-lot variability and Weighted Deming regression for method comparison experiments. Scatter plots for method comparisons were generated with WinMC Version 2.0 using data exported from WinCAEv.
9. Ethical approval
This study was conducted in accordance with the principles in the Declaration of Helsinki (as amended in Tokyo, Venice, and Hong Kong) or with country-specific regulations. All investigators followed the International Conference on Harmonization Good Clinical Practice (ICH GCP) guideline for clinical trials and received institutional review board (IRB) or independent ethic committee (IEC) approval. These guidelines also considered risk analysis and management, linkage and patient confidentiality, and the use of data in patient management. In Malaysia, this study has been registered with the National Medical Research Register (NMRR-15-2884 ISR) and was approved by the Medical Research and Ethics Committee (MREC) Ministry of Health Malaysia.
RESULTS
1. Imprecision
Table 2 presents the results of the repeatability and reproducibility experiments for both assays. For the tacrolimus ECLIA, repeatability CVs ranged from 2.0% to 4.3% for the PC ISD L1–3 control samples and from 1.9% to 5.4% for the HSP1–5 samples. Reproducibility CVs ranged from 2.7% to 12.4% for all tested samples.
For cyclosporine, repeatability CVs ranged from 2.6% to 5.1% for the PC ISD L1–3 samples and from 2.6% to 4.2% for the HSP1–5 samples. Reproducibility experiments revealed CVs of 3.3% to 6.4% for the PC ISD L1–3 controls and 3.7% to 7.3% for the HSP1–5 samples.
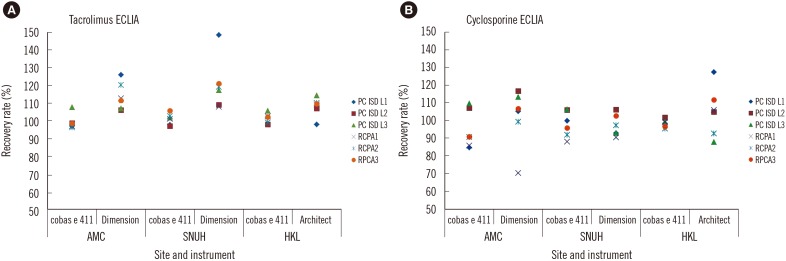
2. Accuracy
For the tacrolimus ECLIA, the recovery rates ranged from 96.9% to 107.7% for the PC ISD L1–3 samples, and from 96.2% to 105.7% for the RCPA samples (Fig. 1A). With the Architect tacrolimus assay, the recovery rates were from 97.8% to 114.4% for the PC ISD L1–3 samples and from 109.2% to 110.1% for the RCPA samples. Recovery rates were higher for the Dimension assay: between 106.1% and 148.6% for the PC ISD L1–3 samples, and between 107.8% and 121.1% for the RCPA samples.
For the cyclosporine ECLIA, recovery rates were between 84.6% and 109.6% for the PC ISD L1–3 controls, and between 85.7% and 98.9% for the RCPA samples (Fig. 1B). Recovery rates for the Architect cyclosporine assay ranged from 87.7% to 127.4% for the PC ISD L1–3 controls and from 92.6% to 111.6% for the RCPA samples. For the Dimension assay, the PC ISD L1–3 control recovery rates were between 92.7% and 116.5%, and between 70.2% and 106.6% for the RCPA controls.
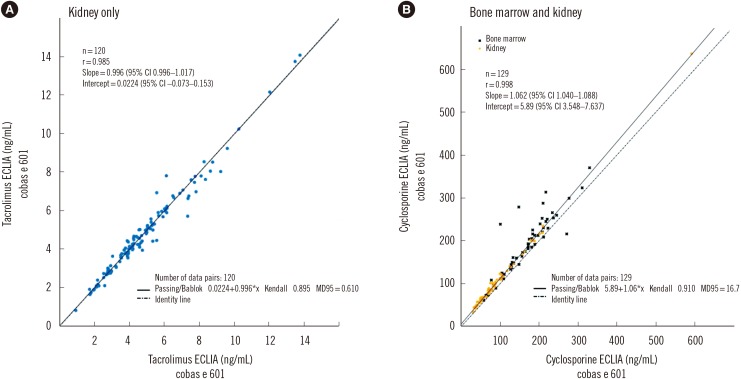
3. Lot-to-lot variability
The lot-to-lot variability results of the tacrolimus reagents (18285901 and 18542901) indicated good consistency between the lots. Passing–Bablok regression yielded a slope of 0.996, an intercept of 0.0224, and a Pearson correlation coefficient of 0.985 (Fig. 2A). The cyclosporine ECLIA reagents (18286001 and 18555801) also showed good consistency; the slope was 1.06, the intercept was 5.89, and the Pearson correlation coefficient was 0.998 (Fig. 2B).
4. Method comparisons
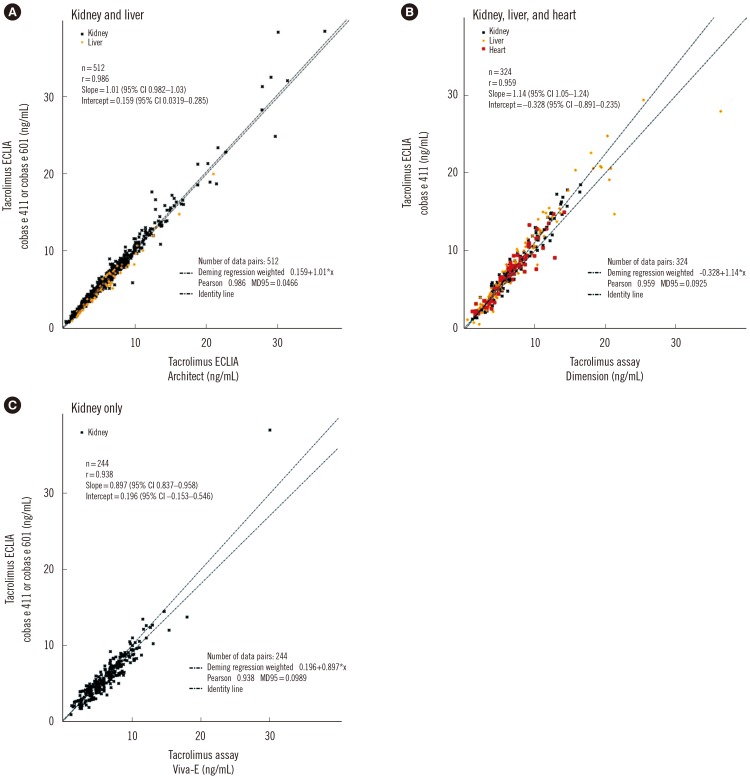
Based on Weighted Deming regression analysis, the agreement between tacrolimus ECLIA results of all (heart, kidney, and liver) transplant patient samples analyzed on the cobas e 601 and Architect systems was excellent, with a slope of 1.01, and a correlation coefficient of 0.986 (Fig. 3A). The results were similar when the kidney (slope, 1.01; r=0.986; see Supplemental Data Fig. S1A) or liver (slope, 1.00; r=0.989; Fig. S1B) samples were measured alone.
Comparison of assay results of all transplant patient samples analyzed on the cobas e 411 and Dimension systems yielded a slope of 1.14 (Fig. 3B) and revealed a good correlation (r=0.959). Similar results were obtained for individually assessed kidney samples (slope, 1.18; r=0.974; Fig. S1C), liver samples (slope, 1.15; r=0.958; Fig. S1D), and heart samples, which showed even higher agreement (slope, 1.05; r=0.934; Fig. S1E).
Kidney samples were used to evaluate the agreement between the cobas e 411 and the Viva-E system: a slope of 0.897 and a correlation coefficient of 0.938 were observed (Fig. 3C).
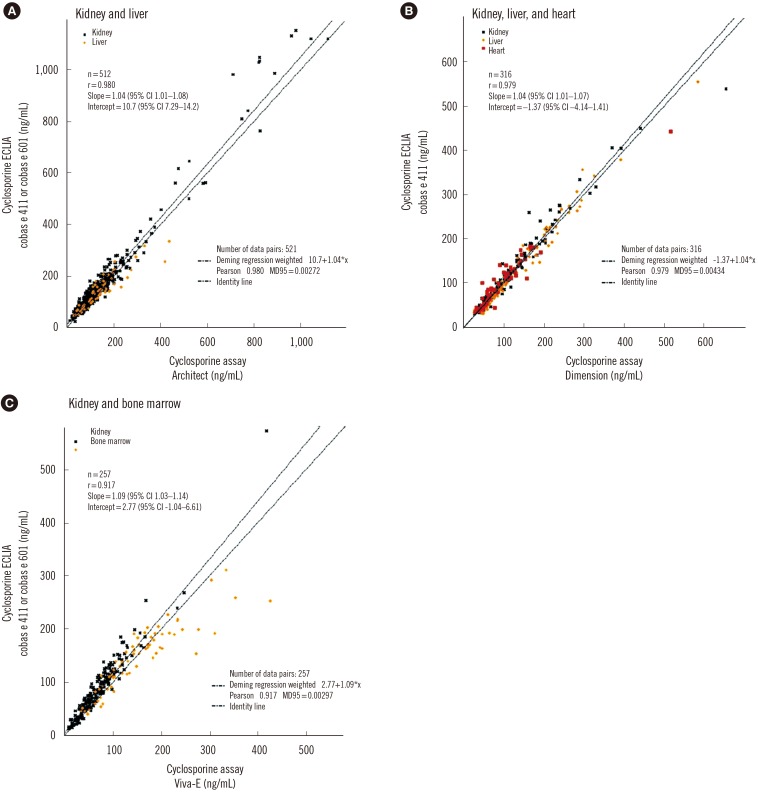
For cyclosporine immunoassays, 521 patient samples were used. The slope for the comparison of the cobas e 411 and Architect systems was 1.04 (r=0.980; Fig. 4A). The agreement between the two systems for kidney samples alone was better (slope, 1.07; r=0.984; see Supplemental Data Fig. S2A) than that for liver samples alone (slope, 0.877; r=0.912; Fig. S2B).
In total, 316 patient samples were analyzed for comparing the cyclosporine immunoassays on the cobas e 601 and Dimension systems. Weighted Deming regression analysis revealed a close agreement between the two immunoassays, with a slope of 1.04 and correlation coefficient of 0.979 (Fig. 4B). Examining the transplant samples by type, the slope values were also similar, when the kidney (slope 1.06, r=0.978; Fig. S2C), liver (slope 0.992, r=0.988; Fig. S2D), and heart (slope 1.09; r=0.962; Fig. S2E) samples were evaluated individually.
The agreement between the measured samples on the cobas e 411 versus the Viva-E system was calculated as 1.09 and the correlation coefficient was 0.917 (Fig. 4C). When measured individually, the slope of the comparison of the kidney samples was 1.26 (r=0.968; Fig. S2F), and for bone marrow it was 0.885 (r=0.895; Fig. S2G).
DISCUSSION
This was the first multi-center study to measure the analytical performance of the novel Elecsys tacrolimus and cyclosporine ECLIAs under routine conditions in an APAC patient population. We evaluated imprecision and accuracy of both ECLIAs and compared them with other immunoassays, using patient samples covering a wide range of transplant types.
Both ECLIAs exhibited mostly excellent precision across three centers. For the tacrolimus ECLIA, repeatability and reproducibility CVs were ≤6.1% for a wide concentration range of 2.72 to 27.47 ng/mL. The CV for the lowest concentration sample (HSP1) was higher, but the tacrolimus concentration of this sample was towards the lower end of the measuring range. For cyclosporine, repeatability and reproducibility CVs for serum samples across a wide concentration range (73.0 to 1,882.73 ng/mL) were ≤7.3%. Previously, the imprecision of the Elecsys tacrolimus and cyclosporine ECLIAs was evaluated in a European multicenter study [78], using the same control samples as in our study and in comparison with the Architect and Dimension systems. Repeatability CVs for both ECLIAs in the European study were comparable to those in our study [78]. According to recent guidelines for ISD monitoring of IATDMCT, repeatability CVs should be ≤10% [12]. All CVs in this study were below this threshold. For both the tacrolimus and cyclosporine ECLIAs, the repeatability CVs were generally superior or comparable to previously published CVs for the Architect [27282930], Dimension [29313233], and Viva-E [34] systems. However, it should be noted that these studies differed from ours in control types, sample sizes, and systems used, precluding direct comparisons.
The recovery rates in the accuracy experiments were favorable. For impartiality, proficiency testing samples from an independent source (RCPA) were included. The tacrolimus ECLIA showed recovery rates of ≤7.7%, compared with ≤48.6% for the Dimension assay and ≤14.4% for the Architect assay, when all samples were considered. Recovery rates for cyclosporine measurements showed lower variation and were closer to the target concentration using the cyclosporine ECLIA (≤15.4%) than with the Dimension (≤29.8%) and Architect (≤27.4%) assays.
One of the main advantages of this study was that it included method comparison experiments across a variety of transplant types and using a range of immunoassays, as recommended by the IATDMCT. Agreements with the Architect platform were close to 1.0; 1.01 (intercept, 0.159) and 1.04 (intercept, 10.7) for tacrolimus and cyclosporine ECLIAs, respectively, for all transplant types. Samples in the higher concentration ranges were more dispersed, but there were too few of these samples to draw any conclusions. According to the IATDMCT recommendations for ISD monitoring, the linear regression slope must be within 10% of the theoretical value of 1.0, and a linear regression intercept must not significantly differ from zero [12]. The Weighted Deming regression for tacrolimus assay comparison between the cobas e platform and the Architect platform was well within these IATDMCT criteria. However, the slope value (1.14) for the comparison of the tacrolimus assays on the cobas e and Dimension platforms deviated more than 10% from 1.0. Possible reasons for this deviation have been reported [12]. Firstly, calibration bias and between-method bias may change with time, as observed for the sirolimus microparticle enzyme immunoassay [35]. Secondly, cross-reactivity with other drugs and metabolites may occur; false-positives, most probably because of heterophilic antibodies, have been reported for immunoassays based on the ACMIA format [123637]. Results generated with tacrolimus microparticle enzyme immunoassay (MEIA) II-IMx (Abbott Laboratories), which has been taken off the market, were shown to be strongly affected by the sample hematocrit. Lastly, in addition to a lack of standard reference methods, comparison of analytical procedures is hampered by the absence of certified reference materials [1238]. Tacrolimus is the only ISD for which whole blood certified reference material is available (ERM-DA110a). For these reasons, and as recommended by IATDMCT committee, clinicians should be aware of these possible pitfalls when analyzing results, and continuous education is recommended.
When blood samples from patients having various transplant types were analyzed individually for tacrolimus, no major differences in slope values were observed in the method comparison experiment. The majority of transplant patient samples were within the measuring ranges of both tacrolimus (0.5–40 ng/mL) and cyclosporine (30.0–2,000 ng/mL) ECLIAs. Tacrolimus concentrations were generally lower in kidney (1.0–20.0 ng/mL) and heart (2.0–15.0 ng/mL) samples than in liver samples (0.5–33.0 ng/mL). Nonetheless, these lower concentrations were still within the reported assay measuring range and did not greatly affect the agreement between the ECLIA and the other immunoassays.
For the cyclosporine ECLIA comparisons between the cobas e platform and the Architect, Dimension, and Viva-E immunoassays, the slope values were generally comparable when samples for each transplant type were evaluated separately, with the exception of the Viva-E comparison for cyclosporine in kidney and bone marrow. Various transplant types have been shown to have more metabolites, and this could be the reason for the differences between kidney and bone marrow method comparisons [3940]. The concentration levels of cyclosporine in the samples varied, but they were generally higher in patients with kidney transplants (20–1,200 ng/mL) than in those with liver (30–600 ng/mL), heart (40–530 ng/mL), and bone marrow (60–450 ng/mL) transplants. As with the tacrolimus ECLIA, the wide concentration ranges found in patients with different transplant types did not markedly affect the agreement or correlation between the cyclosporine ECLIA and the other immunoassays.
This study had some limitations. Firstly, for the cyclosporine imprecision experiments, the measured concentration of HSP5 was too close to the assay detection limit (2,000 ng/mL); therefore, four data points were excluded from that particular analysis. However, all other control samples were within the measuring range. Secondly, in the method comparison experiments, transplant samples were not compared across all three analytical systems. A consistent approach would have been preferable; however, this was infeasible because of limited sample availability and different system types used at each site. Nonetheless, our data are therefore more representative of the diverse arrangements found in clinical laboratories in different countries. Thirdly, LC-MS/MS is the commonly used technology for ISD analysis and is often used to exclude potential interference effects from ISD metabolites; therefore, a comparison with LC-MS/MS would have been advantageous. However, immunoassays are more common and are routinely used in the APAC region, especially in stable transplant outpatients.
In conclusion, both the tacrolimus and cyclosporine ECLIAs demonstrated good assay precision, recovery, and lot-to-lot reagent consistency, and were comparable to currently available standard technologies for samples from patients in the APAC region with a range of transplant types. Our study, performed across multiple sites and countries, highlights that the tacrolimus and cyclosporine ECLIAs offer a highly sensitive and low-cost option for accurate TDM, and allows laboratories not equipped with specialist systems to measure ISD levels easily and effectively.
 XML Download