

 PDF
PDF ePub
ePub Citation
 Print
Print


INTRODUCTION
Liver fibrosis is a common pathologic manifestation of various chronic liver diseases toward the progression of hepatocellular carcinoma. The common causes of liver fibrosis are hepatitis B and C, alcoholic hepatitis, and nonalcoholic fatty liver disease [12]. Since liver fibrosis progression can be reversed by treatment for hepatitis B and C with antiviral agents [3], early diagnosis of liver fibrosis is important for guiding the treatment response and monitoring and predicting the progression to hepatocellular carcinoma.
Antiviral treatments have improved quality of life and treatment for patients with chronic hepatitis and liver fibrosis; however, a correct diagnosis of liver fibrosis is required for initiating the appropriate treatment and to predict response and disease prognosis. For this purpose, biomarkers for liver fibrosis and diagnostic modalities such as elastography have been developed and actively studied [4].
Liver fibrosis is conventionally diagnosed with liver biopsy, imaging, transient elastography (Fibroscan), and surrogate biomarkers [456]. Liver biopsy is the reference standard for the diagnosis of liver fibrosis based on histopathological grading [78], but informative data from the liver biopsy can be obscured because of a biopsy of small size, focal sampling and patient compliance [5]. Histologic diagnosis requires an experienced observer, and is hindered by inter-observer and intra-observer variations [5]. Liver stiffness measurement by Fibroscan utilizes wave and shear-wave velocity and has provided robust results in staging fibrosis, informing treatment strategies, prognostic predictions, and disease monitoring [36].
Surrogate markers for liver fibrosis have been developed using measurements of various biomarkers [49]. The most common indirect markers related to liver fibrosis include AST, ALT, platelet count, and marker combinations [1011]. Direct markers can be categorized as matrix-related markers, cytokines [12], and marker combinations [411]. The most well-studied direct markers of fibrosis are hyaluronic acid (HA), metalloproteinase, transforming growth factor-beta, and the enhanced liver fibrosis test (ELF, Siemens Healthcare Diagnostics, NY, USA), which is a combination of HA, type III procollagen amino terminal peptide (P3NP), and tissue inhibitor of metalloproteinase I (TIMP1). In addition, combinations of direct or indirect biomarkers with or without demographic data have been used to predict liver fibrosis [1314151617].
Recently, Wisteria floribunda agglutinin-positive Mac-2 binding protein with glycosylated isomers (WFA-M2BP), which is known to be secreted from the liver during fibrosis progression, has been developed as a biomarker for fibrosis [18192021]. This method involves an automated immunoassay to detect the abnormal glycosylation related to liver fibrosis that becomes agglutinated and can be detected by lectin [20]. Expression of abnormal glycosylation structures on the M2BP surface is detected by lectin from W. floribunda. In this assay, lectin is bound to a magnet with washing to decrease background signals. As M2BP shows abnormal glycosylation throughout the progression of liver fibrosis, this biomarker offers a new modality for diagnosis [20].
However, the majority of studies on WFA-M2BP as a biomarker have been performed for patients infected with hepatitis C virus, and there are few reports on the diagnostic efficacy of WFA-M2BP for patients infected with hepatitis B virus (HBV) [222324]. In this study, we evaluated and compared the utility of WFA-M2BP, ELF, Fibroscan, and conventional biomarkers, including FIB-4 and the AST-to-platelet ratio (APRI), for the diagnosis of liver fibrosis in patients infected with HBV.
METHODS
1. Patients
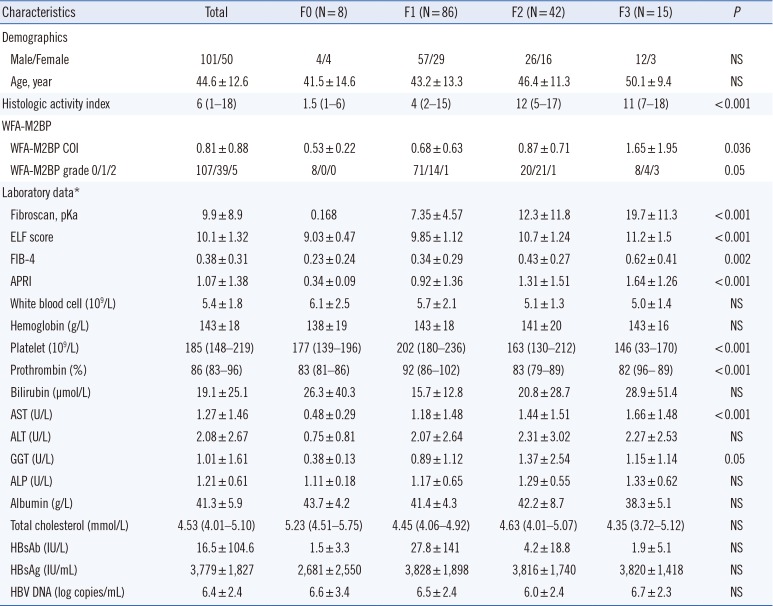
This was a single-center retrospective study. The protocol was approved by the Institutional Review Board of Seoul St. Mary's Hospital. A sorted sample of 151 patients (older than 18 years) diagnosed with chronic hepatitis B and who had a liver biopsy and Fibroscan test performed were enrolled from January 2011 to December 2013 after providing informed consent. Patients were excluded if they had any of the following conditions: previous history of administration of antiviral agents, evidence of an immunocompromised state (e.g., malignancy), liver disease other than chronic hepatitis B, and a previous diagnosis of decompensated cirrhosis [25]. The serum samples were collected at the time of liver biopsy and stored at −80℃ until measurement. The WFA-M2BP and ELF were measured form the frozen serum, and rest of the information was collected from electrical medical records. Chronic hepatitis B was diagnosed by detection of hepatitis B surface antigen (HBsAg) for more than six months. Demographic data, laboratory data, and baseline characteristics of patients were collected at the time of initial outpatient visit or initial admission (Table 1).
2. WFA-M2BP measurement
The clinical WFA-M2BP assay was performed by using an automated chemiluminescence enzyme immunoassay analyzer (HISCL-5000, Sysmex, Kobe, Japan). The measured result was presented as a cut-off index (COI) calculated as follows:
where WFA-M2BPsample is the measured value of patient serum sample, WFA-M2BPnc is the negative control value, and WFA-M2BPpc is the positive control, which was provided by the manufacturer. WFA-M2BP was graded as follows: COI<1.0, grade 0; 1≤COI<3.0, grade 1; 3.0≤COI, grade 2.
The precision of WFA-M2BP was assessed using CLSI EP05-A03 [26]. High- and low-level control samples provided by the manufacturer were measured in duplicate, twice a day, in analytical runs for 20 working days according to the manufacturer's instructions. R program (Free Software Foundation, Inc., Boston, USA) was utilized for statistical analysis.
The imprecision and repeatability of WFA-M2BP measurements for high- and low-level controls were estimated at 4.87% and 4.15%, respectively. Between-run and between-day imprecision were both less than 5%. However, within-laboratory imprecision, which is the sum of the repeatability, between-run, and between-day precision, was slightly higher at 7.12% and 6.91% for the high and low controls, respectively.
3. Liver biopsy and pathologic interpretation
An ultrasound-guided parenchymal liver biopsy was performed for all enrolled patients by a clinician or radiologist at the time of collecting serum samples. After local anesthesia, the cutting needle was fired to the targeted region under guidance of ultrasound imaging. A tissue sample longer than 2 cm was stained and scored for the degree of fibrosis according to the Knodell histologic activity index (HAI) as follows: F0, none; F1, fibrous portal expansion; F2, bridging fibrosis; and F3, cirrhosis [23].
4. Transient elastography (Fibroscan)
Liver stiffness was measured at the time of collecting serum samples according to transient elastography with Fibroscan (Echosens, Paris, France) based on wave and shear-wave velocity. The probe was vertically positioned at the intercostal spaces above the right lobe of the liver, and the shear-wave velocity, expressed in kilopascals, was measured more than 10 times. The median and interquartile range for the shear-wave velocity were automatically recorded. The result was accepted when the interquartile value divided by the median value was less than 0.3 [36].
5. Laboratory examination
Laboratory data were collected at the time of the initial visit or upon initial admission to the hospital. Complete blood count results, including hemoglobin, white blood cell count, platelet count, and prothrombin time, and blood chemistry data were recorded. HBV DNA copy level was measured using automated preparation of DNA and real-time PCR kits (Abbott, Illinois, USA). The ELF test, which consisted of HA, P3NP, and TIMP1, was measured using an ADVIA Centaur XP automated immunoassay analyzer (Siemens Healthcare Diagnostics, NY, USA). The FIB-4 and APRI scoreswere calculated using laboratory data as follows [2326]:

6. Statistical analysis
Demographic data and baseline characteristics are presented as mean values with standard deviations for continuous variables and parameters following non-normal distribution were listed as median and interquartile range. Comparison of each group was performed using the Kruskal-Wallis and Chi-square test for continuous and discrete variables, respectively. Diagnostic accuracy was analyzed using ROC curves. The ROC curves of WFA-M2BP, FIB-4, APRI, ELF, and Fibroscan were compared using a non-parametric method. As cut-off values, the maximum area under the ROC curve (AUC) was selected and estimated with the SE of the AUC value. The sensitivity, specificity, positive and negative predictive values (PPV and NPV, respectively), and accuracies were calculated with a 95% confidence interval.
To predict fibrosis stage ≥2 or 3, univariate and multivariate analyses were performed using logistic regression. All variables were entered using the backward Wald method. All remaining statistical analyses were performed using Medcalc software version 9.0 (Medcalc, Mariakerke, Belgium).
RESULTS
1. Baseline characteristics and comparison of patients at different fibrosis stages
As shown in Table 1, the majority of patients were determined to be at fibrosis stage F1, followed by F2, F3, and F0 based on histologic activity. In addition, the majority of patients were in WFA-M2BP grade 0, followed by grade 1 and grade 2. The WFA-M2BP,FIB-4, APRI, ELF, and Fibroscan results showed statistically significant differences among different fibrosis levels. With respect to the laboratory data, platelet count, prothrombin, AST, and gamma-glutamyl transferase values showed significant differences among fibrosis stages.
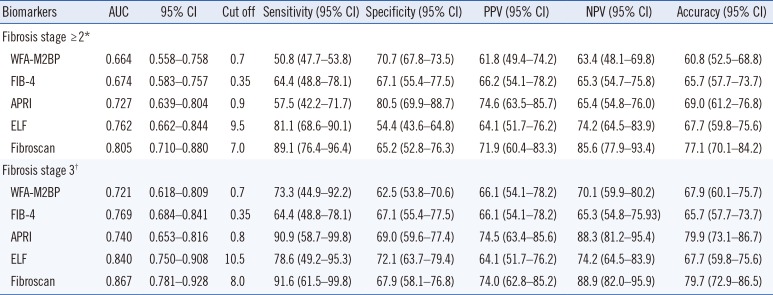
2. Diagnosis of liver fibrosis stage ≥2 or 3 by ROC curve analysis
The AUC, sensitivity, specificity, PPV, NPV, and accuracy values are listed in Table 2. Pairwise statistical comparison of ROC curves revealed that only WFA-M2BP and Fibroscan significantly differed with respect to the ability of diagnosing fibrosis stage ≥2 (P =0.019); none of the other biomarkers or their combinations showed statistically significant differences in diagnostic ability. Among the biomarkers tested, Fibroscan revealed the highest AUC values, and WFA-M2BP, FIB-4, APRI, and ELF revealed similar results for the diagnosis of fibrosis stage ≥2. However, none of the markers showed statistically significant differences for the diagnosis of fibrosis stage 3 based on pairwise comparison of ROC curves. Specifically, WFA-M2BP, FIB-4, APRI, ELF, and Fibroscan revealed similar AUC values of approximately 0.7–0.8, with no statistical significance. The tested biomarkers revealed an overall diagnostic accuracy of approximately 60–70% for the diagnosis of fibrosis stage ≥2 and 3, respectively. The comparison of the tested markers for the diagnosis of fibrosis stage ≥2 and 3 is shown as box plots in Supplemental Data Fig. S1 and S2, respectively. WFA-M2BP, APRI, and ELF showed significant predictive ability for fibrosis stage ≥2, whereas ELF showed significant predictive ability for fibrosis stage 3.
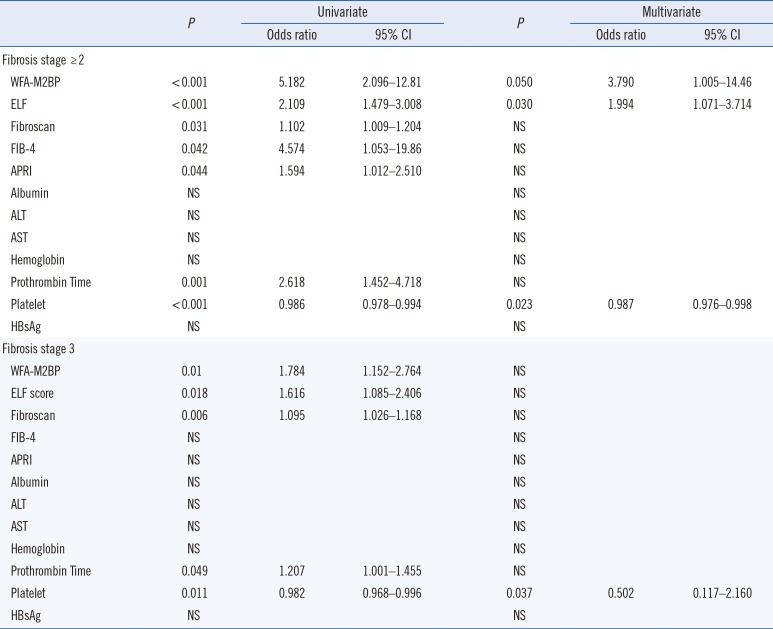
3. Predictive factors of liver fibrosis stage ≥2 and 3
The most useful predictors of fibrosis stage ≥2 and 3 were evaluated among WFA-M2BP, ELF score, Fibroscan, albumin, ALT, AST, hemoglobin, prothrombin time, platelet count, and HBsAg (Table 3). Univariate analysis showed that WFA-M2BP, ELF, Fibroscan, FIB-4, APRI, prothrombin time, and platelet count were significantly associated with fibrosis stage ≥2, whereas WFA-M2BP, ELF, Fibroscan, prothrombin time, and platelet count were significantly associated with fibrosis stage 3. Multivariate analysis was performed using the factors that emerged as significant in the univariate analysis, which revealed that WFA-M2BP, ELF, and platelet could predict liver fibrosis stage ≥2 with an odds ratio of 3.790, 1.994, and 0.987, respectively. Only platelet count remained a statistically significant predictor of fibrosis stage 3 in multivariate analysis, with an odds ratio of 0.502.
DISCUSSION
Although the mechanisms and incidence of fibrosis regression remain controversial, there is growing evidence that fibrosis typically regresses by more than 1 score after nucleoside therapy in patients infected with HBV [4]. Therefore, diagnosis of fibrosis stage 2 and 3 is important for patient follow-up. In addition, the diagnosis of fibrosis stage 3 by WFA-M2BP has been reported to be related to the development of hepatocellular carcinoma among patients infected with HCV and HBV [1921]. Although additional data are required, establishing a firm association between WFA-M2BP and hepatocellular carcinoma could represent a breakthrough in early cancer diagnosis.
Our findings indicate that the newly developed WFA-M2BP biomarker can be useful for the diagnosis of liver fibrosis in patients with chronic hepatitis B. As WFA-M2BP represents a single biomarker and has not been associated with any particular technical issues, it could be a relatively efficient biomarker. Although a combination of biomarkers or a composite biomarker for liver fibrosis could increase the diagnostic accuracy, this might lead to complications in generating data and maintaining the quality of results.
This study included patients with chronic HBV infection in contrast to previous studies on WFA-M2BP that mainly focused on patients with chronic hepatitis C. Globally, the prevalence of chronic HBV infection ranges from 0.03% to 22.7%, depending on the country [2728], whereas HCV has a worldwide prevalence of 0.9–6.0% [2930]. Additional studies are required to improve the diagnosis of liver fibrosis among chronic hepatitis B patients in various geographic regions. In addition, the AUC value of WFA-M2BP for the HBV patients in the present study are similar but somewhat lower than those reported for HCV patients [222324]. The reason for this difference is unclear, requiring further studies.
Univariate and multivariate analyses revealed that WFA-M2BP, ELF, and platelet count could predict liver fibrosis stage ≥2. Fibroscan, which demonstrated the highest AUC value, was not statistically significant in our model. The odds ratio of WFA-M2BP was 3.790, which was the highest among the tested biomarkers, which could support the diagnosis and prediction of liver fibrosis. However, only platelet count emerged as a significant predictor of liver fibrosis stage 3 in the multivariate analysis, which is in line with previous results [31].
The chief limitations of this study are the relatively small sample size (N=151) and the lack of prognostic analysis for predicting hepatocellular carcinoma due to the short period among the enrolled HBV patients. In addition, approximately 50% of the patients were diagnosed with a fibrosis score of 1, resulting in unbalanced patient numbers across the fibrosis grades; therefore, comparison of each stage could not be performed.
In conclusion, WFA-M2BP can support a diagnosis of liver fibrosis and demonstrated discriminative properties for chronic hepatitis B patients at different stages of liver fibrosis. Further studies with larger sample sizes are required to validate the clinical application of WFA-M2BP.
 XML Download